. 2024 Mar 4;7(1):261.
doi: 10.1038/s42003-024-05933-z.

Regulation of developmental gatekeeping and cell fate transition by the calpain protease DEK1 in Physcomitrium patens

Affiliations

Regulation of developmental gatekeeping and cell fate transition by the calpain protease DEK1 in Physcomitrium patens

Viktor Demko et al. Commun Biol. .

Abstract

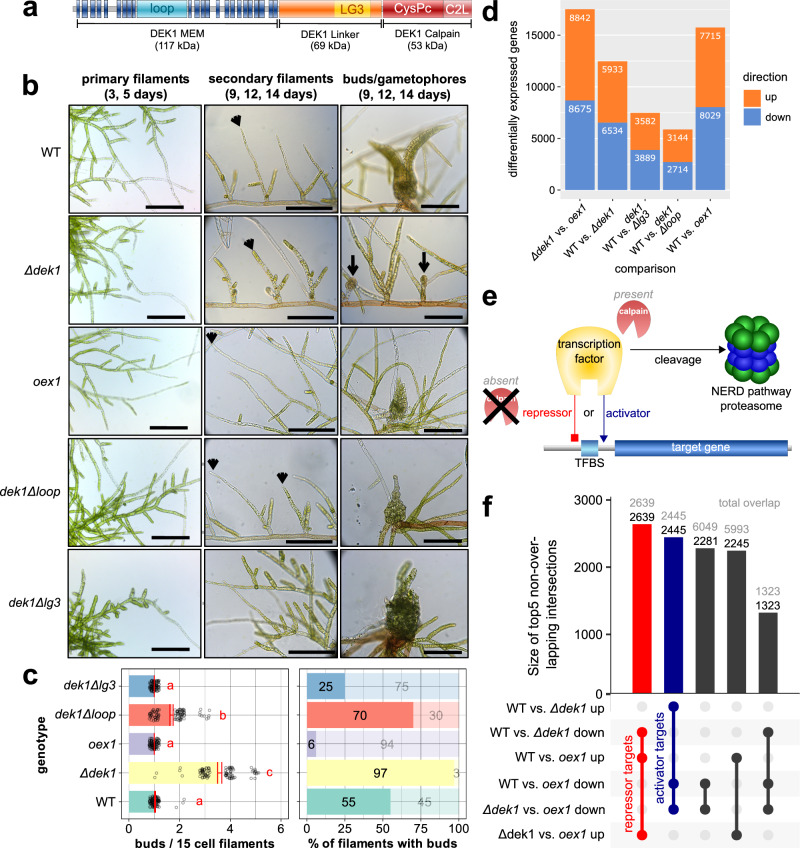
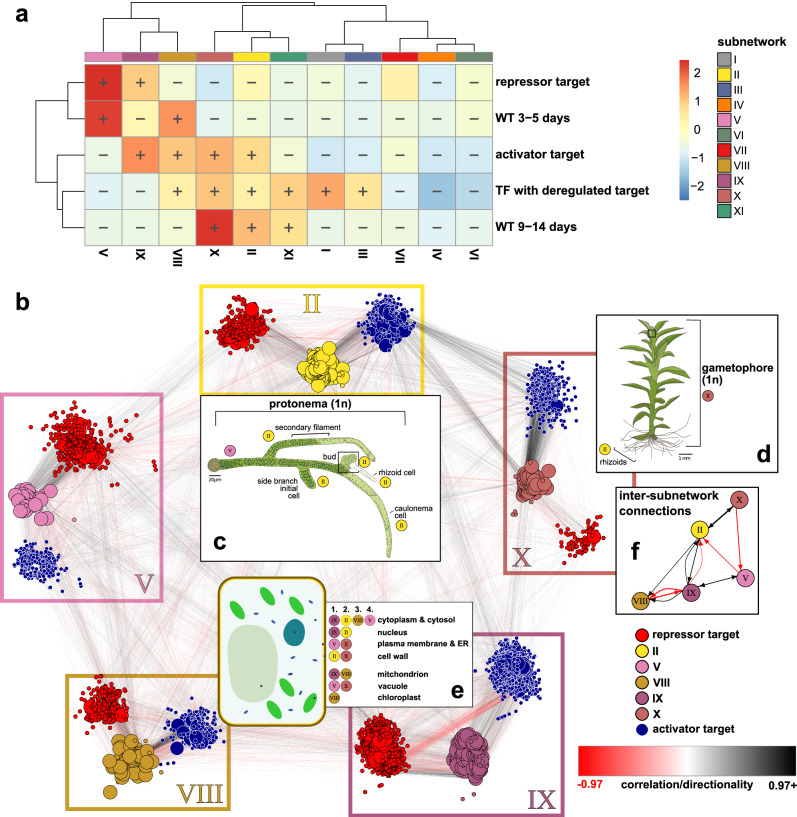
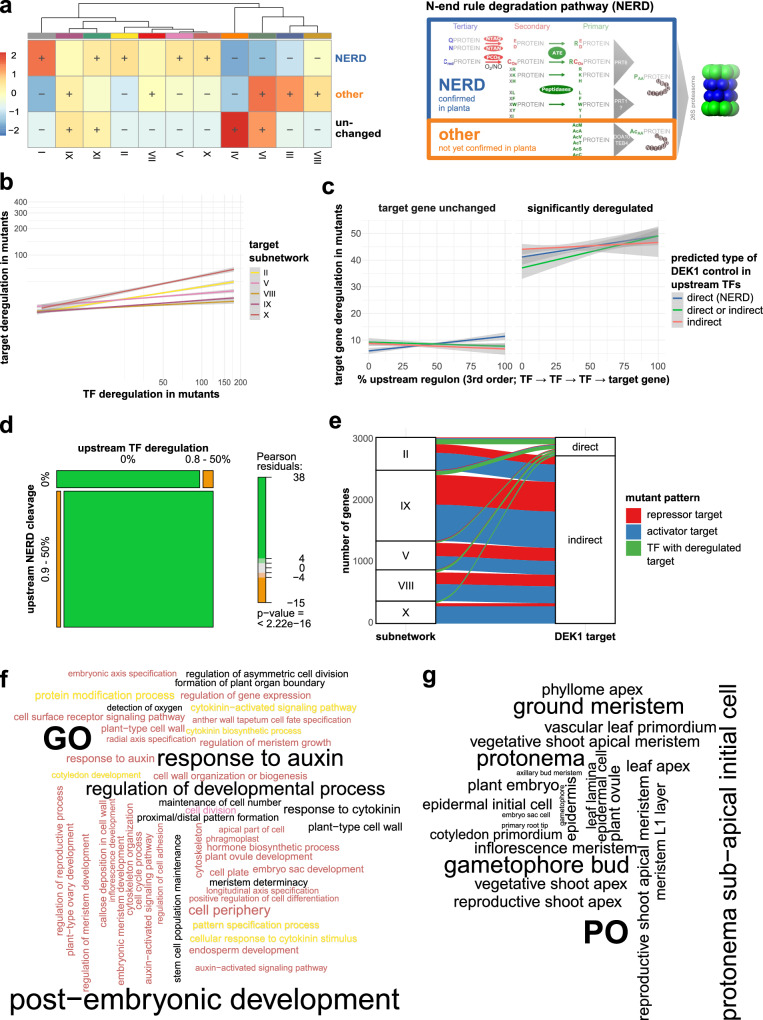
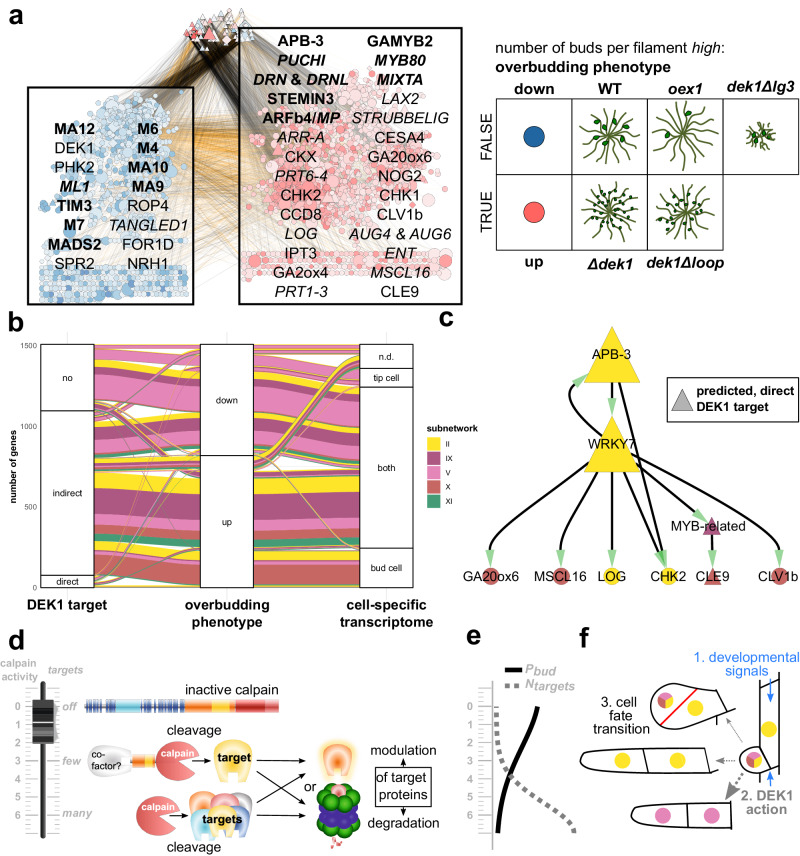
Calpains are cysteine proteases that control cell fate transitions whose loss of function causes severe, pleiotropic phenotypes in eukaryotes. Although mainly considered as modulatory proteases, human calpain targets are directed to the N-end rule degradation pathway. Several such targets are transcription factors, hinting at a gene-regulatory role. Here, we analyze the gene-regulatory networks of the moss Physcomitrium patens and characterize the regulons that are misregulated in mutants of the calpain DEFECTIVE KERNEL1 (DEK1). Predicted cleavage patterns of the regulatory hierarchies in five DEK1-controlled subnetworks are consistent with a pleiotropic and regulatory role during cell fate transitions targeting multiple functions. Network structure suggests DEK1-gated sequential transitions between cell fates in 2D-to-3D development. Our method combines comprehensive phenotyping, transcriptomics and data science to dissect phenotypic traits, and our model explains the protease function as a switch gatekeeping cell fate transitions potentially also beyond plant development.


Conflict of interest statement

The authors declare no competing interests.

Figures

Fig. 1
Fig. 1. Phenotypes and transcriptome profiling of dek1 mutant lines in P. patens.
a DEK1 protein domain structure. b Time series analysis of P. patens juvenile gametophyte development in WT, a DEK1 calpain domain overexpressor (oex1), a complete deletion of the DEK1 gene (Δdek1) and two partial deletion lines lacking the loop (dek1Δloop); or the LG3 domain (dek1Δlg3). Microscopy images (scale bars: 200 μm) show primary filaments in early stages of protonemata development (3, 5 days), secondary filaments (9–14 days; arrowheads point to apical cells of individual secondary filaments), buds and gametophores (9–14 days; arrows point to arrested buds in Δdek1). c Quantitative analysis of gametophore apical stem cell (bud) formation in dek1 mutants (y-axes both panels: color-coded genotypes). The frequency of meristem initiation is expressed as mean number of buds per 15-cell-long filament (left panel, n = 100) and percentage of filaments forming buds (right panel, n = 100). Statistical significance at 95% confidence is indicated in left panel for mean number of buds (red annotation: ac). Analysis of variance (ANOVA) and least significant difference (LSD) test were performed in multiple sample comparisons. Individual black open circles in left panel indicate individual data points. Red error-bars in left panel indicate standard errors. Lighter colored bars (alpha transparency) in right panel indicate percentages of filaments without bud. d Pairwise differential time series gene expression analysis of dek1 mutants at 3, 5, 9, 12 and 14 days. Stacked bar chart of significantly differentially expressed genes (DEGs) with a false discovery rate (FDR) < 0.1. Orange, upregulated genes; light blue, downregulated genes. e Working model for the gene-regulatory role of DEK1/calpains. When active calpain is present, a TF is cleaved and targeted to the N-end rule degradatory (NERD) pathway, resulting in loss of gene regulation. In the absence of active calpain, the TF regulates target gene expression either as an activator (blue) or repressor (red). f Size of the top 5 intersections between the DEG sets in (d). Numbers above bars depict the proportion unique to the given set (black) as well as the total (gray) size of each intersection. The largest set (red) comprises 2639 genes, which are downregulated in Δdek1 and upregulated in oex1, making these genes targets of DEK1-controlled repressors. The second-largest set (blue) comprises 2445 genes that are upregulated in Δdek1 and downregulated in oex1, likely controlled by DEK1-targeted activators. These sets represent the most conservative lists, as the third intersection likely contains additional activator targets with weak FDR support in the comparison of Δdek1 and the WT.
Fig. 2
Fig. 2. Tracing DEK1-misregulated genes and their upstream regulators in the predicted P. patens gene-regulatory network (GRN) highlights subnetworks that encode the developmental transitions governed by DEK1.
Prediction of regulatory interactions with subsequent clustering results in 11 subnetworks (Supplementary Fig. S2a). a Network enrichment analysis highlighting specific overrepresented subnetworks among DEK1-misregulated gene sets (activator and repressor targets) and their upstream regulators (TFs with misregulated target) as well as the distinct phases of WT development (WT 3–5 and 9–14 days). See Fig. S2d for overlap analysis of these gene sets. Heatmap represents the ratio between observed and expected sizes of specific candidate gene sets among the identified subnetworks. Significant (FDR < 0.01) enrichment (+) or depletion (−) is shown. Ratios were clustered for both rows and columns using the ward.D2 method. b Network graph of the five DEK1-misregulated subnetworks: for each enriched subnetwork (II, V, VIII, IX and X), all genes with an activator (blue nodes) or repressor (red nodes) misregulation pattern in the dek1 mutants (Fig. 1f) are shown as nodes together with unchanged, direct upstream TFs (using subnetwork color codes) as a triangular subgraph in subnetwork-color-framed boxes. Node sizes are scaled by local-reaching centrality, i.e., the fraction of the total subnetwork that can be reached via regulator → target connections. Edges, representing the predicted regulatory interaction between a TF and its target, are colored according to putative directionality, with negative, repressive interactions in red and positive, activating regulatory interactions in black. Insets (c) and (d) significantly enriched developmental stages and tissue or cell types. c Schematic of the predicted roles of subnetworks V and II in the different cell fates comprising the haploid protonema stage. d Schematic of the haploid, leafy, juvenile gametophore that, except for the filamentous rhizoids encoded by subnetwork II, is predominantly implemented by subnetwork X. e Schematic of a plant cell depicting the significantly enriched intracellular localizations of DEK1-controlled subnetworks. In the accompanying text box, subnetworks are ranked (1–4) according to the percentages of genes with terms affiliated with the respective compartment. f Small network plot showing major significantly enriched inter-subnetwork connections (Pearson residuals > 4; Supplementary Fig. S4). Drawings of the Physcomitrium protonema (c) and gametophore (d) stages adapted from ref. . Drawing of plant cell (e) adapted from Wikimedia Commons User Domdomegg. Subnetwork assignments to developmental stages and cell types (c, d) are based on network enrichment of stage-specific DGE sets inferred from Physcomitrium gene atlas data. Ranked subnetwork assignment of subcellular localizations (e) is based on ontology enrichment analysis of GO cellular component terms (Supplementary Fig. S3 and Supplementary Data S3).
Fig. 3
Fig. 3. Loss of DEK1 function causes global misregulation of the moss GRN in accordance with the pleiotropic phenotype of dek1 mutants and is consistent with a post-translational role of plant calpain in the regulation of TF stability.
a Network enrichment analysis (NEAT) of the prevalence of three specific N-terminal amino acid signature types in predicted calpain cleavage sites of encoded moss proteins. Two of these signature types have been identified in mammals to activate the NERD pathway, resulting in ubiquitylation and subsequent degradation by the 26S proteasome (extended panel on the right adapted from ref. ). While the first route has been confirmed to be active in the moss and other plants (NERD), the second route (other) via acetylation of N-terminal residues has not yet been demonstrated in planta. The third class represents proteins with no cleavage or sites with N-terminal residues that would not attract the NERD pathway (unchanged). The heatmap shows the ratio between observed and expected sizes of specific candidate gene sets encoding for proteins enriched for these types of cleavages among the identified subnetworks. Significant (FDR < 0.01) enrichment (+) or depletion (−) is shown. b Target gene misregulation in dek1 mutants is positively correlated with the misregulation of direct upstream TFs. Linear relationship of target gene and TF misregulation in DEK1 mutants in the five most affected subnetworks. Misregulation of both types of genes is again depicted as the cumulative effect size of the LRTs in each gene. Lines depict the result of generalized linear regression of the cumulative misregulation of TF genes (x-axis) and their target genes (y-axis) for each of the five subnetworks. Gray areas depict 95% confidence intervals. c Target gene misregulation shows a positive, linear correlation with the fraction of directly and indirectly DEK1 calpain-controlled upstream TFs. Linear regression analysis of the cumulative misregulation of target genes (y-axis; sum of Likelihood-ratio test (LRT) effect sizes) and the percentage of the upstream TFs for each gene where TFs are either directly NERD-targeted by DEK1 (blue line; i.e., classified as NERD-type cleavage, a), indirectly DEK1 targeted (orange line; i.e., significantly misregulated; contained in gene sets displayed in b and Fig. 1f) or either of the two types (green line) for unchanged (left plot) and significantly misregulated (right plot; FDR < 0.1) target genes. Upstream regulons for each target gene in subnetworks II, V and X were evaluated up to third-order relationships. Gray areas depict 95% confidence intervals. d DEK1 calpain-dependent misregulation in the three subnetworks implementing the 2D-to-3D transition: misregulated genes in subnetworks II, V and X display significant enrichment of putative NERD-type calpain cleavages and misregulation of upstream TFs. Mosaic plot showing the relative proportions of significantly misregulated genes in dek1 mutants depending on the binary status of their upstream regulon with respect to predicted levels of DEK1 control (x-axis: predicted NERD-type calpain cleavages i.e., direct DEK1 targets; y-axis indirect DEK1 targets). Binary status defines whether the regulon comprises TFs predicted as direct (x) or indirect (y) DEK1 targets (>0% of the TFs) or not (= 0% TFs). Boxes are colored based on Pearson residuals from a significant χ2 test of the cross-table comparing the proportions of both binary classes. e Alluvial plot depicting the distribution of the filtered, predicted direct and indirect DEK1 targets among the five predominantly controlled subnetworks. Color-coding of bands reflects directionality of misregulation patterns in the mutant lines (see Fig. 1f for details). Green bands represent unaffected upstream TFs predicted to control the significantly misregulated target genes. f Significantly enriched Gene Ontology (GO) terms associated with direct and indirect DEK1 target genes are overrepresented in processes related to observed DEK1 phenotypes in flowering plants and the moss. Word cloud depicts filtered, significantly enriched GO biological processes and cellular components (FDR < 0.1). Text color code depicts subnetwork identity (i.e., subnetworks II, V and X) of (indirect) target gene. Black text corresponds to overall enrichment among target genes. g Overrepresented tissue and cell type localizations consistent with dek1 phenotypes and expression patterns. Based on enrichment analysis using Plant Ontology (PO) term annotations for moss genes or their flowering plant orthologs. Word cloud of selected plant anatomical entity PO terms displaying an overall enrichment among direct and indirect DEK1 target genes (FDR < 0.1).
Fig. 4
Fig. 4. Tracing the overbudding mutant phenotype to deeply conserved, DEK1-guarded meristematic regulons controlling the 2D-to-3D transition.
a Factorial Differential Gene Expression Network Enrichment Analysis (FDGENEA) of the overbudding phenotype reveals enriched subnetworks and upstream regulators associated with high number of buds per filament that comprise key factors in plant meristematic and primordial cell fate control. Network plot of genes with significant association to overbudding (left [blue: overbudding = FALSE] and right node [red: overbudding = TRUE] groups in background of overlaid text boxes) and direct, upstream regulators without significant association (top node group). Foreground text boxes display exemplary, predicted DEK1 targets from the overbudding up regulated (right = red) and downregulated (left = blue) gene sets with experimental evidence in flowering plants or the moss. Bold font indicates TFs; italic font indicates predicted moss genes whose Arabidopsis orthologs have consistent experimental data connected to DEK1 phenotypes. Nodes are color-coded by the kind and strength of a gene’s association with the overbudding trait (color intensity gradient relative to Log-fold-change in DGE analysis; up = positive = red; down = negative = blue). Node sizes relative to the cumulative, absolute misregulation fold-change of the respective gene and any predicted downstream target gene in the mutants. Node shapes: triangles, TFs; diamonds, transcription regulators; inverted triangles, miRNAs, circles, targets. Edge color and intensity: correlation coefficient of connected nodes in dek1 RNA-seq data (black = positive; orange = negative). Panel at right depicts genotypes used and respective phenotypic character state of the overbudding trait (number of buds per filament high: FALSE ⇔ TRUE) in WT and dek1 mutant lines. b Overbudding-upregulated DEK1 targets from subnetworks II and X are enriched in the previously identified bud cell transcriptome. Alluvial diagram depicts the proportional distribution of subnetworks shared between three categorical sets: left to right, DEK1 target: predicted direct and indirect DEK1 targets; overbudding phenotype: genes with significant association with the overbudding phenotype (up ⇔ down); cell-specific transcriptome; n.d., not detected; specific to protonemal tip cell; detected but no significant difference between both cell types; specific to gametophore bud cell. Band coloring is based on subnetworks. c Key components of the moss CLAVATA3-like peptide (CLE9) and receptor-like kinase (CLV1b) pathway are predicted to be downstream of an overbudding upregulated, DEK1-controlled regulon that comprises a 2D-to-3D master regulator (APB3) and integrates several developmental signals: gibberellin/kaurene (GA20ox6), cytokinin (LOG, CHK2), mechanical stress (MSCL16), peptide (CLE9). Network graph depicts the immediate regulatory context of CLV1b. Full regulatory context is shown in Supplementary Fig. S10i. Node sizes are relative to the overall local reaching centrality (fraction of downstream nodes in the global network). Node coloring based on subnetwork affiliation. Triangular nodes are predicted to represent direct cleavage targets of the DEK1 calpain. All predicted regulatory interactions are positive, i.e., show positive correlation in WT and mutants along the RNA-seq time course. df Proposed role of DEK1 as a fine-tunable, developmental switch gatekeeping cell fate transitions. Model illustrating the proposed relationship between the level of free calpain activity, the number of direct and indirect targets, and the developmental consequences in three panels with a shared y-axis (calpain activity). d Model describing three primary DEK1 calpain states (top to bottom): off: immobile, inactive calpain in full-length DEK1 protein in plasma membrane; few: mobile, constrained calpain, released by auto-catalytic cleavage at several possible locations in the Linker-LG3 domain (External File DEK1.jvp; level of calpain activity, localization, half-life and number/kind of targets might be dependent on co-factor interaction); many: mobile, unconstrained calpain, pure calpain released by auto-catalytic cleavage directly before or in the CysPc domain. e Proposed relationship between the number of DEK1 calpain targets (Ntargets = dashed curve) and the probability of a protonemal cell gaining the bud initial cell fate, i.e., gametophore apical stem cell (Pbud = solid curve). f Schematic drawing of the cellular fate transitions affected in the overbudding phenotype in three steps.

References

    1. Casey MJ, Stumpf PS, MacArthur BD. Theory of cell fate. Wiley Interdiscip. Rev. Syst. Biol. Med. 2020;12:e1471. doi: 10.1002/wsbm.1471. - DOI - PMC - PubMed
    1. Shao W, Dong J. Polarity in plant asymmetric cell division: division orientation and cell fate differentiation. Dev. Biol. 2016;419:121–131. doi: 10.1016/j.ydbio.2016.07.020. - DOI - PMC - PubMed
    1. Takada S, Iida H. Specification of epidermal cell fate in plant shoots. Front. Plant Sci. 2014;5:49. doi: 10.3389/fpls.2014.00049. - DOI - PMC - PubMed
    1. Olsen OA. The modular control of cereal endosperm development. Trends Plant Sci. 2020;25:279–290. doi: 10.1016/j.tplants.2019.12.003. - DOI - PubMed
    1. Lid SE, et al. The defective kernel 1 (dek1) gene required for aleurone cell development in the endosperm of maize grains encodes a membrane protein of the calpain gene superfamily. Proc. Natl Acad. Sci. USA. 2002;99:5460–5465. doi: 10.1073/pnas.042098799. - DOI - PMC - PubMed

Publication types