. 2024 Mar 4;7(1):265.
doi: 10.1038/s42003-024-05941-z.

An array of signal-specific MoYpd1 isoforms determines full virulence in the pathogenic fungus Magnaporthe oryzae

Affiliations

An array of signal-specific MoYpd1 isoforms determines full virulence in the pathogenic fungus Magnaporthe oryzae

Sri Bühring et al. Commun Biol. .

Abstract

Magnaporthe oryzae is placed first on a list of the world's top ten plant pathogens with the highest scientific and economic importance. The locus MGG_07173 occurs only once in the genome of M. oryzae and encodes the phosphotransfer protein MoYpd1p, which plays an important role in the high osmolarity glycerol (HOG) signaling pathway for osmoregulation. Originating from this locus, at least three MoYPD1 isoforms are produced in a signal-specific manner. The transcript levels of these MoYPD1-isoforms were individually affected by external stress. Salt (KCI) stress raised MoYPD1_T0 abundance, whereas osmotic stress by sorbitol elevates MoYPD1_T1 levels. In line with this, signal-specific nuclear translocation of green fluorescent protein-fused MoYpd1p isoforms in response to stress was observed. Mutant strains that produce only one of the MoYpd1p isoforms are less virulent, suggesting a combination thereof is required to invade the host successfully. In summary, we demonstrate signal-specific production of MoYpd1p isoforms that individually increase signal diversity and orchestrate virulence in M. oryzae.


Conflict of interest statement

The authors declare no competing interests.

Figures

Fig. 1
Fig. 1. Simplified illustration of the five major alternative splicing (AS) patterns.
The exons are represented as boxes and the introns as lines. The AS of the pre-mRNA via exon skipping (ES), intron retention (IR), alternative 5′ or 3′ splice sites (5′ ASS, 3′ ASS) and mutually exclusive exons (MXE) can produce different proteins.
Fig. 2
Fig. 2. Localization of GFP-fused total MoYpd1p and different MoYpd1p isoforms.
A Translocation of GFP-fused total MoYpd1p 1 min after salt (KCl [1 M] and NaCl [0.75 M]) or sorbitol [1 M] treatment. The GFP signal in the untreated control was distributed throughout the cytoplasm of the mutant strain ΔMoypd1::GFP-MoYPD1. B Localization of GFP-fused MoYpd1p isoforms. After treatment with KCl [0.75 M], the translocation into the nucleus was observed for MoYpd1p_T0 and MoYpd1p_T2. However, MoYpd1p_T1 was found to accumulate in the nucleus upon sorbitol stress [1 M]. C Lesions on rice leaf surfaces three days after inoculation with M. oryzae. Detached rice leaves were inoculated with a conidial suspension of the wildtype strain 70-15, ΔMoypd1::MoYPD1-GFP, ΔMoypd1::MoYPD1_T0-GFP, ΔMoypd1::MoYPD1_T1-GFP or ΔMoypd1::MoYPD1_T2-GFP. Mutant strains producing only one of the isoforms were found to cause fewer disease symptoms on the leaves compared to the control strains.
Fig. 3
Fig. 3. Evaluation of RNA-seq data.
A Heat map of RNA-Seq transcriptome analysis for AS Events from M. oryzae under unstressed and stressed conditions (0 min, 25 min and 180 min after treatment with 0.5 M KCl. 3’ ASS and 5’ ASS were found to be the most common AS patterns following KCl stress induction. B Sashimi plot visualized the AS pattern of MoYPD1 during 0.5 M KCl stressed and unstressed conditions. In addition to the annotated introns of MGG_07173T0 and MGG_07173T1, additional splice junctions are shown (see asterisk).
Fig. 4
Fig. 4. MoYPD1 isoform expression analysis.
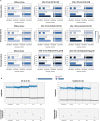
A (Top): Heat plot of MoYPD1 isoform expression under different conditions. Isoosmotic conditions result in the highest FPKM values for MoYPD1_T1. The expression level of isoform T0 after 25 and 180 min of 0.5 M KCl treatment exceeds that of MoYPD1_T1, resulting in MoYPD1_T0 being the dominantly expressed isoform. However, the transcript level of isoform T1 is highest after sorbitol stress (middle). The fludioxonil triggered expression is also different since isoform T4 is produced at the highest level. B ddPCR result of the conserved MoYPD1 region. Top:1 D plot of ddPCR reaction under KCl- and sorbitol-stressed conditions. A blue dot indicates a positive droplet containing at least one copy of MoYPD1 and a gray dot indicates a negative droplet lacking any target DNA. Bottom: Concentrations (copies/μl) of the conserved MoYPD1 region, as processed by QuantaSoftware™. The error bars show the maximum and minimum Poisson distributions for the 95% confidence interval.
Fig. 5
Fig. 5. High osmolarity glycerol pathway in M. oryzae.
MoYpd1p_T0 and MoYpd1p_T1 translocate to the nucleus after sensing KCl and sorbitol stress by MoSln1p and MoHik1p, respectively. Depending on the stress, phosphorylated Mohog1p and dephosphorylated Moypd1p_T0 or MoYpd1p_1 initiate a response in the nucleus.
Fig. 6
Fig. 6. Overview plasmid design via Gibson Assembly.
Schematic representation of the construction of the different plasmids is shown. The amplified fragments and their order are visualized in different colours.
Fig. 7
Fig. 7. Workflow of RNA Seq analysis via Cufflinks.
The order of different bioinformatic workflows is schematically represented. Cufflinks was used, then FASTQ files of two experimental conditions (with and without stress induction) were mapped to MG8 reference annotation using TopHat. Based on the resulting SAM or BAM file, Cufflinks assembled the alignment files independently of the reference annotation to possible transcripts and generates transcriptome assemblies for each condition. The assemblies of each condition and the MG8 reference annotation were used for merging by Cuffmerge, resulting in a final transcriptome assembly. Following this, TOPHAT-based BAM files and the final transcriptome assembly were used for isoform-based analysis with Cuffdiff. The R package was used for visualization.

Similar articles

References

    1. Dean R, et al. The Top 10 Fungal Pathogens in Molecular Plant Pathology. Mol. Plant Pathol. 2012;13:414–430. doi: 10.1111/j.1364-3703.2011.00783.x. - DOI - PMC - PubMed
    1. Ibrahim HMM, Kusch S, Didelon M, Raffaele S. Genome-Wide Alternative Splicing Profiling in the Fungal Plant Pathogen Sclerotinia Sclerotiorum during the Colonization of Diverse Host Families. Mol. Plant Pathol. 2021;22:31–47. doi: 10.1111/mpp.13006. - DOI - PMC - PubMed
    1. Yan, X., et al. The Transcriptional Landscape of Plant Infection by the Rice Blast Fungus Magnaporthe Oryzae Reveals Distinct Families of Temporally Co-Regulated and Structurally Conserved Effectors. Plant Cell. 10.1093/PLCELL/KOAD036 (2023). - PMC - PubMed
    1. Franceschetti M, et al. Fungal Virulence and Development Is Regulated by Alternative Pre-MRNA 3′End Processing in Magnaporthe Oryzae. PLOS Pathogens. 2011;7:e1002441. doi: 10.1371/journal.ppat.1002441. - DOI - PMC - PubMed
    1. Li Z, et al. Arginine Methylation Is Required for Remodelling Pre-MRNA Splicing and Induction of Autophagy in Rice Blast Fungus. New Phytologist. 2020;225:413–429. doi: 10.1111/nph.16156. - DOI - PubMed

Supplementary concepts