

The influence of left bundle branch block on myocardial T1 mapping
- PMID: 38438510
- PMCID: PMC10912434
- DOI: 10.1038/s41598-024-55821-z
The influence of left bundle branch block on myocardial T1 mapping
Abstract
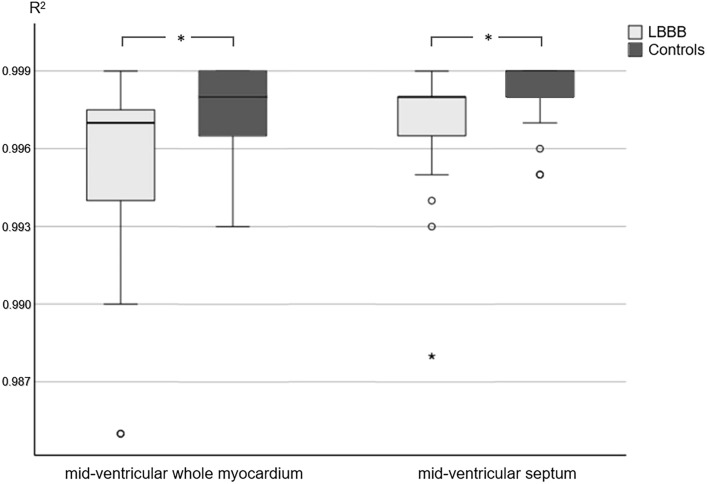
Tissue characterisation using T1 mapping has become an established magnetic resonance imaging (MRI) technique to detect myocardial diseases. This retrospective study aimed to determine the influence of left bundle branch block (LBBB) on T1 mapping at 1.5 T. Datasets of 36 patients with LBBB and 27 healthy controls with T1 mapping (Modified Look-Locker inversion-recovery (MOLLI), 5(3)3 sampling) were included. T1 relaxation times were determined on mid-cavity short-axis images. R2 maps were generated as a pixel-wise indicator for the goodness of the fit of T1 maps. R2 values were significantly lower in patients with LBBB than in healthy controls (whole myocardium/septum, 0.997, IQR, 0.00 vs. 0.998, IQR, 0.00; p = 0.008/0.998, IQR, 0.00 vs. 0.999, IQR, 0.00; p = 0.027). Manual correction of semi-automated evaluation tended to improve R2 values but not significantly. Strain analysis was performed and the systolic dyssynchrony index (SDIglobal) was calculated as a measure for left ventricular dyssynchrony. While MRI is generally prone to artefacts, lower goodness of the fit in LBBB may be mainly attributable to asynchronous contraction. Therefore, careful checking of the source data and, if necessary, manual post-processing is important. New techniques might improve the goodness of the fit of T1 mapping by reducing sampling in the motion prone diastole of LBBB patients.
© 2024. The Author(s).
Conflict of interest statement
The authors report no competing interests. Bernd Hamm reports grants not related to the current study from Abbott, Actelion Pharmaceuticals, Bayer Schering Pharma, Bayer Vital, BRACCO Group, Bristol-Myers Squibb, Charité Research Organisation GmbH, Deutsche Krebshilfe, Dt. Stiftung für Herzforschung, Essex Pharma, European Society of Radiology, Fibrex Medical Inc., Focused Ultrasound Surgery Foundation, Fraunhofer Gesellschaft, Guerbet, INC Research, InSightec Ltd., IPSEN Pharma, Kendle/MorphoSys AG, Lilly GmbH, Lundbeck GmbH, MeVis Medical Solutions AG, Nexus Oncology, Novartis, Parexel CRO Service, Perceptive, Pfizer GmbH, Philipps, sanofi-aventis S.A., Siemens, Spectranetics GmbH, Terumo Medical Corporation, TNS Healtcare GmbH, Toshiba, UCB Pharma, Wyneth Pharma, Zukunftsfonds Berlin (TSB).
Figures

Similar articles
-
Assessment of left ventricular mechanical dyssynchrony in left bundle branch block canine model: Comparison between cine and tagged MRI.J Magn Reson Imaging. 2016 Oct;44(4):956-63. doi: 10.1002/jmri.25225. Epub 2016 Mar 12. J Magn Reson Imaging. 2016. PMID: 26973138
-
T1 reactivity as an imaging biomarker in myocardial tissue characterization discriminating normal, ischemic and infarcted myocardium.Int J Cardiovasc Imaging. 2019 Jul;35(7):1319-1325. doi: 10.1007/s10554-019-01554-4. Epub 2019 May 15. Int J Cardiovasc Imaging. 2019. PMID: 31093894 Free PMC article.
-
Normal myocardial native T1 values in children using single-point saturation recovery and modified look-locker inversion recovery (MOLLI).J Magn Reson Imaging. 2020 Mar;51(3):897-903. doi: 10.1002/jmri.26910. Epub 2019 Sep 11. J Magn Reson Imaging. 2020. PMID: 31507010
-
Cardiac magnetic resonance imaging in patients with left bundle branch block: Patterns of dyssynchrony and implications for late gadolinium enhancement imaging.Front Cardiovasc Med. 2022 Oct 20;9:977414. doi: 10.3389/fcvm.2022.977414. eCollection 2022. Front Cardiovasc Med. 2022. PMID: 36337885 Free PMC article.
-
Left bundle branch block and echocardiography in the era of CRT.J Echocardiogr. 2015 Mar;13(1):6-14. doi: 10.1007/s12574-014-0233-1. Epub 2014 Nov 26. J Echocardiogr. 2015. PMID: 26184516 Review.
Cited by
-
Cardiac Conduction Disorders Due to Acquired or Genetic Causes in Young Adults: A Review of the Current Literature.J Am Heart Assoc. 2025 May 6;14(9):e040274. doi: 10.1161/JAHA.124.040274. Epub 2025 May 2. J Am Heart Assoc. 2025. PMID: 40314370 Free PMC article. Review.
References
MeSH terms
LinkOut - more resources
Full Text Sources
