. 2024 Mar;30(3):875-887.
doi: 10.1038/s41591-024-02807-z. Epub 2024 Mar 4.

Single-cell guided prenatal derivation of primary fetal epithelial organoids from human amniotic and tracheal fluids

Affiliations

Single-cell guided prenatal derivation of primary fetal epithelial organoids from human amniotic and tracheal fluids

Mattia Francesco Maria Gerli et al. Nat Med. 2024 Mar.

Erratum in

Abstract

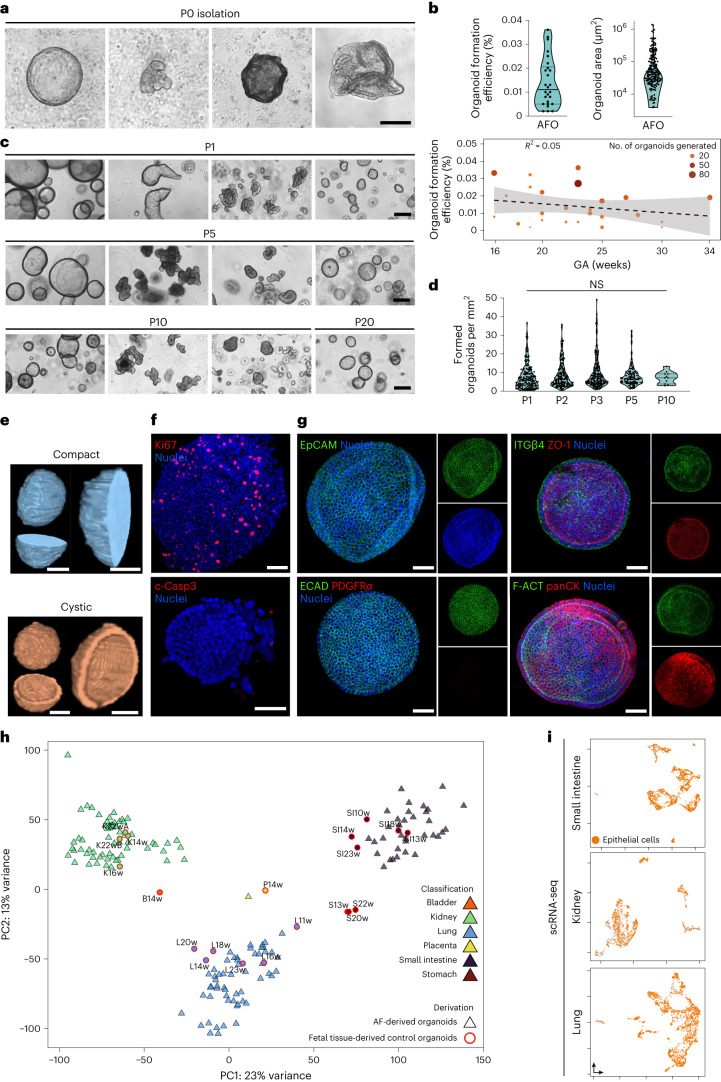
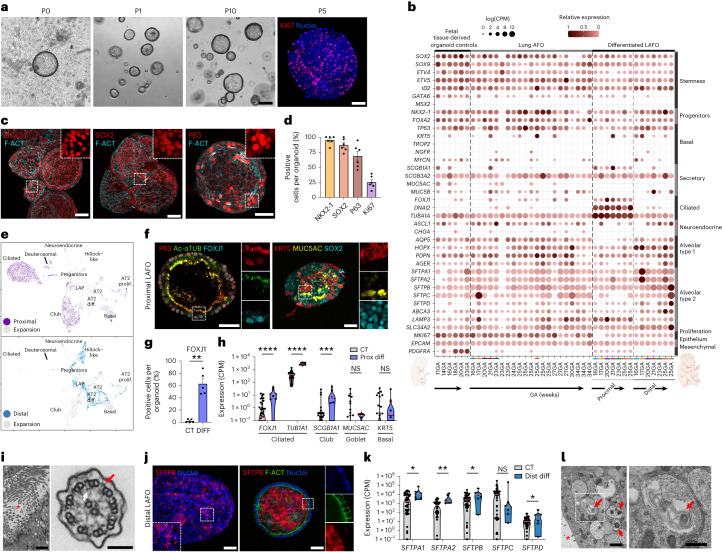
Isolation of tissue-specific fetal stem cells and derivation of primary organoids is limited to samples obtained from termination of pregnancies, hampering prenatal investigation of fetal development and congenital diseases. Therefore, new patient-specific in vitro models are needed. To this aim, isolation and expansion of fetal stem cells during pregnancy, without the need for tissue samples or reprogramming, would be advantageous. Amniotic fluid (AF) is a source of cells from multiple developing organs. Using single-cell analysis, we characterized the cellular identities present in human AF. We identified and isolated viable epithelial stem/progenitor cells of fetal gastrointestinal, renal and pulmonary origin. Upon culture, these cells formed clonal epithelial organoids, manifesting small intestine, kidney tubule and lung identity. AF organoids exhibit transcriptomic, protein expression and functional features of their tissue of origin. With relevance for prenatal disease modeling, we derived lung organoids from AF and tracheal fluid cells of congenital diaphragmatic hernia fetuses, recapitulating some features of the disease. AF organoids are derived in a timeline compatible with prenatal intervention, potentially allowing investigation of therapeutic tools and regenerative medicine strategies personalized to the fetus at clinically relevant developmental stages.


Conflict of interest statement

The views expressed are those of the authors and not necessarily those of the NHS, the NIHR or the Department of Health. The authors declare the following competing interests: a patent detailing the AFO technology was filed by UCL on 18 April 2023 entitled ‘Derivation of Primary Organoids from the Fetal Fluids’, under application no. GB2305703.7. M.F.M.G., G.G.G., P.D.C. and G.C. are listed as inventors on the patent. The other authors declare no competing interests.

Figures

Fig. 1
Fig. 1. Single-cell analysis of the AF content.
a, Top left: graphical representation of AF sampling. Bottom left: the FACS plot shows the sorting strategy utilized to collect the living cell fraction, negative for propidium iodide (PI) and positive for Hoechst. Middle: the UMAP shows the content of the AF of multiple patients obtained across the second and third trimesters of pregnancy (n = 12 biologically independent AF samples spanning 15–34 GA; 33,934 cells post-filtering examined over 11 sequencing lanes). Highlighted in orange is the epithelial cluster, as identified by the SingleR cell-labeling package using the human primary cell atlas dataset as reference. Right: the violin plots show the level of expression of the pan-epithelial specific genes EPCAM, CDH1(ECAD), KRT8, KRT10, KRT17 and KRT19 (mean ± s.d., data presented as normalized counts per million (CPM)). b, The UMAPs show the expression of a selection of epithelial markers, within the epithelial cluster identified in a. c, Representative flow cytometry analysis of EpCAM (n = 58,964 cells) and ECAD (CDH1, n = 38,389 cells) expression in live-sorted cells from the AF; gray represents unstained control (n = 34,045 cells). d, Re-calculated UMAP of the epithelial cluster identified in a, highlighting cells attributed to the three tissues through scGSEA. e, Scoring of the cells identified in d, for appropriate progenitor-associated genes. Cells with a positive score are highlighted on a re-calculated UMAP of that tissue’s cells. Scores also plotted as violin plots, identifying distinct populations of progenitor cells, threshold for positive scoring shown in red. Source data
Fig. 2
Fig. 2. Generation of primary fetal epithelial AFOs.
a, Phase-contrast images showing organoid formation from 3D cultured viable AF cells, with different organoid morphologies observed at day 14 (scale bar, 200 μm). b, Top: formation efficiency (organoids per live cells) and size (organoid area) of AFOs at isolation (passage (P) 0) (n = 26 independent AF samples for efficiency plot and n = 197 organoids for area plot; median and quartiles for both plots). Bottom: linear regression plot representing organoid formation efficiency (organoids per live cells) at various GAs. Color and size represent the total organoid number generated per sample; dashed line represents linear regression, R2 = 0.05 and s.e.m. is shown in gray. c, Phase-contrast images showing multiple clonal AFO morphologies in expansion, at P1, P5, P10 and up to P20 (scale bars, 200 μm). d, Formed organoids per mm2 at 7–15 d of culture quantified over ten passages (n ≥ 11 organoids from n = 19 independent AF samples; median and quartiles; NS, non-significant; one-way analysis of variance (ANOVA) with multiple comparison). e, X-ray PC-CT of two organoid phenotypes observed (compact and cystic). Scale bars, 25 μm. f, Immunofluorescent staining showing expression of the proliferative marker Ki67 and lack of cleaved caspase 3 apoptotic cells in AFOs at P3; nuclei counterstained with Hoechst (scale bars, 50 μm). g, Immunofluorescent staining showing AFO at P3 expressing the epithelial markers EpCAM, ECAD and pan-cytokeratin, while lacking expression of the mesenchymal marker PDGFRɑ. Immunofluorescent staining also shows AFO polarization, highlighted by the presence of the epithelial tight junction ZO-1 on the luminal surface and basolateral ITGβ4. Phalloidin counterstain highlights actin filaments (F-ACT) (scale bars, 50 μm). h, Unsupervised PCA plot showing AFOs (triangles) forming three main clusters (n = 121 organoid lines from n = 23 AF samples). These clusters show colocalization with primary fetal tissue-derived control organoids (circles, n = 20) produced from lung (cyan), small intestine (purple), kidney (green), placenta (yellow), bladder (orange) and stomach (red) samples. i, scRNA-seq UMAP produced from representative AFOs from the three tissue identities. Epithelial cells are highlighted in orange, as identified by the SingleR cell-labeling package; KAFOs (1,467 cells, n = 5 patients), LAFOs (1,966 cells, n = 4 patients) and SiAFOs (1,576 cells, n = 2 patients) are shown. Source data
Fig. 3
Fig. 3. Characterization and maturation of small intestine AFO.
a, Phase-contrast images depicting SiAFO expansion (scale bar, 200 μm). EdU assay showing proliferating cells localized at the crypt-like structure bases (scale bar, 50 μm). b, RNA-seq dot plot showing presence of small intestine markers in SiAFOs (n = 2 independent biological samples, n = 23 lines in expansion, n = 6 mature lines, n = 5 rings, n = 5 control fetal tissue-derived small intestinal organoids). c, Immunofluorescence for intestinal stem cell marker OLFM4, enterocyte marker KRT20 and ITGβ4. Paneth cells and enterocytes are highlighted by LYZ, FABP1 and ECAD staining (scale bars, 50 μm). d, Quantification of OLFM4, LYZ and EdU in SiAFOs (n = 2 independent biological samples; ≥4 organoids per sample; mean ± s.e.m.). e, Annotated scRNA-seq UMAP of representative SiAFOs in expansion (gray; 1,576 cells, n = 3 organoid lines) and maturation (orange; 1,666 cells, n = 3 organoid lines). f, Matured SiAFOs show budding morphology (scale bar, 200 μm). Immunofluorescent staining displays CHGA-positive enteroendocrine cells and MUC2-positive secretory cells. Counterstain with phalloidin (F-ACT) and Hoechst shows organoids’ lumen and nuclei, respectively (scale bars, 50 μm). g, Functional assessment of dipeptidyl peptidase IV activity (n = 2 independent biological samples; n = 5 clonal organoid lines at P6 and P10; n = 1 pediatric small intestinal ileal organoid control; mean ± s.e.m.). h, Functional evaluation of disaccharidase activity (n = 2 independent biological samples; n = 3 clonal organoid lines; n = 1 pediatric small intestinal ileal organoid control; mean ± s.e.m.). i,j, Schematic (created using BioRender) (i) and phase-contrast images (j, top) showing self-assembly and compaction of SiAFO ring (scale bars, 200 μm, 1 mm and 500 μm for insets; n = 8 rings from two AFs). Quantification of the ring’s relative perimeter over time (n = 4 independent experiments; mean ± s.e.m.; ***P = 0.002, ****P< 0.0001, one-way ANOVA multiple comparisons). MicroCT 3D reconstructions and cross-sections of a whole SiAFO ring depicting luminal structure (j, bottom) (scale bar, 50 μm). L, lumen. k, SiAFO rings display a lumen and KRT20-positive enterocytes, with ITGβ4 highlighting the basal side along with CHGA-positive enteroendocrine cells. The panel displays LYZ-positive cells, ZO-1-positive tight junctions, FABP1-positive enterocytes and MUC2 secretory cells in the SiAFO ring; proliferating Ki6-positive cells are observed in the crypt-like domain (*, external side) (scale bars, 50 μm). CT, control; PBS, phosphate-buffered saline. Source data
Fig. 4
Fig. 4. Characterization and differentiation of kidney tubule AFOs.
a, Phase-contrast images showing long-term KAFO culture (scale bar, 200 μm). Immunofluorescent staining highlights proliferative marker Ki67 (scale bar, 50 μm). b, Bulk RNA-seq showing broad kidney markers’ presence in KAFOs (n = 19 independent biological samples, n = 37 lines in expansion, n = 7 lines in differentiation medium, n = 4 control FKOs). CD, collecting duct; DT, distal tubule; LoH, loop of Henle. c, Immunofluorescent staining shows presence of nephron progenitor markers PAX8 and LHX1 counterstained with phalloidin (F-ACT) and positivity for distal tubule/collecting duct marker GATA3, proximal tubule marker LTL, ECAD and Ac-αTUB apical cilia, further confirming the renal epithelial identity of KAFOs (scale bars, 50 μm). d, Quantification of renal markers PAX8, LHX1, and GATA3 in KAFOs (n = 6 independent biological samples, ≥4 organoids per sample; mean ± s.e.m.). e, Potassium ion channel assay performed on n = 7 KAFOs from independent biological samples, n = 3 FKOs, n = 3 FLOs as negative control (mean fluorescence intensity (MFI) was calculated; mean ± s.e.m., one-way ANOVA with multiple comparisons; *P = 0.0393). f, Images showing inulin assay results from untreated and EDTA-treated KAFOs (scale bars, 50 μm); percentage quantification of organoids with intact barrier integrity (no inulin-FITC uptake; n = 5 independent biological samples; mean ± s.e.m.; *P = 0.0121, two-tailed paired t-test). g, Annotated KAFO scRNA-seq UMAP in expansion (gray; 1,467 cells, n = 6 KAFO lines) and differentiation (orange; 3,559 cells, n = 3 KAFO lines). NPC, nephron progenitor cells. h, Immunofluorescent staining showing RET protein localization in RET+ and RET KAFOs (scale bars, 50 μm). i, Stacked bar chart representing proportion of organoids with compact, cystic, or mixed (compact/cystic) morphology in RET+ and RET KAFOs (*P = 0.0255, Spearman rank test). j, Phase-contrast and immunofluorescent (IF) images highlighting morphological changes, as well as the expression of the mature renal markers AQP2, SLC12A1 and CALB1 in KAFOs upon differentiation (scale bars, 200 μm phase-contrast and 50 μm IF). k, Left: quantification of CALB1-positive cells in KAFOs cultured in expansion (CT) and differentiation (DIFF) medium (n = 4 independent biological samples, mean ± s.e.m.; *P = 0.0357, two-tailed paired t-test). Right: CALB1 gene expression in differentiated KAFOs (DIFF) compared to undifferentiated controls (CT) based on the RNA-seq plot presented in b (n ≥ 6 differentiated independent biological samples; mean ± s.e.m.; **P = 0.0029, unpaired t-test). Source data
Fig. 5
Fig. 5. Characterization and differentiation of lung AFOs.
a, Phase-contrast images depicting LAFO expansion (scale bar, 200 μm). IF staining highlights proliferative marker Ki67 (scale bar, 50 μm). b, Dot plot showing representative bulk RNA-seq gene expression in LAFOs (n = 12 independent biological samples, n = 21 undifferentiated LAFOs, n = 14 differentiated LAFOs, n = 6 control FLOs). c, IF staining highlighting the presence in LAFOs of lung stem/progenitor cell markers NKX2-1 and SOX2 together with P63 basal cells; counterstaining with phalloidin (F-ACT) (scale bars, 50 μm). d, IF quantification (n = 6 AF samples, ≥4 organoids per sample; mean ± s.e.m.). e, Annotated scRNA-seq UMAPs of LAFOs in expansion (gray; 1,966 cells, n = 4 organoid lines), proximal (top; 3,371 cells, n = 3 organoid lines) and distal differentiation (bottom; 1,351 cells, n = 3 organoid lines). f, IF staining on proximally differentiated LAFOs reveals polarized expression of ciliary protein Ac-αTUB, and ciliated cell marker FOXJ1. The panel also shows expression of basal cell markers P63, KRT5, presence of mucin 5AC goblet cells and maintenance of SOX2 progenitor cells (scale bars, 50 μm). g, Quantification of FOXJ1-positive cells within LAFOs in expansion (CT) versus proximal differentiation (DIFF) (n = 5 independent biological samples, ≥4 organoids per sample; mean ± s.e.m.; **P = 0.0016, two-tailed paired t-test). h, Violin plot showing gene expression of proximal airway markers FOXJ1, TUBA1A, SCGB1A1, MUC5AC and KRT5 in proximal LAFOs (DIFF) compared to undifferentiated controls (CT) based on the RNA-seq plot presented in b (n ≥ 7 independent biological samples; median and quartiles; SCGB1A1 ***P = 0.0003, ****P < 0.0001, Holm–Šídák multiple unpaired t-test). i, TEM images showing proximal LAFOs with cilia inside the lumen (asterisk) (scale bar, 2 μm); in cross-section, axonemes showing outer (red arrow) and inner (white arrow) dynein arms (scale bar, 100 nm). j, Distalized LAFOs showing surfactant-secreting cells (SFTPB) with granular and luminal secretion; Hoechst-counterstained nuclei (scale bars, 50 μm). k, Violin plot showing surfactant-related gene expression in distalized LAFOs (DIST DIFF) compared to control in expansion (CT) based on the RNA-seq plot presented in b (n ≥ 7 independent biological samples; median and quartiles; NS, non-significant; SFTPA1 *P = 0.0107, SFTPA2 **P = 0.0002, SFTPB *P = 0.0168, SFTPD *P = 0.0028, Holm–Šídák multiple unpaired t-test). l, Left: TEM of distalized LAFOs showing lumen (*) and cells containing lamellar bodies (red arrows). Right: magnification of lamellar body containing multi-lamellar membranes. Scale bars, 1 μm and 500 nm, respectively. Source data
Fig. 6
Fig. 6. Generation, differentiation and characterization of LAFOs and LTFOs from CDH pregnancies.
a, Schematic of AF/TF sampling from CDH pregnancies. b,c, Phase-contrast images depicting CDH LAFOs (b) and LTFOs (c) P0–P10 (scale bars, 200 μm). IF staining panel highlights proliferative marker Ki67, lung stem/progenitor markers NKX2-1/SOX2 and basal cell marker P63 in CDH organoids (scale bars, 50 μm); nuclei counterstained with Hoechst. d, Organoid formation efficiency (organoids per live cells, n = 16 CDH AF and n = 7 CDH TF independent samples; median and quartiles) and area of CDH AFOs versus CDH TFOs at isolation (n ≥ 91 organoids; median and quartiles; *P = 0.00482, unpaired t-test). Bar graph displays CDH LAFO/LTFO morphologies versus controls (cystic, compact, mixed; n ≥ 3 independent biological samples; median and quartiles; NS, non-significant; *P = 0.0477, two-way ANOVA with multiple comparisons). e, Immunofluorescent staining quantification (n = 7 CT AF, n = 4 CDH AF, n = 4 CDH TF independent samples, ≥4 organoids per sample; mean ± s.e.m.; NS, non-significant; **P = 0.0076, ****P < 0.0001, two-way ANOVA with multiple comparisons). f, IF staining showing SOX9 in CDH LAFOs/LTFOs (scale bars, 50 μm). g, Dot plot of lung-related markers in CDH TFOs (29–34 GA, four patients) and AFOs (28–34 GA, eight patients) alongside GA-matched control LAFOs (27–34 GA, three patients). h, Violin plots showing SOX9 expression before and after FETO in CDH LAFOs/LTFOs compared to GA-matched control LAFOs (median and quartiles). i, Volcano plots showing DEGs between CDH organoids and GA-matched controls before and after FETO. Significant (P < 0.01) lung-associated markers are labeled. The blue dots represent the statistically significant downregulated genes, and the red dots represent the statistically significant upregulated genes. LFC, log fold change. j, Immunofluorescent staining showing pro-surfactant protein C (proSFTPC) in CDH organoids before (left) and after (right) FETO (scale bars, 50 μm). k, TEM image shows proximal CDH LAFOs exhibiting cilia (*), confirmed with IF staining for Ac-αTUB and ciliary transcription factor FOXJ1; nuclei counterstained with Hoechst (scale bars, 500 nm TEM, 50 μm IF). FOXJ1 quantification is presented in the bar graph (n = 5 CDH and n = 5 CT independent biological samples, mean ± s.e.m. *P = 0.0318 two-tailed unpaired t-test). l, Quantification of CBF (Hz; n ≥ 5 videos per organoid line, n = 5 CDH organoid lines, n = 4 non-CDH control LAFO lines; median and quartiles; NS, non-significant, two-tailed unpaired t-test). m, TEM imaging showing presence of lamellar bodies (arrows) in distalized CDH organoids (scale bar, 1 μm). IF staining shows surfactant protein B (SFTPB) in distalized CDH LAFOs/LTFOs; nuclei counterstained with Hoechst (scale bars, 50 μm). n, Annotated scRNA-seq UMAPs of CDH LAFOs/LTFOs in expansion (left; 1,877 cells, n = 6 organoid lines), proximal (middle left; 3,843 cells, n = 5 organoid lines) and distal differentiation (middle right; 6,090 cells, n = 5 organoid lines). Stacked bar plot of cell types between organoid identities (%) is shown (right). Source data
Extended Data Fig. 1
Extended Data Fig. 1. AF single-cell RNA Sequencing.
(a) Schematic and phase-contrast image of fresh AF sample at collection (left). FACS plot showing heterogeneity of AF cells by forward and side scatter after sorting (right). (b) scRNA-seq UMAP analysis of n=12 AF samples; middle UMAP shows cell distribution across second and third trimester; right panel shows cells labeled by post-conception weeks (PCW). (c) UMAPs depicting expression of epithelial keratins within the AF epithelial cell cluster. (d) Upregulated GO pathways in the epithelial-labeled cluster of the scRNA-seq AF from DEGs calculated when compared to all other clusters (one-sided Fisher test, adjusted using Benjamini-Hochberg for multiple hypotheses). (e) Schematic showing the comparison between the gestational age weeks covered by reference fetal scRNA-seq atlases, highlighting the lack of late-stage development data. Source data
Extended Data Fig. 2
Extended Data Fig. 2. Derivation and characterization of AFO.
(a) Schematic depicting the workflow for clonal AFO derivation. Image created and adapted in full licensed Biorender. (b) Phase-contrast images showing growth of clonal AFO from sorted AF epithelial cells cultured at a ratio of 5 cells in 3μL Matrigel droplet. (c) Percentage of samples that generated organoids at passage 0 (n=26/29 AF, n=16/20 CDH AF, n=7/17 TF samples, mean and 95% confidence interval [AF, 72.65, 97.81; CDH AF, 56.34, 94.27; TF, 18.44, 67.08]). (d) Phase-contrast images showing the recovery of AFO at passage 4 after cryopreservation and their expansion until passage 8 (Scale bar: 200 μm). (e) Phase-contrast images depicting two additional AFO lines from independent patients (scale bar: 200 μm). (f) PCA shows all sequenced AFO with the excluded unknown sample (top); PCA showing each organoid as its gestational age (bottom). (g) Top10 pathways from gene ontology analysis comparing each AFO identity to the other 2 AFO identities, (one-sided Fisher test, adjusted using Benjamini-Hochberg for multiple hypotheses). (h) Euclidean-clustered heatmap confirming the tissue-typing labeling of the AFO. Source data
Extended Data Fig. 3
Extended Data Fig. 3. Characterization of SiAFO.
(a) Phase-contrast images showing SiAFOs at passage 6 and their expansion after cryopreservation until passage 10 (scale bar: 200 μm). (b) Whole-mount immunofluorescent staining showing the absence of NKX2-1 (lung) and PAX8 (kidney) in SiAFO (scale bar: 50 μm). (c) Whole-mount immunofluorescent staining for Chromogranin A (CHGA) and Mucin 2 (MUC2) on SiAFOs in expansion medium (scale bar: 50 μm). (d) RT–qPCR analysis of SiAFOs cultured in maturation medium without (Basal), with CHIR99021 (CHIR) or with DAPT (n=5 SiAFO clonal lines from n=2 patients; mean±SEM). (e) Stereoscopic image of an intestinal ring (scale bar: 1 mm) and microCT images showing the presence of budding (left) as well as luminal-like structures (L) (scale bars: 100 μm). (f) 3D z-stacks of SiAFO rings showing tight junctions (ZO-1), Paneth cells (LYZ), enterocytes (FABP1 and KRT20), intestinal secretory cells (MUC2) and enteroendocrine cells (CHGA); nuclei counterstained with Hoechst (scale bars:50μm). Source data
Extended Data Fig. 4
Extended Data Fig. 4. Characterization of KAFO.
(a) Phase-contrast images showing the thawing of KAFOs after cryopreservation at passage 7 and their expansion until passage 10 (scale bar: 200 μm). (b) Full set of KAFOs subjected to bulk RNA-seq. (c) Double positive GATA3 and LTL cells confirm a mixed tubular phenotype; in the left panel a different phenotype of KAFOs was observed with GATA3 positive and LTL negative cells (scale bar: 50 μm). (d) Immunofluorescence showing presence of ZO-1-positive tight junctions in KAFOs (scale bar: 50 μm). (e) Representative example of inulin-permeability assay (scale bar: 50 μm). (f) Localization of RET protein signal in fetal kidney tissue slice and tissue-derived fetal kidney organoids (FKO; scale bar: 50 μm). (g) Distal and collecting duct markers are absent or poorly present in KAFOs in expansion medium; differentiation induces expression of CALB1, SLC12A1 and AQP2 (n=4 independent biological samples); nuclei counterstained with Hoechst (scale bar: 50 μm).
Extended Data Fig. 5
Extended Data Fig. 5. Characterization of LAFO.
(a) Phase-contrast images showing LAFOs after cryopreservation expanded to passage 21 (Scale bar: 200 μm). (b) Different LAFO lines’ morphological phenotypes (scale bars: 200 μm), quantified in (c) (n=10 AF samples; mean with 95% CI, ***P<0.001, one-way ANOVA with multiple comparisons). (d) Full set of sequenced LAFOs. (e) LAFOs show absence of surfactant protein C in expansion (Scale bar: 50 μm). (f) Airway markers (FOXJ1, ACATUB, MUC5AC, KRT5) are absent or poorly expressed at protein level in LAFOs cultured in expansion medium, but present in proximally differentiated LAFOs (n=5 independent biological samples, mean±SEM, ns=non-significant, two-tailed paired t-test) (Scale bar: 50 μm). (g) TEM showing normal cilia rootlets with associated mitochondria (green arrow); longitudinal section of the axonemes confirms a normal central microtubule pair (yellow arrow) and radial spokes (red arrow) (scale bars: 100 nm). (h) Distalised LAFOs produce surfactant protein B vs. control in expansion; nuclei counterstained with Hoechst (scale bars: 50 μm). Source data
Extended Data Fig. 6
Extended Data Fig. 6. Derivation and characterization of CDH organoids.
(a) Comparison of organoid formation efficiency between non-CDH and CDH fluids at P0 (n=26 non-CDH AFs; n=16 CDH AFs; n=7 CDH TFs; median and quartiles). (b) Organoid formation efficiencies at various gestational age for CDH AF and TF. (c) PCA showing CDH organoids alongside all the AFO clusters. (d) Representative CDH organoid lines stained for SOX9 (scale bars: 50 μm). (e) Derivation of CDH AFO and TFO from different patients before (left) and after (right) FETO surgery (scale bar: 200 μm). (f) Heatmap showing comparison of lung surfactant genes expression between CDH organoids before and after FETO. (g) GO analysis of CDH LAFO and LTFO before and after FETO, when compared to GA-matched control LAFOs; red arrows highlight surfactant and matrix remodeling pathways. (h) Phase-contrast image of Proximal CDH LAFOs showing cilia and mucus/debris within the lumen. Immunofluorescence image showing Proximal CDH LAFOs expressing SOX2 (scale bars: 50 μm). (i) Ciliary beating frequency analysis of CDH organoids (n=49 organoids from 5 lines of 3 independent patients) vs CT LAFOs (n=40 organoids from 4 lines of 4 independent patients; **P=0.0014 unpaired t-test). Source data
Extended Data Fig. 7
Extended Data Fig. 7. Dot plot showing expression of lung genes in CDH LAFO/LTFO.
Expression of a selection of lung genes associated with different lung cell types (log CPM). Relative expression within each gene is shown by color. All CDH organoids generated, LAFO and LTFO are shown, separated by before and after FETO. Proximal and Distal differentiated CDH organoids also shown, with colored bars used to pair differentiated organoid with the matching undifferentiated organoid line. They are shown alongside GA-matched LAFO controls and tissue-derived fetal organoid controls (not age-matched).
Extended Data Fig. 8
Extended Data Fig. 8. Additional CDH organoid gene expression analyses.
(a) Volcano plots showing significant DEGs (p<0.05, |LFC| > 2). Lung-relevant genes are highlighted. Comparison of organoids generated from AF or TF sampled after FETO with those before FETO. (b) Comparison of LAFO and LTFO from before and after FETO with GA-matched control LAFOs. (c) Comparison of CT LAFO between samples GA-matched to before and after FETO (d) Comparison of LAFO with LTFO, before and after FETO. (e) DEG gene list generated from comparing CDH LAFO to controls, before and after FETO.

Similar articles

Cited by

References

    1. Davidson, J. R. et al. Fetal body MRI and its application to fetal and neonatal treatment: an illustrative review. Lancet Child Adolesc. Health5, 447–458 (2021). - PMC - PubMed
    1. Lord, J. et al. Prenatal exome sequencing analysis in fetal structural anomalies detected by ultrasonography (PAGE): a cohort study. Lancet393, 747–757 (2019). - PMC - PubMed
    1. Deprest, J. A. et al. Randomized trial of fetal surgery for moderate left diaphragmatic hernia. N. Engl. J. Med.385, 119–129 (2021). - PMC - PubMed
    1. Deprest, J. A. et al. Randomized trial of fetal surgery for severe left diaphragmatic hernia. N. Engl. J. Med.385, 107–118 (2021). - PMC - PubMed
    1. Senat, M.-V. et al. Endoscopic laser surgery versus serial amnioreduction for severe twin-to-twin transfusion syndrome. N. Engl. J. Med.351, 136–144 (2004). - PubMed