. 2024 Mar;4(3):237-250.
doi: 10.1038/s43588-024-00597-5. Epub 2024 Mar 4.

Population-level comparisons of gene regulatory networks modeled on high-throughput single-cell transcriptomics data

Affiliations

Population-level comparisons of gene regulatory networks modeled on high-throughput single-cell transcriptomics data

Daniel Osorio et al. Nat Comput Sci. 2024 Mar.

Abstract

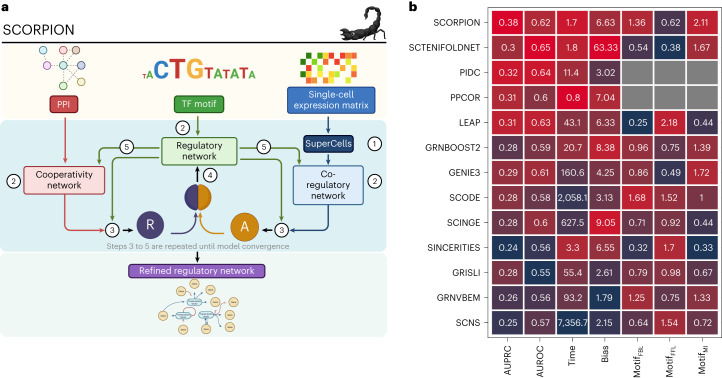
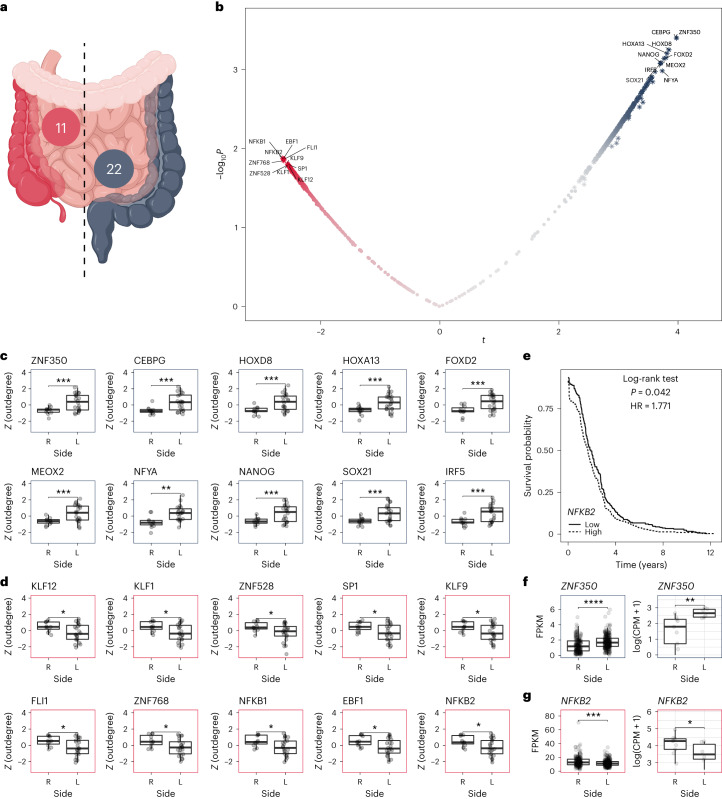
Single-cell technologies enable high-resolution studies of phenotype-defining molecular mechanisms. However, data sparsity and cellular heterogeneity make modeling biological variability across single-cell samples difficult. Here we present SCORPION, a tool that uses a message-passing algorithm to reconstruct comparable gene regulatory networks from single-cell/nuclei RNA-sequencing data that are suitable for population-level comparisons by leveraging the same baseline priors. Using synthetic data, we found that SCORPION outperformed 12 existing gene regulatory network reconstruction techniques. Using supervised experiments, we show that SCORPION can accurately identify differences in regulatory networks between wild-type and transcription factor-perturbed cells. We demonstrate SCORPION's scalability to population-level analyses using a single-cell RNA-sequencing atlas containing 200,436 cells from colorectal cancer and adjacent healthy tissues. The differences between tumor regions detected by SCORPION are consistent across multiple cohorts as well as with our understanding of disease progression, and elucidate phenotypic regulators that may impact patient survival.


Conflict of interest statement

D.O. is currently an employee of QIAGEN Digital Insights, QIAGEN, USA. The other authors declare no competing interests.

Figures

Fig. 1
Fig. 1. Overview and benchmarking of desparsification with SCORPION.
a, SCORPION uses the PANDA message-passing algorithm to integrate data from multiple sources, including protein–protein interactions (PPI), single-cell gene expression and sequence motif data, to predict accurate regulatory relationships. In five iterative steps, SCORPION generates comparable, fully connected, weighted and directed transcriptome-wide gene regulatory networks from single-cell transcriptomic data suitable for use in population-level studies. TF, transcription factor. b, The performance of 13 single-cell gene regulatory network construction methods was evaluated using BEELINE and the same curated synthetic dataset. Methods are ranked based on their average performance across seven different metrics. If the metric was not quantifiable, gray squares are shown. The performance in each metric is color-coded from red (best) to blue (worst). Algorithms were ranked based on their average performance across seven different metrics: AUROC, AUPRC, computing time, level bias due to expression level, feedback loops (FBL; where some portion (or all) of a regulatory response is used as input for future gene regulation), feed-forward loop (FFL; a three-gene pattern composed of two input transcription factors, one of which regulates the other, both of which jointly regulate a target gene) and mutual iterations (MI; equally weighted interactions between regulator–target and vice versa) motif structures identification. AUROC and AUPRC are described in Methods. The absolute value of the correlation between the average gene expression for each gene and its corresponding degree in the network was used to calculate the level bias due to expression level. Source data
Fig. 2
Fig. 2. Evaluation of SCORPION’s ability to detect changes in transcription factor activity and their impact on target genes.
a, Differences in the distribution of the edge weights for the Hnf4α transcription factor in Hnf4αγWT and Hnf4αγDKO mouse intestinal epithelium cells. b, Distribution of the paired weight differences between the edges of the Hnf4α transcription factor (μ^ and P were calculated using a one-sample two-sided t-test). c, Spearman correlation (ρ^) of the edge weights for the Hnf4α transcription factor in Hnf4αγWT and Hnf4αγDKO mouse intestinal epithelium cells. Genes outside the 95% confidence interval are color-coded and labeled (in red if upregulated and in blue if downregulated). d, GSEA of enterocyte marker genes using the paired differences between the edge weights of the Hnf4α transcription factor (NES and Padj were computed using the GSEA test). e, Differences in the distribution of the edge weights for the Hnf4γ transcription factor in Hnf4αγWT and Hnf4αγDKO mouse intestinal epithelium cells. f, Distribution of the paired weight differences between the edges of the Hnf4γ transcription factor (μ^ and P were calculated using a one-sample two-sided t-test). g, Spearman correlation (ρ^) of the edge weights for the Hnf4γ transcription factor in Hnf4αγWT and Hnf4αγDKO mouse intestinal epithelium cells. Genes outside the 95% confidence interval are color-coded and labeled (in red if upregulated and in blue if downregulated). h, GSEA of the enterocyte marker genes using the paired differences between the edge weights of the Hnf4γ transcription factor (NES and Padj were computed using the GSEA test). i, UMAP of human ESCs. 8-cell-like cells are highlighted. j, Differences in the distribution of the edge weights for the DUX4 transcription factor in DUX4WT and DUX4OE human ESCs. k, Distribution of the paired weight differences between the edges of the DUX4 transcription factor (μ^ and P were calculated using a one-sample two-sided t-test). l, Spearman correlation (ρ^) of the edge weights for the DUX4 transcription factor in DUX4WT and DUX4OE human ESCs. Genes outside the 95% confidence interval are color-coded and labeled (in red if upregulated and in blue if downregulated). m, GSEA of the 8-C-like cell marker genes using the paired differences between the edge weights of the DUX4 transcription factor (NES and Padj were computed using the GSEA test). Source data
Fig. 3
Fig. 3. Low-dimensional representation of transcriptomes and gene regulatory networks from colorectal cancer and adjacent healthy tissue.
a, UMAP of cells from healthy adjacent tissue. b, UMAP of cells from tumor border tissue. c, UMAP of cells from tumor core tissue. d, UMAP of cells from liver metastatic tissue. e, t-SNE of gene regulatory networks from colorectal cancer and adjacent healthy tissue generated by SCORPION. MSC, mesenchymal stem cell. Source data
Fig. 4
Fig. 4. Differential network analysis of epithelial cells during colorectal cancer progression.
N, adjacent normal tissues, B, border of the tumor, C, core of the tumor, M, liver metastases. We analyzed n = 149 biologically independent samples, with sample sizes for each condition as follows: N = 42, B = 9, C = 94, M = 4. In the boxplots, the line within the box represents the median. The box itself extends from the median ± 1.5 times the interquartile range (IQR). Whiskers indicate the 5th and 95th percentiles, and individual sample values are represented as dots. a, Examples of significant interactions between transcription factors and target genes linearly increasing or decreasing during colorectal cancer progression (β coefficient computed using ordinary least squares). b, Ranked list of transcription factors based on the transcription factor activity in the gene regulatory networks illustrating the progression of colorectal cancer. c, Significantly upregulated hallmarks found in the gene regulatory network illustrating the progression of colorectal cancer, ranked by NES (NES and Padj were computed using the GSEA test). d, Downregulated hallmarks found in the gene regulatory networks illustrating the progression of colorectal cancer, ranked by NES (NES and Padj were computed using the GSEA test). Source data
Fig. 5
Fig. 5. Gene regulatory network illustrating the progression of colorectal cancer.
Transcription factors with the highest activities up- or downregulated are shown in bold letters. The graph’s edges are color-coded in red for upregulated and blue for downregulated interactions. Arrows represent the directionality of the regulatory mechanism. Source data
Fig. 6
Fig. 6. Regulatory differences between right-sided and left-sided colorectal cancer epithelial cells.
a, Diagram illustrating the left and right sides of the intestines, with the respective number of samples for each group. b, Volcano plot showing differences in transcription factor activity between right-sided and left-sided colorectal cancer epithelial cells. c, Top 10 most active transcription factors identified in epithelial cells from left-sided colorectal cancer based on n = 33 biologically independent samples. The dataset includes 22 samples from the left side (L) and 11 from the right side (R). d, Top 10 most active transcription factors identified in epithelial cells from right-sided colorectal cancer based on n = 33 biologically independent samples. The dataset includes 22 samples from the left side (L) and 11 from the right side (R). e, Differences in patient survival rates based on NFKB2 expression in patients with primary colorectal cancer. f, Consistent differences in gene expression for the ZND350 transcription factor in the TCGA data and our own dataset. g, Consistent differences in gene expression for the NFKB2 transcription factor in two independent patient cohorts. Expression levels are reported in fragments per kilobase of transcript per million mapped reads (FPKM) and counts per million (CPM), respectively. In the boxplots, the line within the box represents the median, and the box extends from the median ± 1.5 times the IQR. Whiskers indicate the 5th and 95th percentiles, and individual sample values are represented as dots. P values were calculated using a two-sided t-test: *P ≤ 0.05, **P ≤ 0.01, ***P ≤ 0.001, ****P ≤ 0.0001. Source data

References

    1. Levine M, Tjian R. Transcription regulation and animal diversity. Nature. 2003;424:147–151. doi: 10.1038/nature01763. - DOI - PubMed
    1. Barrera LO, Ren B. The transcriptional regulatory code of eukaryotic cells–insights from genome-wide analysis of chromatin organization and transcription factor binding. Curr. Opin. Cell Biol. 2006;18:291–298. doi: 10.1016/j.ceb.2006.04.002. - DOI - PubMed
    1. Marbach D, et al. Tissue-specific regulatory circuits reveal variable modular perturbations across complex diseases. Nat. Methods. 2016;13:366–370. doi: 10.1038/nmeth.3799. - DOI - PMC - PubMed
    1. Babu MM, Luscombe NM, Aravind L, Gerstein M, Teichmann SA. Structure and evolution of transcriptional regulatory networks. Curr. Opin. Struct. Biol. 2004;14:283–291. doi: 10.1016/j.sbi.2004.05.004. - DOI - PubMed
    1. Osorio D, Zhong Y, Li G, Huang JZ, Cai JJ. scTenifoldNet: a machine learning workflow for constructing and comparing transcriptome-wide gene regulatory networks from single-cell data. Patterns. 2020;1:100139. doi: 10.1016/j.patter.2020.100139. - DOI - PMC - PubMed