. 2024 Jun;271(6):3186-3202.
doi: 10.1007/s00415-024-12191-w. Epub 2024 Mar 5.

Quantitative whole-body muscle MRI in idiopathic inflammatory myopathies including polymyositis with mitochondrial pathology: indications for a disease spectrum

Affiliations

Quantitative whole-body muscle MRI in idiopathic inflammatory myopathies including polymyositis with mitochondrial pathology: indications for a disease spectrum

Lea-Katharina Zierer et al. J Neurol. 2024 Jun.

Abstract

Objective: Inflammatory myopathies (IIM) include dermatomyositis (DM), sporadic inclusion body myositis (sIBM), immune-mediated necrotizing myopathy (IMNM), and overlap myositis (OLM)/antisynthetase syndrome (ASyS). There is also a rare variant termed polymyositis with mitochondrial pathology (PM-Mito), which is considered a sIBM precursor. There is no information regarding muscle MRI for this rare entity. The aim of this study was to compare MRI findings in IIM, including PM-Mito.

Methods: This retrospective analysis included 41 patients (7 PM-Mito, 11 sIBM, 11 PM/ASyS/OLM, 12 IMNM) and 20 healthy controls. Pattern of muscle involvement was assessed by semiquantitative evaluation, while Dixon method was used to quantify muscular fat fraction.

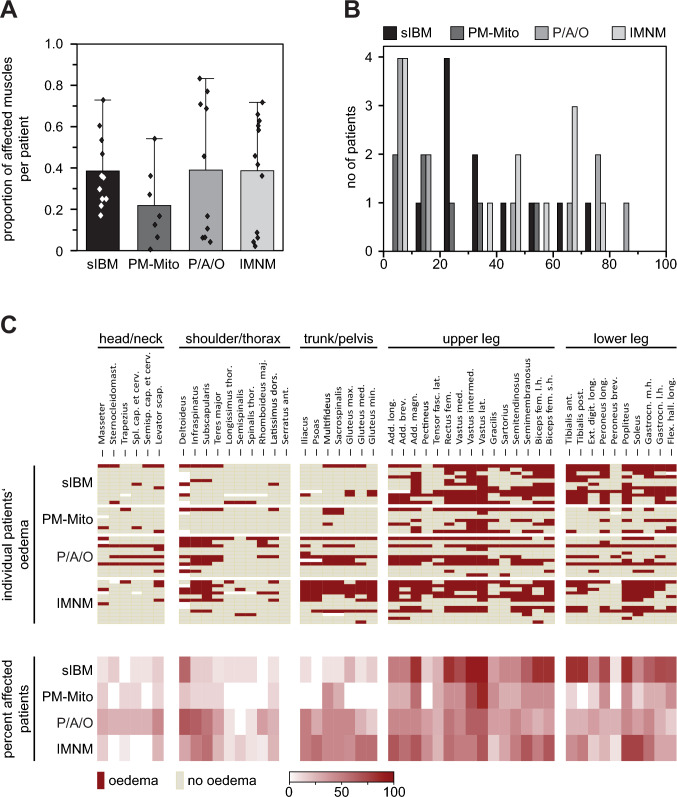
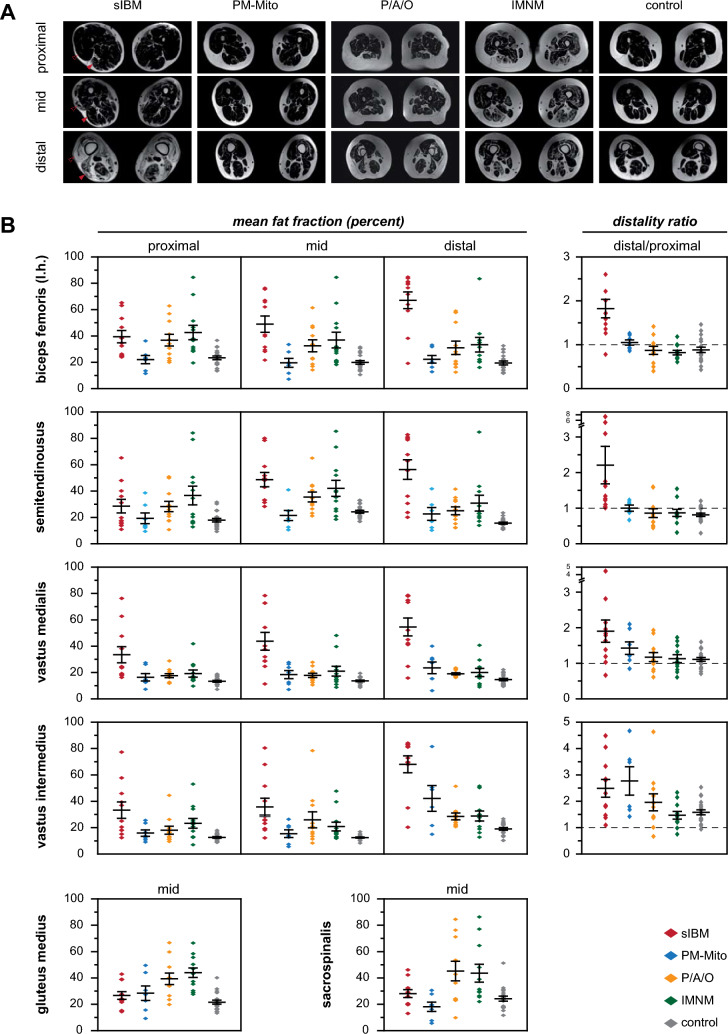
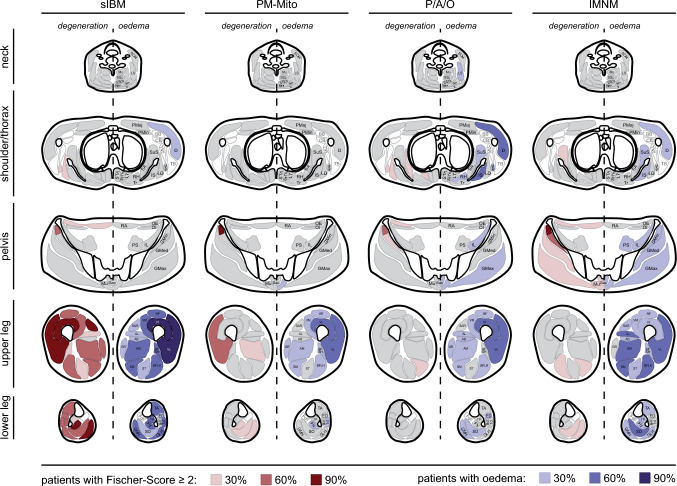
Results: The sIBM typical pattern affecting the lower extremities was not found in the majority of PM-Mito-patients. Intramuscular edema in sIBM and PM-Mito was limited to the lower extremities, whereas IMNM and PM/ASyS/OLM showed additional edema in the trunk. Quantitative assessment showed increased fat content in sIBM, with an intramuscular proximo-distal gradient. Similar changes were also found in a few PM-Mito- and PM/ASyS/OLM patients. In sIBM and PM-Mito, mean fat fraction of several muscles correlated with clinical involvement.

Interpretation: As MRI findings in patients with PM-Mito relevantly differed from sIBM, the attribution of PM-Mito as sIBM precursor should be critically discussed. Some patients in PM/ASyS/OLM and PM-Mito group showed MR-morphologic features predominantly observed in sIBM, indicative of a spectrum from PM/ASyS/OLM toward sIBM. In some IIM subtypes, MRI may serve as a biomarker of disease severity.

Keywords: IBM; Imaging biomarker; Inclusion body myositis; Myositis; PM-Mito; qMRI.


Conflict of interest statement

The authors report no conflicts of interest.

Figures

Fig. 1
Fig. 1
Semiquantitative evaluation of muscular degeneration in IIM. A Proportion of affected muscles per patient. Affection was defined as Fischer grade ≥ 2. Bars represent the average fraction of affected muscles, whiskers show one standard deviation, and dots account for the individual patient. Patients with sIBM show a significantly higher affection compared to PM-Mito and PM/ASyS/OLM (P/A/O). Note the high variability in IMNM. B Average Fischer score per patient. Bars represent the average Fischer grade calculated from all muscles, whiskers show one standard deviation, and dots account for the individual patient. Again, a higher average Fischer grade is seen in sIBM, while the IMNM group shows a high variability. C Individual and pooled results of the Fischer grades for all studied muscles. Heat map on the left shows the individual Fischer grades for each patient, stratified by subgroup. Heat maps on the right represent statistical indicators derived from each subgroup. A predominant lower limb involvement is seen in sIBM. There is no specific pattern in PM-Mito patients, while PM/ASyS/OLM and IMNM tend to affect proximal muscle groups (trunk/thorax). Note the consistent affection of the ventral parts of gluteus minimus in all groups (including control), suggestive of non-specificity. Sternocleidomast. Sternocleidomastoideus, Spl. Splenius, cap. capitis, cerv. cervicis, Semisp. Semispinalis, scap. scapulae, maj. major, min. minor, thor. thoracis, dors. dorsi/dorsal, ant. anterior, abd. abdominis, int. internus, ext. externus, max. maximus, med. medius/medialis, min. minimus, vent. ventral, Add. Adductor, long. longus/longum, brev. brevis, magn. magnus, fasc. lat. fasciae latae, fem. femoris, intermed. intermedius, lat. lateralis, l.h. long head, s.h. short head, post. posterior, Ext. digit. Extensor digitorum, Gastrocn. Gastrocnemius, m.h. medial head, l.h. lateral head, Flex. hall. Flexor hallucis longus
Fig. 2
Fig. 2
Distribution and severity of edema in IIM. A Proportion of affected muscles per patient. Bars represent the average percentage of affected muscles, whiskers show one standard deviation, and dots account for the individual patient. There is no significant difference in the number of edema-positive muscles between IIM subgroups. B Histogram plot showing the severity of edema as indicated by edema-positive muscles. There appears to be a tendency for a higher proportion of edema-positive muscles in a subset of PM/ASyS/OLM- and IMNM patients. C Individual and summarized evaluation of edema in different IIM subgroups. Upper part of the heat map shows the individual edema distribution of each patient, stratified by the IIM subgroup. Lower part of the heat map displays the proportion of patients positive for edema in the individual muscle. A predominant affection of the lower limbs is found in sIBM, while there is only moderate affection in PM-Mito. PM/ASyS/OLM (P/A/O) and IMNM subgroups show a pronounced affection of head/neck (P/A/O), shoulder/thorax, and trunk. no number, Sternocleidomast. Sternocleidomastoideus, Spl. Splenius, cap. capitis, cerv. cervicis, Semisp. Semispinalis, scap. scapulae, thor. thoracis, maj. major, dors. dorsi, ant. anterior, max. maximus, med. medius/medialis, min. minimus, Add. Adductor, long. longus/longum, brev. brevis, magn. magnus, fasc. lat. fasciae latae, fem. femoris, intermed. intermedius, lat. lateralis, l.h. long head, s.h. short head, post. posterior, Ext. digit. Extensor digitorum, Gastrocn. Gastrocnemius, m.h. medial head, l.h. lateral head, Flex. hall. Flexor hallucis longus
Fig. 3
Fig. 3
Quantitative assessment of muscular fat fraction in IIM subgroups. A Representative example images used to quantify the muscular fat fraction (MFF). Note the proximo-distal gradient of muscular degeneration in sIBM (red arrowhead). B MFF of selected muscles in proximal, mid, and distal parts of the respective muscle (left panels), and determination of the distality ratio (MFF of distal versus proximal parts, right panel). Middle dash represents the average MFF, while whiskers indicate one standard deviation, and dots show individual patient's values. Further information regarding the additional muscles studied can be found in Table 2 and Suppl. Fig. 2. MFF of sIBM patients is consistently elevated in all studied lower extremity muscles. While MFF in proximal muscle parts appears to be comparable to other IIM subtypes, there is a significantly higher MFF in distal parts of sIBM patients, resulting in an increased distality ratio. In sIBM, this proximodistal gradient is found in all studied leg muscles except for rectus femoris (shown in Suppl. Fig. 2). In some muscles, such as the vastus medialis and vastus intermedius, similar changes are present in a proportion of PM-Mito and PM/ASyS/OLM (P/A/O) patients. For additional examples see Suppl. Fig. 2. Note the relevantly increased MFF of gluteus medius and sacrospinalis in PM/ASyS/OLM and IMNM. l.h. long head
Fig. 4
Fig. 4
Correlation of mean fat fraction and clinical determinants of IIM progression. A Stratified correlation coefficient (Pearson) of mean fat fraction (MFF) correlated with clinical determinants of IIM progression. Except for PM-Mito, there is a relevant correlation of MFF with the total number of affected muscles (portion of muscles with Fischer grade ≥ 2) in all IIM subtypes. In sIBM, MFF of quadriceps femoris correlates with disease duration. A similar correlation is found in IMNM for semitendinosus, and long head of biceps femoris. There is a significant inverse correlation of modified MRC sum score (MRC-SS) and MFF in sIBM (semitendinosus, medial head of gastrocnemius), and PM-Mito (various muscles as indicated). No relevant correlations are evident between creatine kinase (CK) and MFF in all IIM subgroups. B Sample correlations of MFF and total affected muscles, disease duration, and modified MRC sum score, shown for the medial head of the gastrocnemius. Note the significant correlations of MFF with the total percentage of affected muscles and MRC sum score in sIBM. Additional examples can be found in Suppl. Fig. 3. Abbreviations: SAC Sacrospinalis, GLM Gluteus medius, RF rectus femoris, VM Vastus medialis, VI Vastus intermedius, VL Vastus lateralis, GR Gracilis, SAR Sartorius, ST Semitendinosus, BFLH Biceps femoris long head, GMH Gastrocnemius medial head, FHL Flexor hallucis longus, P proximal, M mid, D distal
Fig. 5
Fig. 5
Schematic representation of muscular involvement in IIM subgroups based on semiquantitative assessment. Color graduation is based on the proportion of patients with fatty fibrous degeneration (right hemibody), and edema (left hemibody), respectively. Note the predominant affection of lower extremities in sIBM. In PM-Mito and PM/ASyS/OLM (P/A/O) there is an inconsistent and generally mild degeneration. If present, muscular degeneration tends to affect gluteal and paraspinal muscles in IMNM. While edema is mainly restricted to the lower extremities in sIBM and PM-Mito, proximal muscles (pelvis, trunk, shoulder and neck) are also affected in PM/ASyS/OLM and IMNM. SCM Sternocleidomastoideus, LS Levator scapulae, Mu Multifidus, SSc/SSca Semispinalis cervicis/capitis, Spc/Spca Splenius cervicis/capitis, Tr Trapezius, PMaj/PMin Pectoralis major/minor, BB Biceps brachii, CB Coracobrachialis, TMi Teres minor, TMa Teres major, TB Triceps brachii, D Deltoideus, SuS Subscapularis, SA Serratus anterior, IS Infraspinatus, LD Latissimus dorsi, RH Rhomboideus, LT Longissimus thoracis, SsTh Semispinalis thoracis, STh Spinalis thoracis, RA Rectus abdominis, OE/OI Obliquus externus/internus, PS Psoas, IL Iliacus, GMin/GMed/GMax Gluteus minimus/medius/maximus, Sac Sacrospinalis, RF Rectus femoris, VL/VI/VM Vastus lateralis/intermedius/medialis, SAR Sartorius, GR Gracilis, AL/AB/AM Adductor longus/brevis/magnus, SM Semimembranosus, ST Semitendinosus, BFLH/BFSH Biceps femoris long head/short head, TA Tibialis anterior, ED Extensor digitorum longus, PB/PL Peroneus brevis/longus, TP Tibialis posterior, SO Soleus, Fdl Flexor digitorum longus, Fhl Flexor hallucis longus, GMH/GLH Gastrocnemius medial head/lateral head

References

    1. Lundberg IE, Fujimoto M, Vencovsky J, et al. Idiopathic inflammatory myopathies. Nat Rev Dis Primers. 2021;7:86. - PubMed
    1. Uruha A, Goebel H-H, Stenzel W. Updates on the immunopathology in idiopathic inflammatory myopathies. Curr Rheumatol Rep. 2021;23:56. - PubMed
    1. Tanboon J, Uruha A, Stenzel W, Nishino I. Where are we moving in the classification of idiopathic inflammatory myopathies? Curr Opin Neurol. 2020;33:590–603. - PubMed
    1. Ashton C, Paramalingam S, Stevenson B, et al. Idiopathic inflammatory myopathies: a review. Intern Med J. 2021;51:845–852. - PubMed
    1. Benveniste O, Stenzel W, Allenbach Y. Advances in serological diagnostics of inflammatory myopathies. Curr Opin Neurol. 2016;29:662–673. - PubMed