

Identification and validation of RNA-binding protein SLC3A2 regulates melanocyte ferroptosis in vitiligo by integrated analysis of single-cell and bulk RNA-sequencing
- PMID: 38438962
- PMCID: PMC10910712
- DOI: 10.1186/s12864-024-10147-y
Identification and validation of RNA-binding protein SLC3A2 regulates melanocyte ferroptosis in vitiligo by integrated analysis of single-cell and bulk RNA-sequencing
Abstract
Background: The pathogenesis of vitiligo remains unclear. The genes encoding vitiligo-related RNA-binding proteins (RBPs) and their underlying pathogenic mechanism have not been determined.
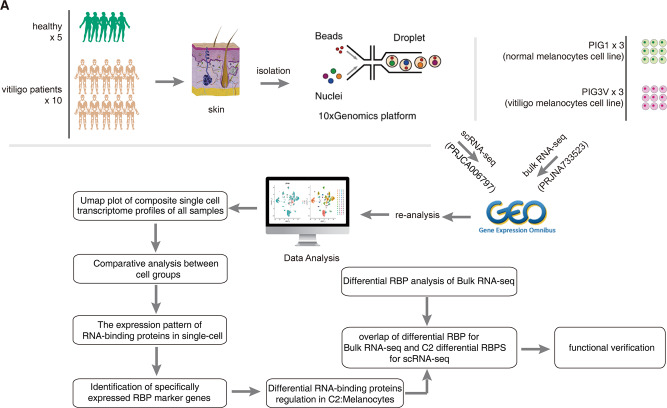
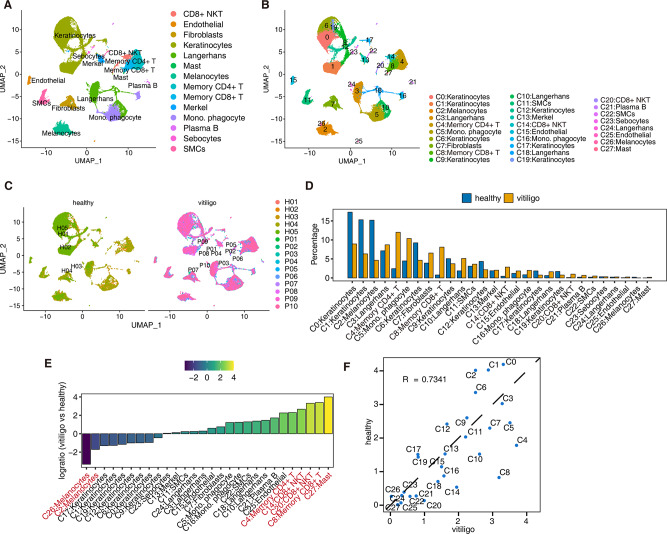
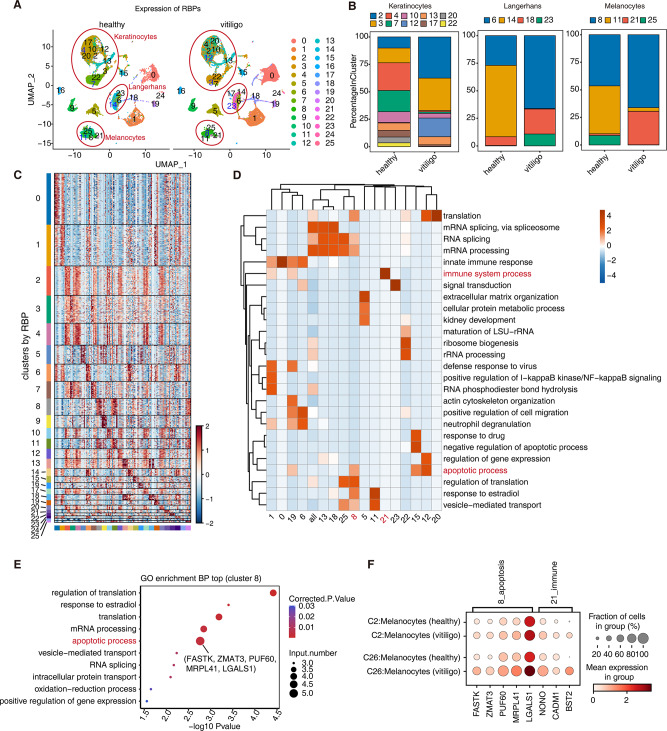
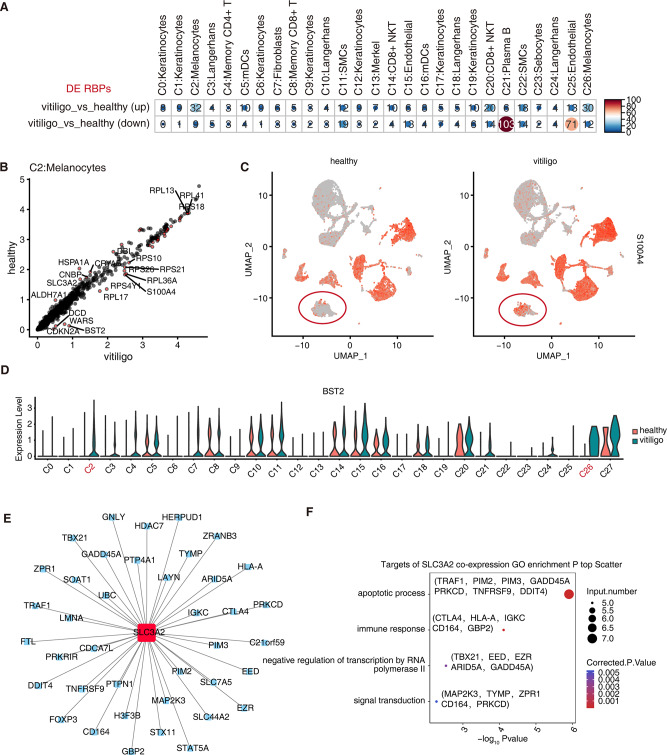
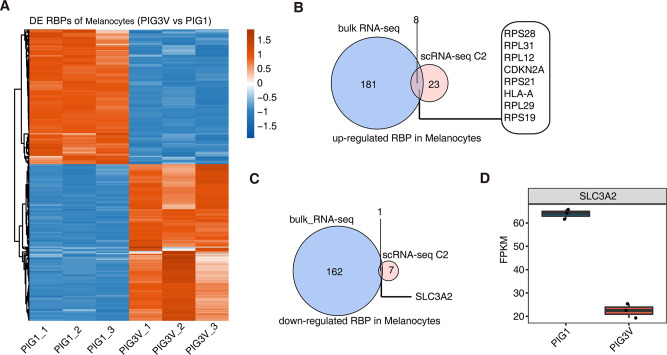
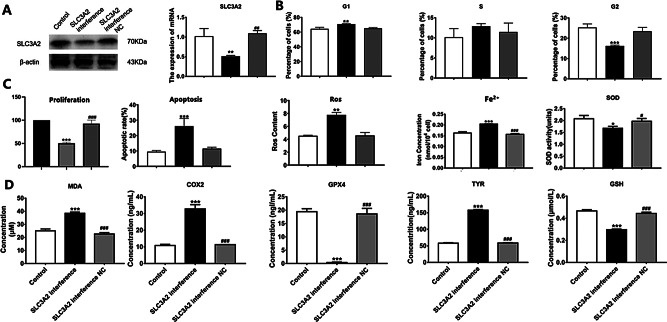
Results: Single-cell transcriptome sequencing (scRNA-seq) data from the CNCB database was obtained to identify distinct cell types and subpopulations and the relative proportion changes in vitiligo and healthy samples. We identified 14 different cell types and 28 cell subpopulations. The proportion of each cell subpopulation significantly differed between the patients with vitiligo and healthy groups. Using RBP genes for unsupervised clustering, we obtained the specific RBP genes of different cell types in vitiligo and healthy groups. The RBP gene expression was highly heterogeneous; there were significant differences in some cell types, such as keratinocytes, Langerhans, and melanocytes, while there were no significant differences in other cells, such as T cells and fibroblasts, in the two groups. The melanocyte-specific RBP genes were enriched in the apoptosis and immune-related pathways in the patients with vitiligo. Combined with the bulk RNA-seq data of melanocytes, key RBP genes related to melanocytes were identified, including eight upregulated RBP genes (CDKN2A, HLA-A, RPL12, RPL29, RPL31, RPS19, RPS21, and RPS28) and one downregulated RBP gene (SLC3A2). Cell experiments were conducted to explore the role of the key RBP gene SLC3A2 in vitiligo. Cell experiments confirmed that melanocyte proliferation decreased, whereas apoptosis increased, after SLC3A2 knockdown. SLC3A2 knockdown in melanocytes also decreased the SOD activity and melanin content; increased the Fe2+, ROS, and MDA content; significantly increased the expression levels of TYR and COX2; and decreased the expression levels of glutathione and GPX4.
Conclusion: We identified the RBP genes of different cell subsets in patients with vitiligo and confirmed that downregulating SLC3A2 can promote ferroptosis in melanocytes. These findings provide new insights into the pathogenesis of vitiligo.
Keywords: Bulk RNA sequencing; Ferroptosis; RNA-binding protein; SLC3A2; Single-cell sequencing; Vitiligo.
© 2024. The Author(s).
Conflict of interest statement
The authors declare no competing interests.
Figures
Similar articles
-
An investigation into the mechanism for Kaempferol improving melanocyte death based on network Pharmacology and experimental verification.Sci Rep. 2025 Mar 12;15(1):8616. doi: 10.1038/s41598-025-91905-0. Sci Rep. 2025. PMID: 40074768 Free PMC article.
-
Increased melanin induces aberrant keratinocyte - melanocyte - basal - fibroblast cell communication and fibrogenesis by inducing iron overload and ferroptosis resistance in keloids.Cell Commun Signal. 2025 Mar 18;23(1):141. doi: 10.1186/s12964-025-02116-z. Cell Commun Signal. 2025. PMID: 40102920 Free PMC article.
-
SLC3A2 inhibits ferroptosis in laryngeal carcinoma via mTOR pathway.Hereditas. 2022 Jan 20;159(1):6. doi: 10.1186/s41065-022-00225-0. Hereditas. 2022. PMID: 35057861 Free PMC article.
-
Mechanisms of melanocyte death in vitiligo.Med Res Rev. 2021 Mar;41(2):1138-1166. doi: 10.1002/med.21754. Epub 2020 Nov 17. Med Res Rev. 2021. PMID: 33200838 Free PMC article. Review.
-
The fate of melanocyte: Mechanisms of cell death in vitiligo.Pigment Cell Melanoma Res. 2021 Mar;34(2):256-267. doi: 10.1111/pcmr.12955. Epub 2021 Jan 9. Pigment Cell Melanoma Res. 2021. PMID: 33346939 Review.
Cited by
-
Unveiling ferroptosis: a new frontier in skin disease research.Front Immunol. 2024 Oct 4;15:1485523. doi: 10.3389/fimmu.2024.1485523. eCollection 2024. Front Immunol. 2024. PMID: 39430757 Free PMC article. Review.
-
The Role of Solute Carriers in the Metabolic Reprogramming of Skin Diseases.Clin Rev Allergy Immunol. 2025 Aug 13;68(1):80. doi: 10.1007/s12016-025-09095-6. Clin Rev Allergy Immunol. 2025. PMID: 40796987 Review.
-
Bioinformatic analysis of ferroptosis related biomarkers and potential therapeutic targets in vitiligo.Sci Rep. 2025 Jan 15;15(1):2035. doi: 10.1038/s41598-025-86061-4. Sci Rep. 2025. PMID: 39814853 Free PMC article.
-
Dietary Interventions, Supplements, and Plant-Derived Compounds for Adjunct Vitiligo Management: A Review of the Literature.Nutrients. 2025 Jan 20;17(2):357. doi: 10.3390/nu17020357. Nutrients. 2025. PMID: 39861486 Free PMC article. Review.
References
-
- Yee C, Thompson JA, Roche P, Byrd DR, Lee PP, Piepkorn M, Kenyon K, Davis MM, Riddell SR, Greenberg PD. Melanocyte destruction after antigen-specific immunotherapy of melanoma: direct evidence of T cell-mediated vitiligo. J Exp Med. 2000;192(11):1637–43. doi: 10.1084/jem.192.11.1637. - DOI - PMC - PubMed
MeSH terms
Substances
Grants and funding
LinkOut - more resources
Full Text Sources
Medical
Molecular Biology Databases
Research Materials
Miscellaneous
