. 2024 Mar 4;29(1):31.
doi: 10.1186/s11658-024-00553-1.

Inhibition of Drp1- Fis1 interaction alleviates aberrant mitochondrial fragmentation and acute kidney injury

Affiliations

Inhibition of Drp1- Fis1 interaction alleviates aberrant mitochondrial fragmentation and acute kidney injury

Zhixia Song et al. Cell Mol Biol Lett. .

Abstract

Background: Acute kidney injury (AKI) is a common clinical disorder with complex etiology and poor prognosis, and currently lacks specific and effective treatment options. Mitochondrial dynamics dysfunction is a prominent feature in AKI, and modulation of mitochondrial morphology may serve as a potential therapeutic approach for AKI.

Methods: We induced ischemia-reperfusion injury (IRI) in mice (bilateral) and Bama pigs (unilateral) by occluding the renal arteries. ATP depletion and recovery (ATP-DR) was performed on proximal renal tubular cells to simulate in vitro IRI. Renal function was evaluated using creatinine and urea nitrogen levels, while renal structural damage was assessed through histopathological staining. The role of Drp1 was investigated using immunoblotting, immunohistochemistry, immunofluorescence, and immunoprecipitation techniques. Mitochondrial morphology was evaluated using confocal microscopy.

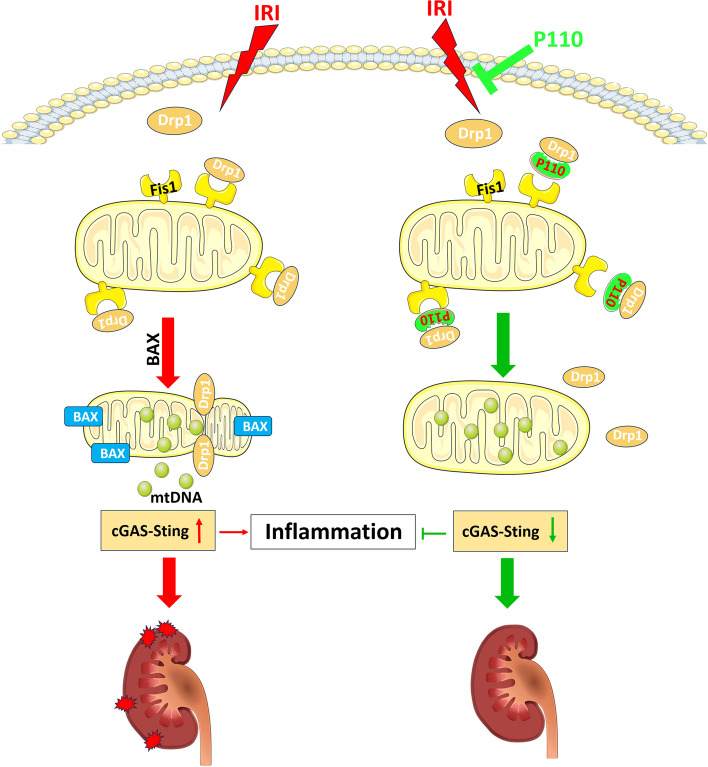
Results: Renal IRI induced significant mitochondrial fragmentation, accompanied by Dynamin-related protein 1 (Drp1) translocation to the mitochondria and Drp1 phosphorylation at Ser616 in the early stages (30 min after reperfusion), when there was no apparent structural damage to the kidney. The use of the Drp1 inhibitor P110 significantly improved kidney function and structural damage. P110 reduced Drp1 mitochondrial translocation, disrupted the interaction between Drp1 and Fis1, without affecting the binding of Drp1 to other mitochondrial receptors such as MFF and Mid51. High-dose administration had no apparent toxic side effects. Furthermore, ATP-DR induced mitochondrial fission in renal tubular cells, accompanied by a decrease in mitochondrial membrane potential and an increase in the translocation of the pro-apoptotic protein Bax. This process facilitated the release of dsDNA, triggering the activation of the cGAS-STING pathway and promoting inflammation. P110 attenuated mitochondrial fission, suppressed Bax mitochondrial translocation, prevented dsDNA release, and reduced the activation of the cGAS-STING pathway. Furthermore, these protective effects of P110 were also observed renal IRI model in the Bama pig and folic acid-induced nephropathy in mice.

Conclusions: Dysfunction of mitochondrial dynamics mediated by Drp1 contributes to renal IRI. The specific inhibitor of Drp1, P110, demonstrated protective effects in both in vivo and in vitro models of AKI.

Keywords: Acute kidney injury; Drp1; Fis1; Ischemia reperfusion injury; Mitochondria.


Conflict of interest statement

All the authors declared no competing interests.

Figures

Fig. 1
Fig. 1
The activation of Drp1 and mitochondrial fragmentation are early events in renal IRI. A Representative images of H&E staining, KIM-1 and NGAL immunohistochemistry, Scale bar = 50 µm. B Pathological score of tubular damage, quantification of KIM-1 and NGAL positive tubules. C The serum creatinine level and BUN level. D Representative electron micrographs of mitochondrial morphology in proximal tubule cells. E Representative Immunoblot and quantitative analysis of p-Drp1(Ser616) in kidney tissue. β-actin was used as a loading control. F Representative Immunoblot and densitometry analysis of Drp1 in renal cytosolic and mitochondrial fractions. COX IV and glyceraldehyde-3-phosphate dehydrogenase (GAPDH) were used as loading controls of mitochondrial and cytosolic fractions, respectively. G Representative Immunoblot and quantitative analysis of P-Drp1(Ser616) in mPTCs cells.β-actin was used as a loading control. H Representative Immunoblot and densitometry analysis of Drp1 in mPTCs cells cytosolic and mitochondrial fractions. COX IV and glyceraldehyde-3-phosphate dehydrogenase (GAPDH) were used as loading controls of mitochondrial and cytosolic fractions, respectively. Quantitative data are expressed as mean ± SD (n = 5). *P < 0.05 versus respective Sham group or Control group
Fig. 2
Fig. 2
P110 alleviates ischemic AKI and Inflammatory response in mice. A Representative images of H&E staining, KIM-1,NGAL and F4/80 immunohistochemistry. Scale bar = 50 μm. B Serum creatinine and BUN measurement. C Pathological score of tubular damage, Quantification of KIM-1,NGAL and F4/80 positive tubules. D Representative Immunoblot and quantitative analysis of IL-1β,MCP-1 and F4/80 in renal.β-actin was used as loading control. E q-PCR analysis of IL-1β, IL-6 and TNF-α. Quantitative data are expressed as mean ± SD (n = 5–8). *P < 0.05 versus respective Sham group; #P < 0.05 versus IR group
Fig. 3
Fig. 3
P110 enhances mitochondrial recovery and cell proliferation. A Representative images of Ki67 immunofluorescence and PGC-1α and Cox I immunohistochemistry. Scale bar = 50 μm. B Quantification of Ki67 and Cox I positive tubules. C Representative Immunoblot and quantitative analysis of PGC-1α,SIRT3 and TFAM.β-actin was used as a loading control. D q-PCR analysis of Sirt3,Pgc1α and Nampt. Quantitative data are expressed as mean ± SD (n = 5). *P < 0.05 versus respective Sham group; #P < 0.05 versus IR group
Fig. 4
Fig. 4
P110 reduced mitochondrial dysfunction in the ATP depletion model and enhanced cellular vitality A Representative images of cell morphology, DAPI staining of cell nuclei, PI staining and Merge. Scale bar = 100 μm. B Percentage of cell death assessed morphologically. C, D Representative images and quantification of JC-1 staining showing red fluorescence of JC-1 aggregate and green signal of monomer. E, F mPTCs were incubated with 5 μM CellROX Deep Red reagent for 30 min. ROS generation was visualized by fluorescence microscopy. G, H Representative Immunoblot and quantitative analysis of Cleaved-caspase3.β-actin was used as a loading control. I Measurement of the mitochondrial oxygen consumption ratio (OCR) of mPTCs cells treated with ATP depletion for 3 h compared to control cells (n = 10 cultures per treatment group). Maximal OCR were mentioned. Quantitative data are expressed as mean ± SD. *P < 0.05 versus respective Control group; #P < 0.05 versus ATP-DR group
Fig. 5
Fig. 5
P110 reduces the translocation of Drp1 to the mitochondria and mitochondrial fission. A Representative electronic microscopy images of proximal tubular cells and percentage of proximal tubule cells with mostly fragmented mitochondria (1% filamentous mitochondria). B Fluorescence after mitoRed transfection and the number of cells with fragmented mitochondria was quantified in each condition. C Representative Immunoblot and densitometry analysis of Drp1 in renal cytosolic and mitochondrial fractions. COX IV and glyceraldehyde-3-phosphate dehydrogenase (GAPDH) were used as loading controls of mitochondrial and cytosolic fractions, respectively. D Representative immunoblots densitometry analysis of Drp1 in mPTCs cells cytosolic and mitochondrial fractions. COX IV and glyceraldehyde-3-phosphate dehydrogenase (GAPDH) were used as loading controls of mitochondrial and cytosolic fractions, respectively. Quantitative data are expressed as mean ± SD. *P < 0.05 versus respective Sham/Control group; #P < 0.05 versus IR/ATP-DR group
Fig. 6
Fig. 6
P110 reduces the interaction between Fis1 and Drp1 induced by ATP depletion. AC Immunoprecipitation analysis of the Fis1-Drp1 interaction 、MFF-Drp1 interaction and the MiD51-Drp1 interaction. E Representative confocal fluorescence microscopy of Drp1 and Fis1 in mPTC cells. Scale bar = 10 μm. D mPTC cells were treated with the P110 (1 µM) for 3 h followed by treatment with ATP-depletion for 2 h. Following a brief cross-linking, cells were homogenized. Total cell lysates were then subjected to immunoprecipitation (IP) with anti-Fis1 antibodies, and the immunoprecipitates were analyzed by immunoblotting (IB) with anti-Drp1antibodies. Quantification of Drp1/Fis1 expression. Quantitative data are expressed as mean ± SD. *P < 0.05 versus respective Control group;#, P < 0.05 versus ATP-DR group
Fig. 7
Fig. 7
P110 reduces the translocation of Bax induced by ATP depletion and the release of mtDNA. A Representative confocal fluorescence microscopy of Bax and Mitotracker in mPTC cells. Scale bar = 10 μm BD Representative Immunoblot and densitometry analysis of Bax in renal cytosolic and mitochondrial fractions. COX IV and GAPDH were used as loading controls of mitochondrial and cytosolic fractions, respectively. E Representative confocal fluorescence microscopy of dsDNA and Fis1 in mPTC cells. Scale bar = 10 μm. F Ratio of cytoplasmic to total mtDNA determined by qPCR analysis of mPTC cells. Quantitative data are expressed as mean ± SD. *P < 0.05 versus respective Sham/Control group; #P < 0.05 versus IR/ATP-DR group
Fig. 8
Fig. 8
P110 alleviates the cGAS-STING pathway induced by IRI. A, B Representative Immunoblot and quantitative analysis of cGAS,p-TBK1,p-p65 and p-IRF3 in kidney tissue. Quantitative data represent the relative ratio to total TBK1 or p65 or IRF3.Cyclophilin B (CycB) was used as loading control. C Representative images of STING immunohistochemistry. Scale bar = 50 μm. D q-PCR analysis of MCP-1, Irf7,Cxcl10,Ifit1,Ifit3,Isg15,Cgas and Ifnb1.Quantitative data are expressed as mean ± SD. *P < 0.05 versus respective Sham group; #P < 0.05 versus IR group
Fig. 9
Fig. 9
P110 alleviates ischemic AKI and inflammation in Bama pigs. A Representative images of H&E staining, PAS staining and TUNEL staining, Scale bar = 50 µm. B Pathological score of tubular damage and Quantitative analysis of apoptotic cell numbers per mm square of kidney tissue. C The serum creatinine level. D The BUN level. D Representative Immunoblot and quantitative analysis of cGAS,p-TBK1,p-p65 and p-IRF3 in Bama pigs kidney tissue. Quantitative data represent the relative ratio to total TBK1 or p65 or IRF3. Cyclophilin B (CycB) was used as loading control.Quantitative data are expressed as mean ± SD. *P < 0.05 versus respective Sham group; #P < 0.05 versus IR group
Fig. 10
Fig. 10
Schematic diagram of the findings of this study. P110 can exert significant protective effects in renal ischemia–reperfusion injury (IRI) by inhibiting the interaction between Drp1 and Fis1, reducing Drp1-mediated mitochondrial fragmentation

References

    1. Acute kidney injury. Nat Rev Dis Primers. 2021;7(1):51. - PubMed
    1. Ronco C, Bellomo R, Kellum JA. Acute kidney injury. Lancet (London, England) 2019;394(10212):1949–1964. doi: 10.1016/S0140-6736(19)32563-2. - DOI - PubMed
    1. James MT, Bhatt M, Pannu N, Tonelli M. Long-term outcomes of acute kidney injury and strategies for improved care. Nat Rev Nephrol. 2020;16(4):193–205. doi: 10.1038/s41581-019-0247-z. - DOI - PubMed
    1. Pickkers P, Darmon M, Hoste E, Joannidis M, Legrand M, Ostermann M, et al. Acute kidney injury in the critically ill: an updated review on pathophysiology and management. Intensive Care Med. 2021;47(8):835–850. doi: 10.1007/s00134-021-06454-7. - DOI - PMC - PubMed
    1. Barbosa ACS, Pfister KE, Chiba T, Bons J, Rose JP, Burton JB, et al. Dicarboxylic acid dietary supplementation protects against acute kidney injury. J Am Soc Nephrol. 2023. - PMC - PubMed