. 2024 Mar 4;22(1):158.
doi: 10.1186/s12964-024-01486-0.

Large-scale phosphoproteomics reveals activation of the MAPK/GADD45β/P38 axis and cell cycle inhibition in response to BMP9 and BMP10 stimulation in endothelial cells

Affiliations

Large-scale phosphoproteomics reveals activation of the MAPK/GADD45β/P38 axis and cell cycle inhibition in response to BMP9 and BMP10 stimulation in endothelial cells

Mohammad Al Tarrass et al. Cell Commun Signal. .

Abstract

Background: BMP9 and BMP10 are two major regulators of vascular homeostasis. These two ligands bind with high affinity to the endothelial type I kinase receptor ALK1, together with a type II receptor, leading to the direct phosphorylation of the SMAD transcription factors. Apart from this canonical pathway, little is known. Interestingly, mutations in this signaling pathway have been identified in two rare cardiovascular diseases, hereditary hemorrhagic telangiectasia and pulmonary arterial hypertension.

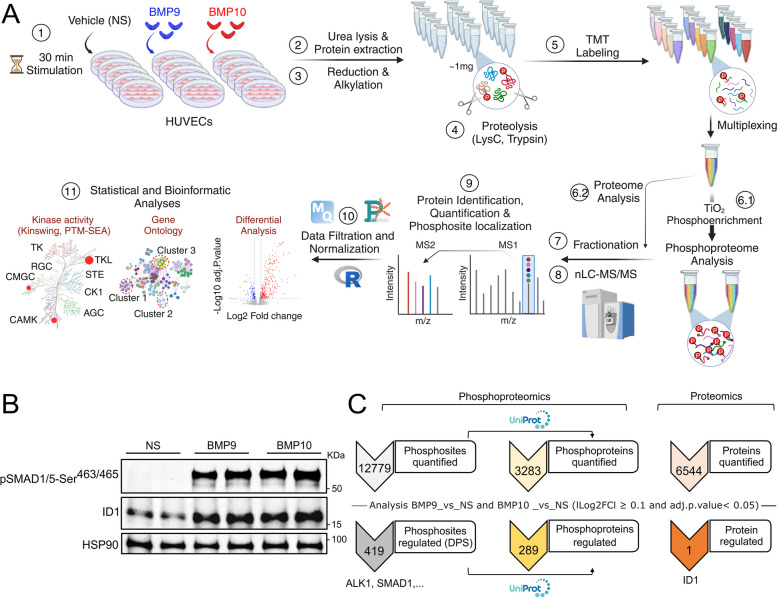
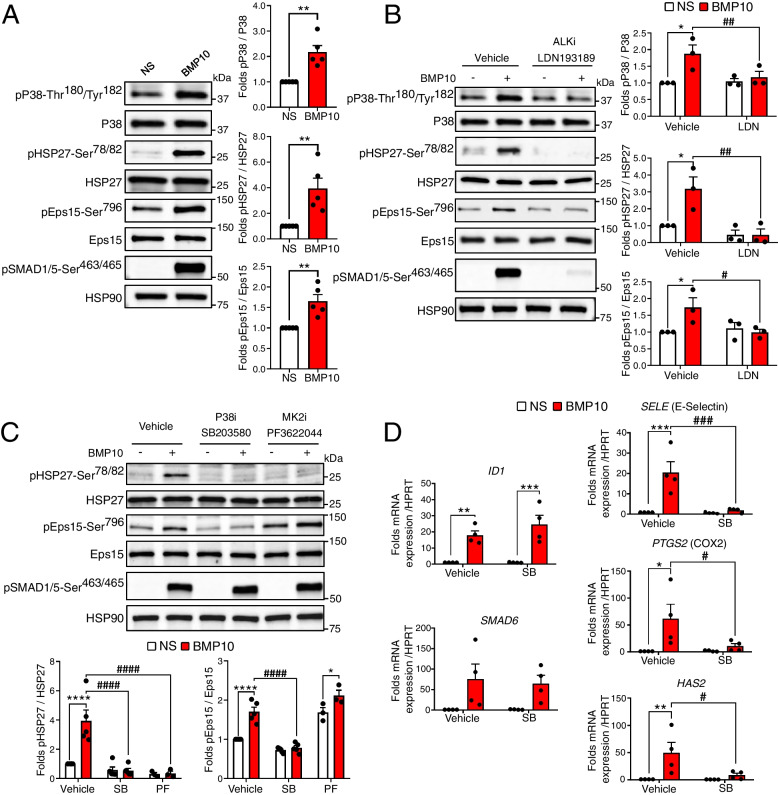
Methods: To get an overview of the signaling pathways modulated by BMP9 and BMP10 stimulation in endothelial cells, we employed an unbiased phosphoproteomic-based strategy. Identified phosphosites were validated by western blot analysis and regulated targets by RT-qPCR. Cell cycle analysis was analyzed by flow cytometry.

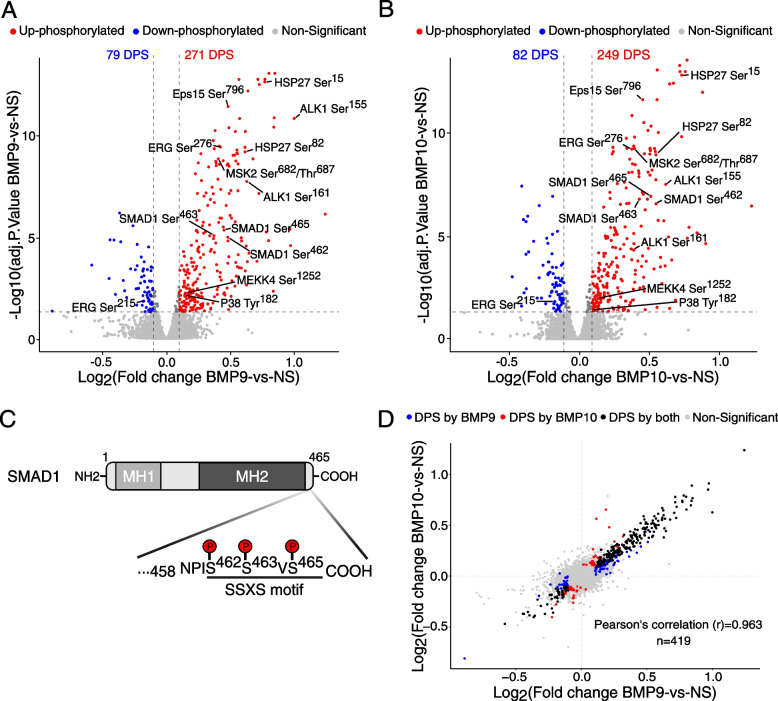
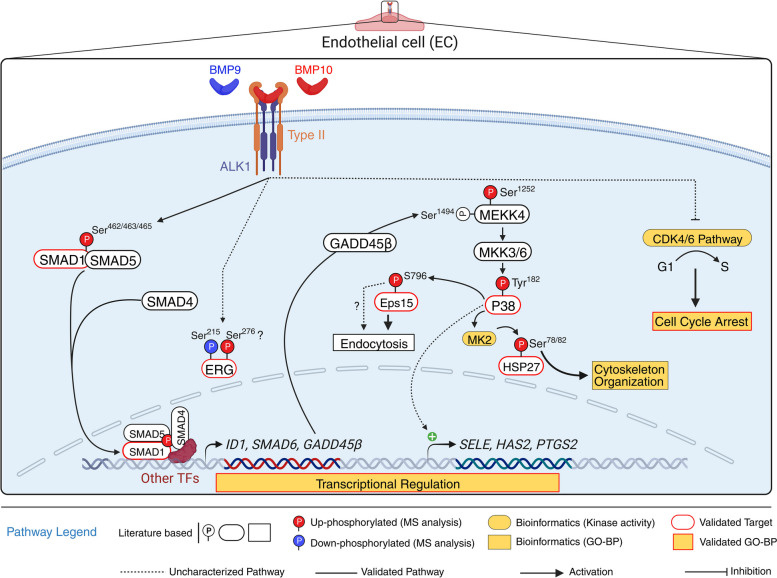
Results: Large-scale phosphoproteomics revealed that BMP9 and BMP10 treatment induced a very similar phosphoproteomic profile. These BMPs activated a non-canonical transcriptional SMAD-dependent MAPK pathway (MEKK4/P38). We were able to validate this signaling pathway and demonstrated that this activation required the expression of the protein GADD45β. In turn, activated P38 phosphorylated the heat shock protein HSP27 and the endocytosis protein Eps15 (EGF receptor pathway substrate), and regulated the expression of specific genes (E-selectin, hyaluronan synthase 2 and cyclooxygenase 2). This study also highlighted the modulation in phosphorylation of proteins involved in transcriptional regulation (phosphorylation of the endothelial transcription factor ERG) and cell cycle inhibition (CDK4/6 pathway). Accordingly, we found that BMP10 induced a G1 cell cycle arrest and inhibited the mRNA expression of E2F2, cyclinD1 and cyclinA1.

Conclusions: Overall, our phosphoproteomic screen identified numerous proteins whose phosphorylation state is impacted by BMP9 and BMP10 treatment, paving the way for a better understanding of the molecular mechanisms regulated by BMP signaling in vascular diseases.

Keywords: BMP10; BMP9; Endothelial cells; MAPK; Phosphoproteomics; Proliferation; Signaling.


Conflict of interest statement

The authors declare no competing interests.

Figures

Fig. 1
Fig. 1
Phosphoproteome profiling of BMP9 and BMP10 stimulation in human umbilical vein endothelial cells (HUVECs). A Graphical representation of the experimental workflow for phosphoproteomic analysis. (1) HUVECs were stimulated or not (NS) with 10 ng/mL of BMP9 or BMP10 for 30 min. (2) Lysates from five biological replicates per condition were prepared and (3) subjected to reduction and alkylation, followed by (4) digestion using a combination of two endoproteinases, LysC and trypsin. (5) The resulting peptides were labeled with tandem mass tag (TMT) reagents and pooled for subsequent analysis. Phosphorylated peptides were then enriched using titanium dioxide (TiO2) beads (6.1), while a small portion of the pooled samples was reserved for proteomic analysis (6.2). (7, 8) The proteome and phosphoproteome samples were fractionated and analyzed using liquid chromatography tandem Mass spectrometry (LC–MS/MS). Phosphoproteomic analysis was performed twice on two separate fractions generating two technical replicates. (9–11) Data analysis was then performed using different bioinformatics tools. B Western blotting analysis of two biological replicates for each condition (NS, BMP9 or BMP10) used for phosphoproteomic analyses showing the levels of SMAD1/5 phosphorylation and ID1 expression. C Upper numbers represent count of identified and quantified phosphosites and their corresponding phosphoproteins annotated in UniProtKB database, as well as that of proteins (proteomic analysis) across all samples. Bottom numbers represent total count of differentially phosphorylated sites (DPS) and proteins by both BMP9 and BMP10
Fig. 2
Fig. 2
Analysis of phosphoproteomic changes in response to BMP9 and BMP10 in HUVECs. A and B Volcano plots representing the log2 fold change in the abundance of phosphopeptides plotted against the –log10 adj. P.value, showing differentially phosphorylated sites (DPS) which are down-phosphorylated (blue) or up-phosphorylated (red) in response to BMP9 (A) or BMP10 (B) stimulation. DPSs from the canonical ALK1/SMAD1 signaling pathway as well as those which will be further studied in the work are annotated. C SMAD1 linear structure showing the MH1 (MAD homology domain 1) and MH2 domain, along with the C-terminal SSXS motif sites highlighted in panels A and B. D Scatter plot comparing log2 fold change values of DPS regulated by BMP9 and BMP10. Pearson’s correlation (r) is reported
Fig. 3
Fig. 3
Bioinformatic analyses of the phosphoproteomic changes in response to BMP9 and BMP10 in HUVECs. A Gene ontology on biological processes (≥ 1.5-fold enrichment, P ≤ 0.05) was conducted using Metascape, based on DPS gene list for BMP9 and BMP10. Only the common clusters between BMP9 and BMP10 are shown, with the top 5 terms for each cluster. The full list of clusters and their corresponding terms are outlined in Table S5. B Scatter Plot of KinSwing scores of kinases whose activities were predicted to be significantly changed in response to BMP9 and/or BMP10. Positive swing scores indicate predicted activation of a kinases, while negative scores indicate predicted under-activation of a kinase. C Post translational modification signature enrichment analysis (PTM-SEA) performed using PTMsigDB. Bar plot represents the top signatures enriched in BMP9 and/or BMP10 stimulated HUVECs compared to NS cells, ordered in terms of average FDR from both comparisons. Each bar represents a signature (kinase or perturbation). PERT, Perturbation; PSP, Phosphositeplus. D Hypothetical signaling framework in response to BMP9 and BMP10 based on phosphoproteomic analysis and literature-based data. Phosphorylated residues with increased abundance in response to BMP9 and BMP10 are marked in red, while those displaying decreased abundance are marked in blue. Bold numbers represents phosphosites with low-throughput papers derived from PhosphositePlus. Grey curved rectangles represent BMP9 and BMP10-derived differentially phosphorylated proteins, white ones are from literature. Orange curved rectangles: bioinformatic-predicted kinases (KinSwing or PTM-SEA). Solid orange rectangles: GO-BP analysis-identified processes, white from literature. Dashed lines signify uncharacterized mechanisms
Fig. 4
Fig. 4
ERG is differentially phosphorylated by BMP10 in HUVECs. A HUVECs were stimulated with 10 ng/mL BMP10 or not (NS) for 30 min. Cell extracts were subjected to immunoprecipitation (IP) using ERG antibody, followed by WB using pan phosphoserine (pSer) and ERG antibodies. Total serine phosphorylation of ERG was quantified and normalized to total ERG levels. IgG represents lysates subjected to IP using isotype control antibody. Whole cell extracts (input) were subjected to WB analysis using antibodies against pSMAD1/5, ERG and HSP90. Data are presented as mean folds (BMP10-vs-NS) ± SEM of n = 4 independent experiments.*P < 0.05 using Kolmogorov–Smirnov test. B HUVECs were stimulated with 10 ng/mL BMP10, or VEGF (40 ng/mL), BMP10 + VEGF (10 and 40 ng/mL, respectively) or not (NS) for 30 min. Cell extracts were subjected to IP using ERG antibody, followed by WB using antibodies against ERG-Ser215 and ERG. Quantification of ERG phosphorylation reflects the normalized signal for the pERG-Ser215 to total ERG from each sample. IgG represents lysates subjected to IP using isotype control antibody. Whole cell extracts (input) were subjected to WB analysis using antibodies against pERK1/2-Thr202/Tyr204, ERK1/2, ERG, pSMAD1/5, and HSP90 (loading control). Data are presented as mean folds (BMP10, VEGF or VEGF + BMP10-vs-NS) ± SEM of at least 5 independent experiments. Statistical analyses were performed using two-way ANOVA followed by Sidak's multiple comparisons post-test. *P < 0.05
Fig. 5
Fig. 5
BMP10 signaling in HUVECs drives the activation of the P38-MK2 axis. A HUVECs were stimulated with 10 ng/mL BMP10 or not (NS) for 30 min. Cell extracts were subjected to western blotting (WB) analysis using antibodies against phosphorylated (p) P38-Thr180/Tyr182, P38, pHSP27-Ser78/82, HSP27, pEps15-Ser796, Eps15, pSMAD1/5-Ser463/465 and HSP90 (loading control). Quantification of phosphorylation for P38, HSP27 and Eps15 reflects the normalized signal for the phosphorylated protein to total protein content, presented as mean fold change (BMP10-vs-NS) ± SEM of n = 5 independent experiments. **P < 0.01 using Kolmogorov–Smirnov test. B and C HUVECs were pretreated with selective ALK1/2/3/6 inhibitor LDN193189 (LDN, 5 µM) (Panel B), P38 inhibitor SB203580 (SB, 10 µM) or MK2 inhibitor PF3622044 (PF, 5 µM) (Panel C), or left untreated (vehicle) for 30 min. Subsequently, cells were stimulated with 10 ng/mL BMP10 or not (NS) for an additional 30 min. Cell lysates were then analyzed by WB using the indicated antibodies and quantification was performed as explained in panel A. Data shown represent mean folds ± SEM of at least 3 independent experiments. D HUVECs were pretreated with P38 inhibitor SB203580 (SB, 10 μM) or left untreated (vehicle) for 30 min. Cells were then stimulated with 10 ng/mL BMP10 or not (NS) for 4 h. Real-time quantitative polymerase chain reaction analysis was then performed to determine mRNA expression of ID1, SMAD6, SELE (E-Selectin), PTGS2 (COX2), and HAS2. Target gene expression was normalized to HPRT using 2-ΔΔCt method and presented as fold induction (BMP10-vs-vehicle) ± SEM of n = 4 independent experiments. Statistical analyses for panels B, C and D were performed using two-way ANOVA followed by Sidak's multiple comparisons post-test. For all panels: *,#P < 0.05; **,##P < 0.01; ***,###P < 0.001; ****,####P < 0.0001. *: BMP10-vs-NS; #: vehicle-vs-inhibitor (LDN, SB or PF)
Fig. 6
Fig. 6
BMP10 signaling in HUVECs induces a delayed activation of the P38 MAPK pathway via GADD45β expression. A Cells were stimulated with 10 ng/mL BMP10 or not (NS). Cell extracts were subjected to WB analysis using antibodies against pP38-Thr180/Tyr182, P38, pHSP27-Ser78/82, HSP27, pEps15-Ser796, Eps15, pSMAD1/5-Ser463/465 and HSP90. Data are presented as fold change of each sample ± SEM relative to NS 5 min, n ≥ 3. B HUVECs were treated either with scrambled siRNA (siCTL) or siSMAD4 and then stimulated with BMP10 or not for 30 min. Cell extracts were analyzed by WB was performed as in panel A. C HUVECs were pre-treated either with vehicle or the transcription inhibitor actinomycin D (Act.D, 5 μM) for 30 min, then stimulated with BMP10 or not for another 30 min. Cell extracts were analyzed by WB as in panel A. Data are presented as mean folds ± SEM of n = 3. D SMAD1 binding sites and number of overlaps with footprints within GADD45β promoter extracted from transcription factor target gene database (TFBS). E HUVECs were stimulated with BMP10 or not (NS) and GADD45β mRNA expression was then assessed by RT-qPCR. The level of GADD45β mRNA expression was normalized to HPRT and represented as fold induction of each NS and BMP10 stimulated sample relative NS 0 min ± SEM of n = 2. (F) HUVECs were treated with either scrambled siRNA (siCTL) or siGADD45β and then stimulated with BMP10 or not (NS) for 30 min. Cell extracts were analyzed by WB as in panel A. Data are presented as mean folds ± SEM of n = 3. Statistical analysis for panel A was performed using Kruskal Wallis with Sidak’s post-test. Statistical analyses for panels B, C and F were performed using two-way ANOVA followed by Sidak's multiple comparisons posttest. For all panels: *,#P < 0.05; **, ##P < 0.01; ***, ###P < 0.001. *: BMP10-vs-NS; #: siCTL-vs-siSMAD4 or siGADD45β, or Vehicle-vs-Act.D
Fig. 7
Fig. 7
BMP10 inhibits the G1/S cell cycle transition in HUVECs. A HUVECs were synchronized at the G1 phase by serum starvation for 48 h. Subsequently, cells were then either replenished with 5% FBS or 0.5% FBS in the presence or absence (NS) of 10 ng/mL BMP10 added overnight. Cells were then treated with EdU for 1.5 h, trypsinized, and labeled for EdU (S phase) and propidium iodide (PI). Left panel: flow cytometry analysis assessing the distribution of different stages of the cell cycle (G1, S, G2/M). Right panel: Quantification of different cell cycle stages. Data are represented as mean % of each stage ± SEM of n = 4 and analyzed using two-way ANOVA with Benjamin Hochberg multiple comparisons post-test. Red asterisks represent statistical significance from G1-phase population comparisons between different conditions, while green asterisks represent that for S-phase population comparisons. * P < 0.05; *** P < 0.001. B Schematic representation of different key proteins implicated in the G1/S transition of the cell cycle. C HUVECs were stimulated or not with 10 ng/mL BMP10 for 2, 4, or 8 h. RT-qPCR analysis was then performed to determine mRNA expression of E2F2, CCND1 and CCNA1. Target gene expression was normalized to HPRT mRNA level using 2-ΔΔCt method and presented as relative expression (%) (BMP10-vs-vehicle) ± SEM at each time point (n = 3). *, #and $ represents statistical significance (BMP10-vs-NS) for CCND1, E2F2 and CCNA1, respectively. Statistical analysis was performed using Kruskal Wallis with Dunnett’s post-test*, #, $P < 0.05; ##P < 0.01; *** P < 0.001; ****, ####, $$$$ P < 0.0001. D HUVECs were synchronized and stimulated as explained in panel A. Cell extracts were subjected to WB analysis using antibodies against pRB1-Ser807/811, CyclinD1, and P27. Quantifications were performed using HSP90. Data are presented as mean folds ± SEM of n = 4. *P < 0.05 using Kolmogorov–Smirnov test
Fig. 8
Fig. 8
Working model: BMP9/BMP10/ALK1/SMAD4 Signaling drives the regulation of direct and indirect pathways in ECs. Binding of BMP9 and BMP10 (BMP9/10) to ALK1 along with a type II receptor on ECs mediates the activation of ALK1, leading to the initiation of direct and indirect pathways. The direct pathway involves the SMAD cascade, where activated ALK1 phosphorylates the C-terminus of SMAD1 and SMAD5, allowing the recruitment of SMAD4, forming a trimeric SMAD complex. This trimeric SMAD complex subsequently translocated to the nucleus, where it binds to the promoters of target genes with the assistance of other transcription factors (TFs), thereby regulating their expression levels. Among these, BMP9/10 induce the expression of ID1, SMAD6 and GADD45β (newly identified target). The indirect pathway involves the expression of GADD45β, an activator of MEKK4, which mediates activation of P38/MK2 signaling axis by these ligands. In this cascade, P38 phosphorylates Eps15-Ser796, while P38/MK2 phosphorylates HSP27-Ser78/82, which have been described to play important roles in endocytosis and cytoskeleton organization, respectively. BMP9 and BMP10 also induce the differential phosphorylation of the transcription factor ERG via an uncharacterized mechanism. Additionally, P38 activation regulates a subset of BMP9/10-induced genes, including SELE, HAS2, and PTGS2. On the other hand, BMP9/10 downregulates the CDK4/6 pathway leading to inhibition of G1/S transition and cell cycle arrest

References

    1. Katagiri T, Watabe T. Bone MORPHOGENETIC PROTEINS. Cold Spring Harb Perspect Biol. 2016;8:a021899. doi: 10.1101/cshperspect.a021899. - DOI - PMC - PubMed
    1. Desroches-Castan A, Tillet E, Bouvard C, Bailly S. BMP9 and BMP10: Two close vascular quiescence partners that stand out. Dev Dyn. 2022;251:158–177. doi: 10.1002/dvdy.395. - DOI - PubMed
    1. Roman BL, Hinck AP. ALK1 signaling in development and disease: new paradigms. Cell Mol Life Sci. 2017;74:4539–4560. doi: 10.1007/s00018-017-2636-4. - DOI - PMC - PubMed
    1. Vorselaars VMM, Hosman AE, Westermann CJJ, Snijder RJ, Mager JJ, Goumans M-J, et al. Pulmonary arterial hypertension and hereditary haemorrhagic telangiectasia. Int J Mol Sci. 2018;19:3203. doi: 10.3390/ijms19103203. - DOI - PMC - PubMed
    1. Moustakas A, Heldin C-H. Non-Smad TGF-beta signals. J Cell Sci. 2005;118:3573–3584. doi: 10.1242/jcs.02554. - DOI - PubMed

Publication types

Substances