. 2024 May 17;25(10):e202400087.
doi: 10.1002/cbic.202400087. Epub 2024 May 2.

A Dual-Gene Reporter-Amplifier Architecture for Enhancing the Sensitivity of Molecular MRI by Water Exchange

Affiliations

A Dual-Gene Reporter-Amplifier Architecture for Enhancing the Sensitivity of Molecular MRI by Water Exchange

Yimeng Huang et al. Chembiochem. .

Abstract

The development of genetic reporters for magnetic resonance imaging (MRI) is essential for investigating biological functions in vivo. However, current MRI reporters have low sensitivity, making it challenging to create significant contrast against the tissue background, especially when only a small fraction of cells express the reporter. To overcome this limitation, we developed an approach for amplifying the sensitivity of molecular MRI by combining a chemogenetic contrast mechanism with a biophysical approach to increase water diffusion through the co-expression of a dual-gene construct comprising an organic anion transporting polypeptide, Oatp1b3, and a water channel, Aqp1. We first show that the expression of Aqp1 amplifies MRI contrast in cultured cells engineered to express Oatp1b3. We demonstrate that the contrast amplification is caused by Aqp1-driven increase in water exchange, which provides the gadolinium ions internalized by Oatp1b3-expressing cells with access to a larger water pool compared with exchange-limited conditions. We further show that our methodology allows cells to be detected using approximately 10-fold lower concentrations of gadolinium than that in the Aqp1-free scenario. Finally, we show that our approach enables the imaging of mixed-cell cultures containing a low fraction of Oatp1b3-labeled cells that are undetectable on the basis of Oatp1b3 expression alone.

Keywords: MRI; Oatp1; aquaporins; diffusion; reporter genes.


Conflict of interest statement

Conflicts of Interest

There are no conflicts to declare.

Figures

Figure 1:
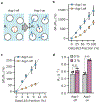
Figure 1:. Aqp1-driven enhancement of T1 relaxation.
(a) Illustration depicting the increase in the baseline T1 relaxation rate (R10) of cells (white circles) due to the expression of Oatp1b3, which promotes the intracellular uptake of Gd-EOB-DTPA (depicted as light brown, filled circles). The baseline T1 relaxation rate (R10) refers to the cellular relaxation rate in the absence of contrast agents. (b) Illustration depicting the increase in the baseline diffusivity of cells (D0) due to expression of Aqp1, which facilitates transmembrane water exchange (depicted by bidirectional blue arrows). (c) Illustration depicting the increase in R1 of Oatp1b3-expressing cells due to co-expression of Aqp1, which permits intracellular Gd-EOB-DTPA to access a larger pool of water molecules via transmembrane exchange. (d) Schematic outline of the T1-VISA mechanism, which incorporates a constitutively expressed reporter gene (Oatp1b3) that promotes the uptake of Gd-EOB-DTPA; and an amplifier gene (Aqp1) that can be induced with doxycycline to enhance diffusivity (Don > Doff) and consequently elevate the T1-relaxation rate of cells relative to conditions where Aqp1 expression is not induced (R1 > R1,Aqp1-off). (e) T1 relaxation rate (R1 = 1/T1) of Oatp1b3-expressing cells in the absence and presence of Aqp1 expression modulated by withholding or adding doxycycline. (f) R1 maps of Oatp1b3-labeled cells in the absence and presence of Aqp1 expression. (g) Schematic representation of genetic construct engineered to co-express Oatp1b3 and Aqp1 as a single transcript. Aqp1 is tagged with a destabilizing domain (DD) derived from FKBP12F36V/L106P, which permits post-translational modulation of Aqp1 concentration by treatment with shield-1, a small-molecule that binds to the DD and stabilizes the Aqp1-FKBP12-DD fusion. (h) R1 of CHO cells stably transduced to express the single-transcript Aqp1-FKBP12-DD construct with and without stabilization of Aqp1 through shield-1 treatment. (i) Increase in the T1 relaxation rate (ΔR1/R1,Aqp1-off) of Oatp1b3-labeled cells as a function of change in diffusivity (ΔD/Doff). To alter diffusivity, cells were treated with varying concentrations of doxycycline in the range of 0.01-1 μg/mL, which induces different levels of Aqp1 expression from the minimal CMV promoter. The dotted line represents a hyperbolic fit to the experimental data and is included to aid in the visual tracking of the trend in ΔR1/R1,Aqp1-off vs. ΔD/Doff. The diffusivity and relaxation measurements were conducted at ambient temperature at a field strength of 7 Tesla. Each MRI measurement was obtained from a 2 mm thick axial section through a pellet formed by centrifuging a suspension of approximately 5 × 10⁶ cells harvested from one confluent 10 cm tissue culture dish, which corresponds to approximately 105 cells per unit voxel (~ 0.4 μL). Error bars represent standard deviation from n ≥ 3 biological replicates. *** P-value < 0.001.
Figure 2:
Figure 2:. Effect of contrast agent concentration on T1 relaxation.
(a) Percentage increase in R1 of Oatp1b3-labeled CHO cells relative to unlabeled cells (ΔR1/R10) as a function of Gd-EOB-DTPA concentration in the presence of Aqp1 expression. The dotted line represents a hyperbolic fit to the experimental data and is included to aid in the visual tracking of the trend in ΔR1/R10 vs. gadolinium. The orange band indicates the 95 % confidence interval of the increase in R1 (ΔR1/R10) obtained without Aqp1 expression following the incubation of cells with 16 mM Gd-EOB-DTPA. The baseline T1 relaxation rate (R10) is the cellular relaxation rate measured in the absence of contrast agents. (b) R1 of Oatp1b3-expressing cells with and without Aqp1 co-expression after incubation with 16 mM or 1.6 mM Gd-EOB-DTPA. Cells were incubated with the indicated Gd-EOB-DTPA concentration for 90 minutes, washed, and prepared for MRI as described in Methods. Diffusivity and relaxation measurements were conducted at ambient temperature at a field strength of 7 Tesla. Each MRI measurement was obtained from a 2 mm thick axial section through a pellet formed by centrifuging a suspension of approximately 5 × 10⁶ cells harvested from one confluent 10 cm tissue culture dish, which corresponds to approximately 105 cells per unit voxel (~ 0.4 μL). Error bars represent the standard deviation from n ≥ 3 biological replicates. In (a), the error bars are smaller than the data markers. n.s. P-value ≥ 0.05.
Figure 3:
Figure 3:. Detection of small fractions of Oatp1b3-labeled cells in mixed populations via Aqp1-driven enhancement in R1.
(a) Illustration depicting a mixed-cell configuration comprising Oatp1b3-labeled cells (dotted circles with internalized Gd-EOB-DTPA labeled as filled light brown circles) and cells lacking Oatp1b3 (white circles). In the Aqp1-on state, all cells uniformly express Aqp1, enabling the amplification of R1 through enhanced water exchange. (b) Percentage increase in R1 (ΔR1/R10) of mixed-cell populations comprising varying fractions (20, 40, 60, 80, and 100 %) of Oatp1b3-labeled cells relative to an identically prepared cell population containing no Oatp1b3-labeled cells. Aqp1 expression was either off or induced by incubating cells with doxycycline. The baseline T1 relaxation rate (R10) is the cellular relaxation rate measured in the absence of contrast agents. The dotted line represents an empirical fit to the experimental data and is included to aid in the visual tracking of the trend in ΔR1 /R10 vs. Oatp1b3-labeled cell fraction. (c) The percentage change in R1 of mixed-cell populations comprising low fractions of Oatp1b3-labeled cells (0-15 %) relative to a cell population containing no Oatp1b3-labeled cells in the presence or absence of Aqp1 expression. The dotted lines represent linear fits to the experimental data and are included to aid in the visual tracking of the functional trend in ΔR1/R10 vs. the Oatp1b3-labeled cell fraction. (d) R1 of mixed-cell populations comprising 3 % Oatp1b3-labeled cells and a population containing no Oatp1b3-labeled cells in the presence and absence of Aqp1 expression. Relaxation measurements were conducted at ambient temperature at 7 Tesla. Each MRI measurement was obtained from a 2 mm thick axial section through a pellet formed by centrifuging a suspension of approximately 5 × 10⁶ cells harvested from one confluent 10 cm tissue culture dish, which corresponds to approximately 105 cells per unit voxel (~ 0.4 μL). Error bars represent the standard deviation from n ≥ 3 biological replicates and are smaller than the data markers in some cases. *** P-value < 0.001; n.s. P-value ≥ 0.05.

Update of

Similar articles

References

    1. Helmchen F, Denk W, Nat Methods 2005, 2, 932–940. - PubMed
    1. Ntziachristos V, Nat Methods 2010, 7, 603–614. - PubMed
    1. Yaghoubi SS, Campbell DO, Radu CG, Czernin J, Theranostics 2012, 2, 374–391. - PMC - PubMed
    1. Minn I, Huss DJ, Ahn H-H, Chinn TM, Park A, Jones J, Brummet M, Rowe SP, Sysa-Shah P, Du Y, Levitsky HI, Pomper MG, Science Advances 2019, 5, eaaw5096. - PMC - PubMed
    1. Sellmyer MA, Richman SA, Lohith K, Hou C, Weng C-C, Mach RH, O’Connor RS, Milone MC, Farwell MD, Molecular Therapy 2020, 28, 42–51. - PMC - PubMed

MeSH terms

Substances