. 2024 Mar;30(3):e14663.
doi: 10.1111/cns.14663.

Mitochondrial ferritin alleviates ferroptosis in a kainic acid-induced mouse epilepsy model by regulating iron homeostasis: Involvement of nuclear factor erythroid 2-related factor 2

Affiliations

Mitochondrial ferritin alleviates ferroptosis in a kainic acid-induced mouse epilepsy model by regulating iron homeostasis: Involvement of nuclear factor erythroid 2-related factor 2

Yu Song et al. CNS Neurosci Ther. 2024 Mar.

Abstract

Background: Epilepsy is a widespread and chronic disease of the central nervous system caused by a variety of factors. Mitochondrial ferritin (FtMt) refers to ferritin located within the mitochondria that may protect neurons against oxidative stress by binding excess free iron ions in the cytoplasm. However, the potential role of FtMt in epilepsy remains unclear. We aimed to investigate whether FtMt and its related mechanisms can regulate epilepsy by modulating ferroptosis.

Methods: Three weeks after injection of adeno-associated virus (AAV) in the skull of adult male C57BL/6 mice, kainic acid (KA) was injected into the hippocampus to induce seizures. Primary hippocampal neurons were transfected with siRNA using a glutamate-mediated epilepsy model. After specific treatments, Western blot analysis, immunofluorescence, EEG recording, transmission electron microscopy, iron staining, silver staining, and Nissl staining were performed.

Results: At different time points after KA injection, the expression of FtMt protein in the hippocampus of mice showed varying degrees of increase. Knockdown of the FtMt gene by AAV resulted in an increase in intracellular free iron levels and a decrease in the function of iron transport-related proteins, promoting neuronal ferroptosis and exacerbating epileptic brain activity in the hippocampus of seizure mice. Additionally, increasing the expression level of FtMt protein was achieved by AAV-mediated upregulation of nuclear factor erythroid 2-related factor 2 (Nrf2) gene in the hippocampus of seizure mice.

Conclusions: In epilepsy, Nrf2 modulates ferroptosis by involving the expression of FtMt and may be a potential therapeutic mechanism of neuronal injury after epilepsy. Targeting this relevant process for treatment may be a therapeutic strategy to prevent epilepsy.

Keywords: Ferroptosis; FtMt; Nrf2; epilepsy; iron homeostasis.


Conflict of interest statement

The authors declare that there is no conflict of interest in the publication of this article.

Figures

FIGURE 1
FIGURE 1
Expression and distribution of Mitochondrial ferritin (FtMt) during epilepsy. (A) The expression of FtMt was detected by western blotting, which showed that FtMt expression increased in epileptic mice on days 3, 7, 14, and 28 compared with the Control group (n = 3 in each group). (B, C) Changes in the expression of FtMt in neurons and its colocalization within neuronal cells in the hippocampal tissue of mice with epilepsy on the 7th day compared with the Control group (n = 5 in each group) (scale bar = 100 μm). (D) Protein expression of heavy chain ferritin (FtH) and light chain ferritin (FtL) was detected by western blotting, which showed that the levels increased in epileptic mice on days 3, 7, 14, and 28 compared with the Control group (n = 3 in each group). All data are depicted with SEM; *p < 0.05, **p < 0.01, ***p < 0.001 versus Control group, ns not significant.
FIGURE 2
FIGURE 2
Ferroptosis occurs during KA‐induced seizures in mice. Western blot analysis of (A) glutathione peroxidase 4 (GPX4) and solute carrier family 7 member 11 (SLC7A11) decreased in epileptic mice compared with the Control group (n = 3 in each group). (B, C) The changes in Nrf2 levels in hippocampal neurons of epileptic mice on the 7th day compared with the Control group as well as its colocalization within neuronal cells (n = 5 in each group) (scale bar = 100 μm). (D–F) The expression levels of prostaglandin‐endoperoxide synthase 2 (Ptgs2) mRNA, glutathione (GSH), and malondialdehyde (MDA) in the hippocampus of epileptic mice at different time points (n = 3 in each group). All data are depicted with SEM; *p < 0.05, **p < 0.01, ***p < 0.001 versus Control group, ns not significant.
FIGURE 3
FIGURE 3
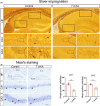
Occurrence of neuronal changes in the mouse model of KA‐induced seizures. (A) Silver staining of hippocampal tissue in the Control group and epileptic mice on the 7th day (scale bar = 100 μm). Arrows point to Nissl‐positive cells synapse. HP stands for hippocampus. (B) Nissl staining of hippocampal tissue in the Control group and epileptic mice on the 7th day (n = 4) (scale bar = 100 μm). Arrows point to Nissl‐positive cells. HP stands for hippocampus. All data are depicted with SEM; **p < 0.01, ***p < 0.001 versus Control group, ns not significant.
FIGURE 4
FIGURE 4
The impact of FtMt on the level of iron‐related transport proteins. (A) After inducing epilepsy, western blot analysis showed that the protein levels of FtMt in the hippocampus were decreased in the FtMt‐AAV‐KD group (n = 3 in each group). (B) Mechanistic diagram of iron ion metabolism. (C) After inducing epilepsy, western blot analysis showed a decrease in the protein levels of transferrin receptor 1 (TfR1), divalent metal transporter 1 (DMT1), and ferroportin 1 (FPN1) in the hippocampus, which was further decreased in the FtMt‐AAV‐KD group. Conversely, the protein levels of FtH and FtL in the hippocampus increased after inducing epilepsy, and FtH and FtL further increased in the FtMt‐AAV‐KD group (n = 3 in each group). (D, E) Perl's staining was used to measure Fe3+ in the hippocampal CA1 and CA3 regions. Fe3+ levels increased in epileptic mice, and the increase was more pronounced in the FtMt‐AAV‐KD group than the Con‐KD group (scale bar = 100 μm) (n = 3 in each group). Arrows point to Fe3+. HP stands for hippocampus. All data are depicted with SEM. *p < 0.05 **p < 0.01, ***p < 0.001, ns not significant.
FIGURE 5
FIGURE 5
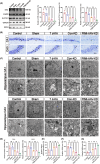
The expression of ferroptosis‐related indicators and neuronal damage in the hippocampal tissue of mice is influenced by FtMt. (A) The protein levels of GPX4, Nrf2, and SLC7A11 in hippocampal cells were decreased after status epilepticus and further decreased in the FtMt‐AAV‐KD group (n = 3 in each group). (B, D) FtMt affects neuronal death after status epilepticus. Representative image of Nissl staining in the hippocampus when seizures in a mouse model of seizures after FtMt knockdown (scale bar = 100 μm) (n = 3 in each group). Arrows point to Nissl‐positive cells. (C) Representative morphological changes to the mitochondria in different groups. Black arrows point to Mitochondrial crest. White arrows point to the Mitochondrial bilayer membrane (scale bar = 1 μm). (E–G) FtMt affects the expression of Ptgs2 mRNA and the levels of GSH and MDA protein in the hippocampal tissue of mice (n = 3 in each group). All data are depicted with SEM. *p < 0.05 **p < 0.01, ***p < 0.001, ns not significant.
FIGURE 6
FIGURE 6
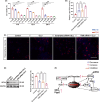
Effects of glutamate on primary mice hippocampal neuronal cells. (A) Glutamate decreases primary mice hippocampal neuronal cell viability in a dose‐ and time‐dependent manner. (B, C) The effects of glutamate intervention on primary mouse hippocampal neurons and the influence of FtMt on their ROS levels (n = 4 in each group) (scale bar = 100 μm). (D) Western blot assay was used to detect the expression of GPX4 (n = 3 in each group). (E) Schematic diagram of metabolism of related ferroptosis pathways. All data are depicted with SEM. *p < 0.05, **p < 0.01, ***p < 0.001, ns not significant.
FIGURE 7
FIGURE 7
Changes in FtMt in the hippocampus of epileptic mice affect their brain electrical activity. (A) Graphical representation of the experimental timeline. (B) Immunofluorescence plots of AAV virus expression (scale bar = 100 μm). (C, D, F, H) Effect of FtMt expression changes in the mouse hippocampus on alpha, theta, beta, delta, and gamma waves (n = 4 in each group). (E, G) Representative image of Nissl staining in the hippocampus when seizures in a mouse model of seizures after FtMt overexpression (scale bar = 100 μm) (n = 3 in each group). Arrows point to Nissl‐positive cells. All data are depicted with SEM. *p < 0.05, **p < 0.01, ***p < 0.001, ns not significant.
FIGURE 8
FIGURE 8
Nrf2 affects the expression of FtMt in the hippocampus of epileptic mice. (A) Schematic diagram of the relationship between Nrf2 and FtMt mechanism. (B) Western blot analysis showed an increase in the protein levels of FtMt in the hippocampus, which further increased in Nrf2‐AAV‐OE group (n = 3 in each group). (C) Immunofluorescence staining revealed an increase in the expression of FtMt in the CA1 and CA3 regions of the hippocampi in epileptic mice, with further enhancement in the Nrf2‐AAV‐OE group (scale bar = 100 μm). All data are depicted with SEM. *p < 0.05, **p < 0.01, ***p < 0.001, ns not significant.

References

    1. Fisher RS, Acevedo C, Arzimanoglou A, et al. ILAE official report: a practical clinical definition of epilepsy. Epilepsia. 2014;55:475‐482. - PubMed
    1. Du K, He M, Zhao D, et al. Mechanism of cell death pathways in status epilepticus and related therapeutic agents. Biomed Pharmacother. 2022;149:112875. - PubMed
    1. Vezzani A, French J, Bartfai T, Baram TZ. The role of inflammation in epilepsy. Nat Rev Neurol. 2011;7:31‐40. - PMC - PubMed
    1. Dixon SJ, Lemberg KM, Lamprecht MR, et al. Ferroptosis: an iron‐dependent form of nonapoptotic cell death. Cell. 2012;149:1060‐1072. - PMC - PubMed
    1. Cai Y, Yang Z. Ferroptosis and its role in epilepsy. Front Cell Neurosci. 2021;15:696889. - PMC - PubMed

Publication types