

Caloric restriction reduces proteinuria in male rats with established nephropathy
- PMID: 38439743
- PMCID: PMC10912948
- DOI: 10.14814/phy2.15942
Caloric restriction reduces proteinuria in male rats with established nephropathy
Abstract
Reducing proteinuria is a crucial approach in preventing kidney function loss. Previous preclinical studies indicated that caloric restriction (CR) imposed at a young age protects against age-related proteinuria. However, these studies have not explored CR in established renal disease. Therefore, this study aimed to investigate the impact of CR on established proteinuria. Rats, aged 12 ± 2 weeks, were administered 2.1 mg/kg of Adriamycin. Six weeks after injection, protein excretion was measured, and a [13 N]ammonia positron emission tomography (PET) scan was conducted to assess kidney perfusion. After 7 weeks rats were divided into four groups: ad libitum (AL) and CR groups fed either a 12% or a 20% protein diet. All groups were treated for 12 weeks. Blood pressure was measured and a second PET scan was acquired at the end of the study. The animals subjected to CR exhibited a 20.3% decrease in protein excretion (p = 0.003) compared to those in the AL groups. Additionally, blood pressure in the CR group was 21.2% lower (p < 0.001) than in the AL groups. While kidney function declined over time in all groups, the 20% CR group demonstrated the smallest decline. Thus CR effectively reduces urinary protein excretion and lowers blood pressure in rats with established proteinuria.
Keywords: 13[N]ammonia PET; caloric restriction; protein excretion; proteinuria.
© 2024 The Authors. Physiological Reports published by Wiley Periodicals LLC on behalf of The Physiological Society and the American Physiological Society.
Conflict of interest statement
The authors declare no conflict of interest.
Figures

 LP‐CR, ■ HP‐AL,
  HP‐CR. Data are presented as mean ± SEM. * p < 0.05, ** p < 0.005.
 LP‐CR, ■ HP‐AL,
  HP‐CR. Data are presented as mean ± SEM. * p < 0.05, ** p < 0.005.
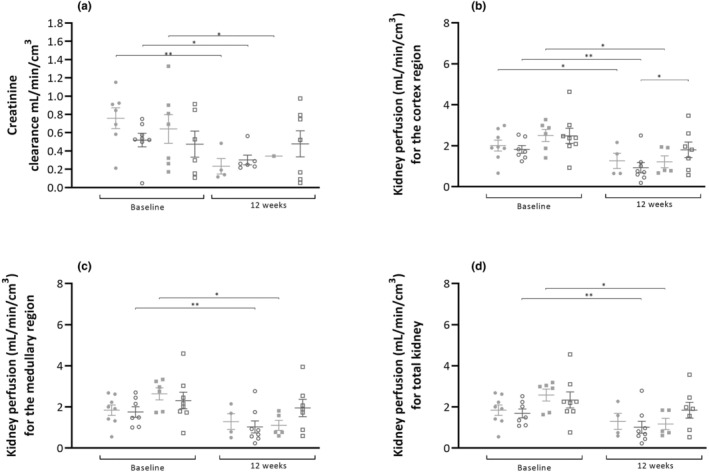
 LP‐CR, ■ HP‐AL,
  HP‐CR. Data are presented as mean ± SEM. * p < 0.05, ** p < 0.005.
 LP‐CR, ■ HP‐AL,
  HP‐CR. Data are presented as mean ± SEM. * p < 0.05, ** p < 0.005.
 LP‐CR, ■ HP‐AL,
  HP‐CR. Data are presented as mean ± SEM. * p < 0.05, ** p < 0.005.
 LP‐CR, ■ HP‐AL,
  HP‐CR. Data are presented as mean ± SEM. * p < 0.05, ** p < 0.005.
References
-
- Almajdub, M. , Magnier, L. , Juillard, L. , & Janier, M. (2008). Kidney volume quantification using contrast‐enhanced in vivo X‐ray micro‐CT in mice. Contrast Media & Molecular Imaging, 3(3), 120–126. - PubMed
-
- Best, T. H. , Franz, D. N. , Gilbert, D. L. , Nelson, D. P. , & Epstein, M. R. (2000). Cardiac complications in pediatric patients on the ketogenic diet. Neurology, 54(12), 2328–2330. - PubMed
-
- Chen, J. , Velalar, C. N. , & Ruan, R. (2008). Identifying the changes in gene profiles regulating the amelioration of age‐related oxidative damages in kidney tissue of rats by the intervention of adult‐onset calorie restriction. Rejuvenation Research, 11(4), 757–763. - PubMed
-
- Davis, T. A. , Bales, C. W. , & Beauchene, R. E. (1983). Differential effects of dietary caloric and protein restriction in the aging rat. Experimental Gerontology, 18(6), 427–435. - PubMed
MeSH terms
Substances
LinkOut - more resources
Full Text Sources
Medical
