. 2024 Feb 23;10(5):e26781.
doi: 10.1016/j.heliyon.2024.e26781. eCollection 2024 Mar 15.

Classification of molecular subtypes for colorectal cancer and development of a prognostic model based on necroptosis-related genes

Affiliations

Classification of molecular subtypes for colorectal cancer and development of a prognostic model based on necroptosis-related genes

Mengling Li et al. Heliyon. .

Abstract

Background: Necroptosis could regulate immunity in cancers, and stratification of colorectal cancer (CRC) subtypes based on key genes related to necroptosis might be a novel strategy for CRC treatment.

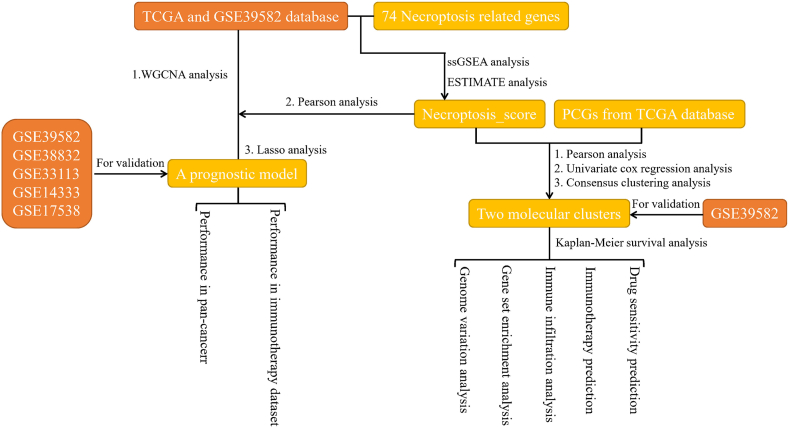
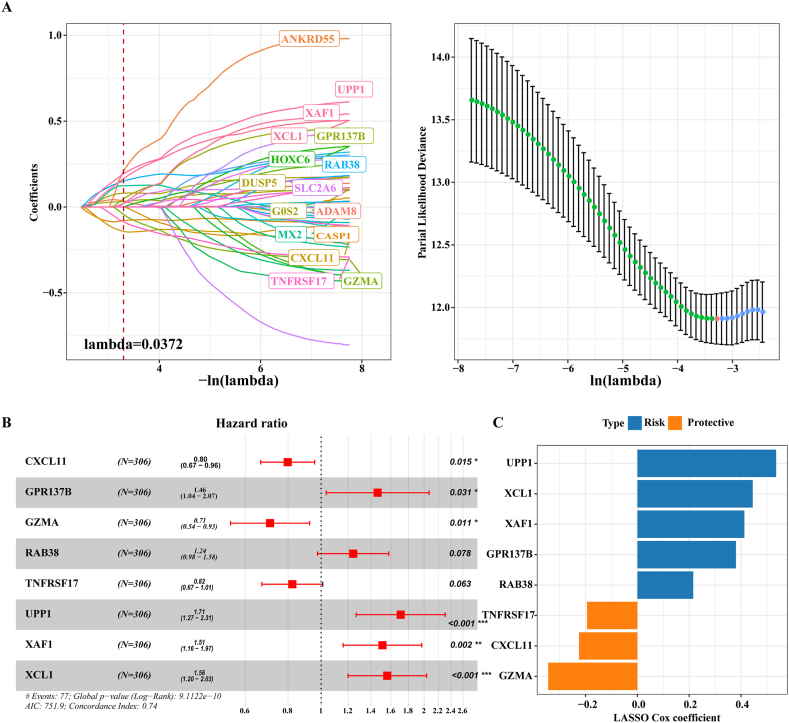
Method: The RNA-sequencing data of CRC and other 31 types of cancers were obtained from The Cancer Genome Atlas (TCGA) database. Consensus clustering was performed based on protein-coding genes (PCGs) related to necroptosis score calculated by single sample gene set enrichment analysis (ssGSEA). Module genes showing a significant positive correlation with the necroptosis score were identified by weighted correlation network analysis (WGCNA) and further used to develop a risk stratification model applying least absolute shrinkage and selection operator (LASSO) and Cox regression analysis. The risks score for each sample in CRC cohorts, immunotherapy cohorts and pan-cancer study cohorts was calculated.

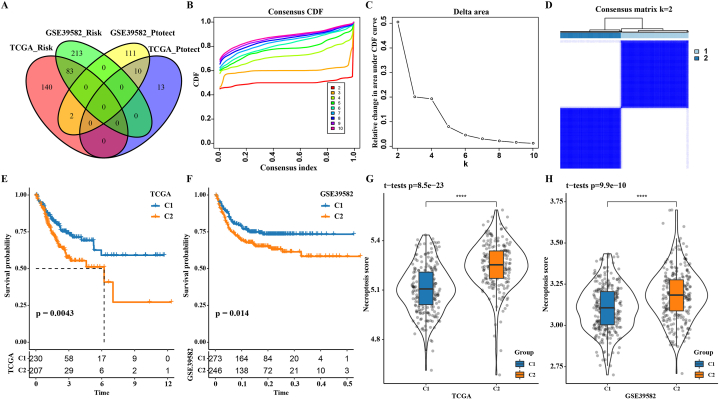
Result: Two subgroups (C1 cluster and C2 cluster) of CRC were identified based on the necroptosis score. Compared with C1 cluster, the survival possibility of C2 cluster was greatly reduced, the levels of necroptosis score, immune cell infiltration, immune score and expression of immune checkpoint molecules were significantly increased and immunotherapy response was less active. Low-risk patients defined by the risk model had a significant survival advantage than high-risk counterparts in both CRC and the other 31 cancer types. Furthermore, the risk model was also more efficient than the Tumor Immune Dysfunction and Exclusion (TIDE) tool in predicting OS and immunotherapy response for the samples in the immunotherapy cohort.

Conclusion: CRC patients were classified by necroptosis score-related PCGs, and a risk model was designed to evaluate the immunotherapy and prognosis of patients with CRC. The current molecular subtype and prognostic model could help stratify patients with different risks and predict their prognosis and immunotherapy sensitivity.

Keywords: Colorectal cancer; Immunotherapy; Molecular subtypes; Necroptosis; Risk stratification tools.


Conflict of interest statement

The authors declare that they have no known competing financial interests or personal relationships that could have appeared to influence the work reported in this paper.

Figures

Fig. 1
Fig. 1
The work flow of the study.
Fig. 2
Fig. 2
The necroptosis score related gene defined two clusters of CRC. A: The intersection of prognostic necroptosis score-related genes in TCGA-COAD and GSE39582 cohorts. B: Cumulative distribution function (CDF) curve with k in the range of 2–10. C: Consensus clustering delta area curve with k in the range of 2–10. D: Consensus matrix for k = 2. E: Prognostic Kaplan-Meier curve of two subgroups in the TCGA-COAD cohort. F: Kaplan-Meier curve involving OS in two subgroups of the GSE39582 cohort. G: Necroptosis score difference between C1 and C2 in the TCGA-COAD cohort. H: Necroptosis score difference between two subgroups in the GSE39582 cohort.
Fig. 3
Fig. 3
GSEA of C1 and C2 in the TCGA-COAD cohort (A) and the GSE39582 cohort (B).
Fig. 4
Fig. 4
Different immune states were detected in the two molecular subtypes. A: Abundances of 10 immune cell infiltration in two different subtypes of the TCGA-COAD cohort. B: The stromal score, immune score and ESTIMATE score of C2 compared to C1. C: The scores of 28 immune cells in two different subtypes of TCGA-COAD cohort. D: The expression of 21 immune checkpoint molecules in two different subtypes of TCGA-COAD cohort.
Fig. 5
Fig. 5
Immune escape and sensitivity to chemotherapy and targeted therapy for two CRC subtypes. A: In the TCGA-COAD cohort, the TIDE score, T cell dysfunction score, T cell exclusion score and the response rate to ICB treatment of C1 and C2. B: The IC50 values of Cisplatin, Sunitinib, Saracatinib, Cyclopamine, Imatinib and Dasatinib in the two subtypes of the TCGA-COAD cohort. C: TIDE score, T cell dysfunction score, T cell exclusion score and response rates to ICB therapy for the two subtypes in the GSE39582 cohort. D: Sensitivity differences in of the two subtypes in the TCGA-COAD cohort to Cisplatin, Sunitinib, Saracatinib, Cyclopamine, Imatinib, and Dasatinib.
Fig. 6
Fig. 6
Shared necroptosis score-related module genes in TCGA-COAD and GSE39582 cohorts. A: Network topology analysis for each soft-thresholding power value in TCGA-COAD cohort. B: Clustering tree of genes in TCGA-COAD cohort. C, D: The heatmap shows the correlation between modules in TCGA-COAD chohort and GSE39582 cohort and necroptosis score, immune score, and stromal score. E: The intersection of genes in the modules with the highest correlation with necroptosis score in the TCGA-COAD cohort and the GSE39582 cohort.
Fig. 7
Fig. 7
Design of risk model. A: Parameter adjustment of variable selection and 10-fold cross-validation in LASSO model. B: Multivariate Cox regression forest map of the 8 most prognostic genes. C: The LASSO regression coefficients of the 8 most prognostic genes.
Fig. 8
Fig. 8
Survival prediction of CRC by risk model in various cohorts, including (A) training cohort, (B) validation cohort, and (C) complete cohort of TCGA-COAD, (D) GSE39582, (E) GSE38832, (F) GSE33113, (G) GSE14333, (H) GSE17538 cohorts.
Fig. 9
Fig. 9
Prognostic analysis of pan-cancer based on risk model.
Fig. 10
Fig. 10
The value of risk model in predicting prognosis and immunotherapy response in immunotherapy cohorts. A: In the IMvigor210 cohort that receiving PD-L1 blocking therapy, the sample survival curve and ROC curve obtained by risk score were used. B: In the IMvigor210 cohort receiving PD-L1 blocking therapy, the sample survival curve and ROC curve obtained by TIDE were used. C: Risk score and TIDE predict the area under the ROC curve of immunotherapy response in the IMvigor210 cohort receiving PD-L1 blocking therapy. D: The Kaplan-Meier curve and ROC curves predicted by risk score to OS in the GSE135222 cohort receiving anti-PD1 therapy. E: TIDE predicts survival Kaplan-Meier curve and ROC curves in the GSE135222 cohort receiving anti-PD-1 therapy. F: Risk score and TIDE predicted the ROC curve of immunotherapy response in the GSE135222 cohort treated with PD-1.

References

    1. Siegel R.L., et al. Cancer statistics, 2022. CA A Cancer J. Clin. 2022;72(1):7–33. - PubMed
    1. Siegel R.L., et al. Colorectal cancer statistics, 2020. CA A Cancer J. Clin. 2020;70(3):145–164. - PubMed
    1. Arnold M., et al. Global patterns and trends in colorectal cancer incidence and mortality. Gut. 2017;66(4):683–691. - PubMed
    1. Sieminska I., Baran J. Myeloid-derived suppressor cells in colorectal cancer. Front. Immunol. 2020;11:1526. - PMC - PubMed
    1. Harada S., Morlote D. Molecular pathology of colorectal cancer. Adv. Anat. Pathol. 2020;27(1):20–26. - PubMed

LinkOut - more resources