. 2024 Feb 29:20:479-496.
doi: 10.3762/bjoc.20.43. eCollection 2024.

Ligand effects, solvent cooperation, and large kinetic solvent deuterium isotope effects in gold(I)-catalyzed intramolecular alkene hydroamination

Affiliations

Ligand effects, solvent cooperation, and large kinetic solvent deuterium isotope effects in gold(I)-catalyzed intramolecular alkene hydroamination

Ruichen Lan et al. Beilstein J Org Chem. .

Abstract

Kinetic studies on the intramolecular hydroamination of protected variants of 2,2-diphenylpent-4-en-1-amine were carried out under a variety of conditions with cationic gold catalysts supported by phosphine ligands. The impact of ligand on gold, protecting group on nitrogen, and solvent and additive on reaction rates was determined. The most effective reactions utilized more Lewis basic ureas, and more electron-withdrawing phosphines. A DCM/alcohol cooperative effect was quantified, and a continuum of isotope effects was measured with low KIE's in the absence of deuterated alcoholic solvent, increasing to large solvent KIE's when comparing reactions in pure MeOH to those in pure MeOH-d4. The effects are interpreted both within the context of a classic gold π-activation/protodeauration mechanism and a general acid-catalyzed mechanism without intermediate gold alkyls.

Keywords: alkene hydroamination; general acid catalysis; gold catalysis; isotope effect; phosphine ligand effect; solvent effect.


Figures

Scheme 1
Scheme 1
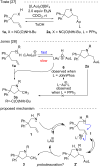
Proposed mechanism and observation of alkylgold intermediates.
Figure 1
Figure 1
First order alkene decay for urea alkene 1a (0.05 M) hydroamination with [JPhosAu(NCCH3)]SbF6 (5, 2.5 mol %) in various solvents.
Figure 2
Figure 2
Cooperative effect of mixed CD2Cl2/MeOH on alkene 1a3a conversion with catalyst 5 (2.5 mol %). Error bars are from linear least squares analysis of raw data plots.
Figure 3
Figure 3
Different additive impact on rate of 1a3a depending upon catalyst and co-solvent. The data for JPhosAu(NCCH3)SbF6 with MeOH in DCM (▲) is reproduced in Figure 2. (The reaction with catalyst 5 and water in MeOH is not shown but displays similar inhibition). Error bars are from linear least squares analysis of raw data plots; where not visible they are smaller than the icon for the data point.
Figure 4
Figure 4
(a) Schematic for synthesis of [L–Au–L]SbF6 where L = JPhos. (b) Perspective drawing of the cation in crystalline [Au(P(C4H9)2(C12H9))2](SbF6)CH2Cl2 where P are represented by dotted spheres, Au atoms are represented by cross-hatched spheres, and carbon and hydrogen atoms are represented by medium and small open spheres, respectively and all nonhydrogen atoms are labeled [43]. (c) 31P NMR spectrum (161.98 MHz, CDCl3).
Figure 5
Figure 5
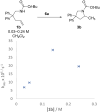
(a) kobs for reaction of urea 1a (0.05 M) in DCM with catalyst 5 and titrated CH3OH/CH3OD. Data for CH3OH reproduced in Figure 2, Table 3. (b) kobs for reaction of carbamate 1b (0.05 M) in DCM with catalyst 5 and titrated CH3OH/CD3OD. Error bars are from linear least squares analysis of raw data plots; where not visible they are smaller than the icon for the data point.
Figure 6
Figure 6
Rate of urea 1a (0.05 M) hydroamination with JPhosAu(NCCH3)SbF6 (2.5 mol %) in CH2Cl2 with 5, 25, and 55 μL of additive; dotted line shows rate in pure CH2Cl2. Numerical observed rates are given in Supporting Information File 1. Error bars are from linear least squares analysis of raw data plots; where not visible they are smaller than the icon for the data point.
Figure 7
Figure 7
Observed rates for the reaction of carbamate 1b (0.03–0.24 M) with JackiephosAuNTf2 (0.0013 M, 6a) in CH2Cl2 to form 3b. Error bars are from linear least squares analysis of raw data plots; where not visible they are smaller than the icon for the data point.
Figure 8
Figure 8
Influence of catalyst 5 concentration on rate of 1a (0.05 M in CH2Cl2 with 0, 10 μL MeOH). Error bars are from linear least squares analysis of raw data plots; where not visible they are smaller than the icon for the data point.
Scheme 2
Scheme 2
Proposed alternate mechanism.

Similar articles

References

    1. Teles J H, Brode S, Chabanas M. Angew Chem, Int Ed. 1998;37:1415–1418. doi: 10.1002/(sici)1521-3773(19980605)37:10<1415::aid-anie1415>3.0.co;2-n. - DOI - PubMed
    1. Kanno O, Kuriyama W, Wang Z J, Toste F D. Angew Chem, Int Ed. 2011;50:9919–9922. doi: 10.1002/anie.201104076. - DOI - PMC - PubMed
    1. Lee S D, Timmerman J C, Widenhoefer R A. Adv Synth Catal. 2014;356:3187–3192. doi: 10.1002/adsc.201400268. - DOI
    1. Zhang Z, Lee S D, Widenhoefer R A. J Am Chem Soc. 2009;131:5372–5373. doi: 10.1021/ja9001162. - DOI - PMC - PubMed
    1. Michon C, Abadie M-A, Medina F, Agbossou-Niedercorn F. J Organomet Chem. 2017;847:13–27. doi: 10.1016/j.jorganchem.2017.03.032. - DOI

LinkOut - more resources