

Urban heat mitigation by green and blue infrastructure: Drivers, effectiveness, and future needs
- PMID: 38440259
- PMCID: PMC10909648
- DOI: 10.1016/j.xinn.2024.100588
Urban heat mitigation by green and blue infrastructure: Drivers, effectiveness, and future needs
Abstract
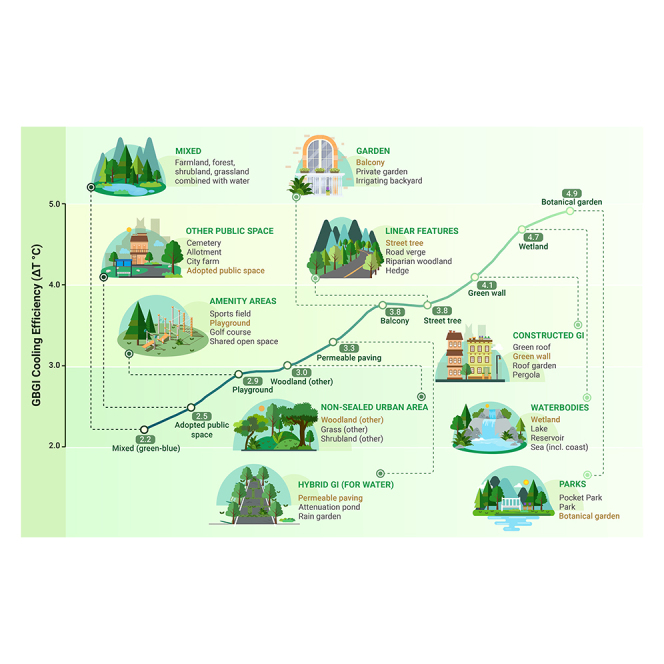
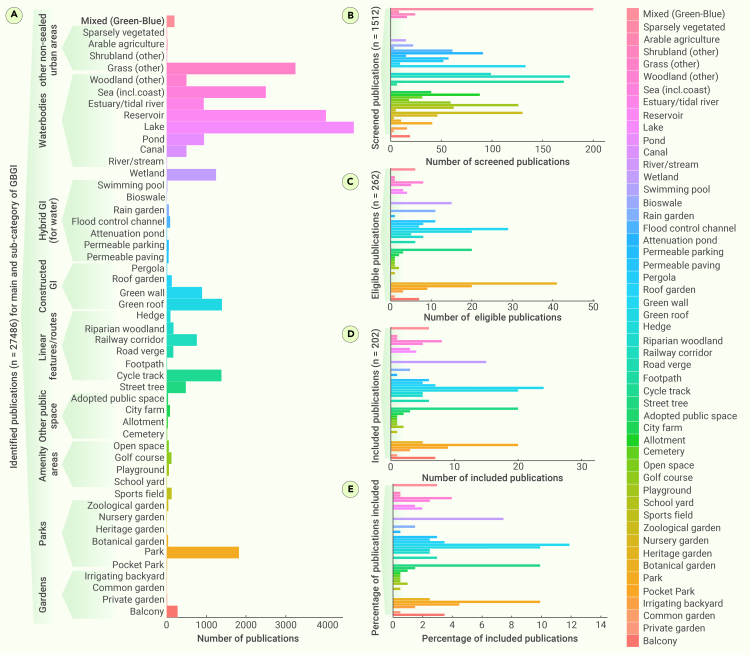
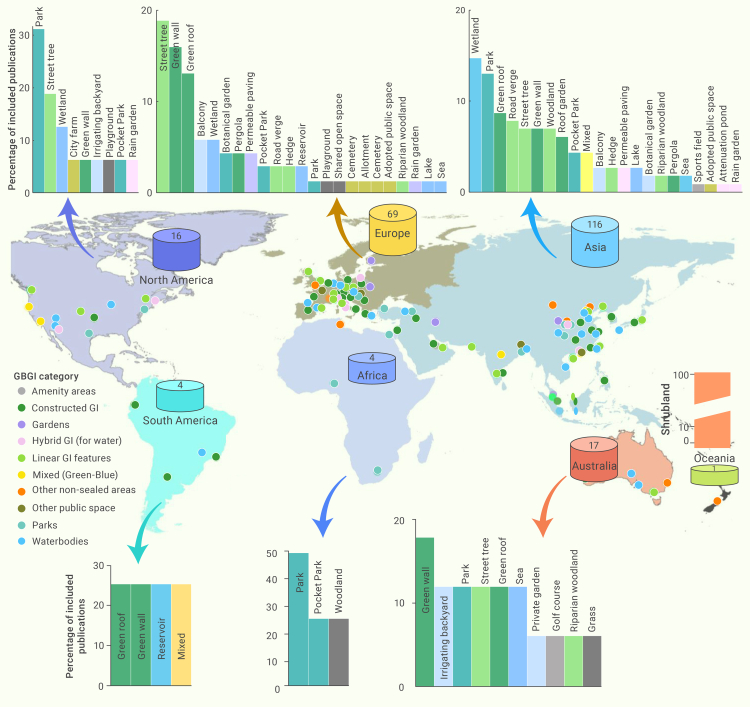
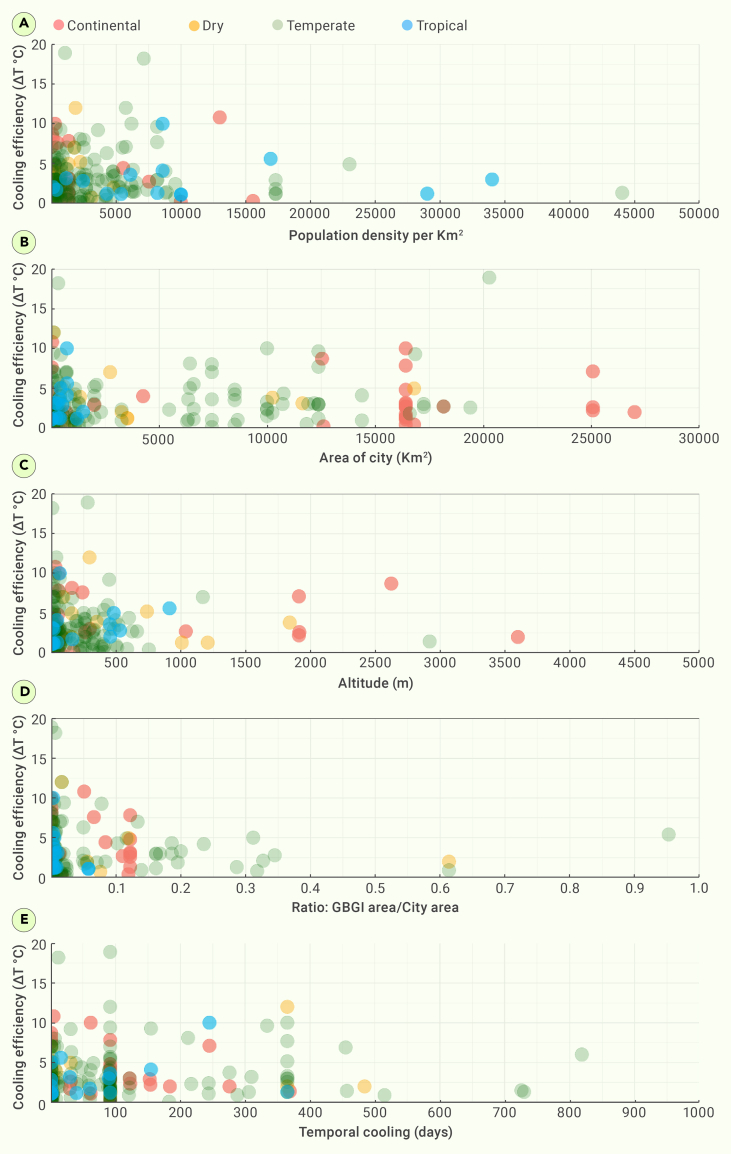
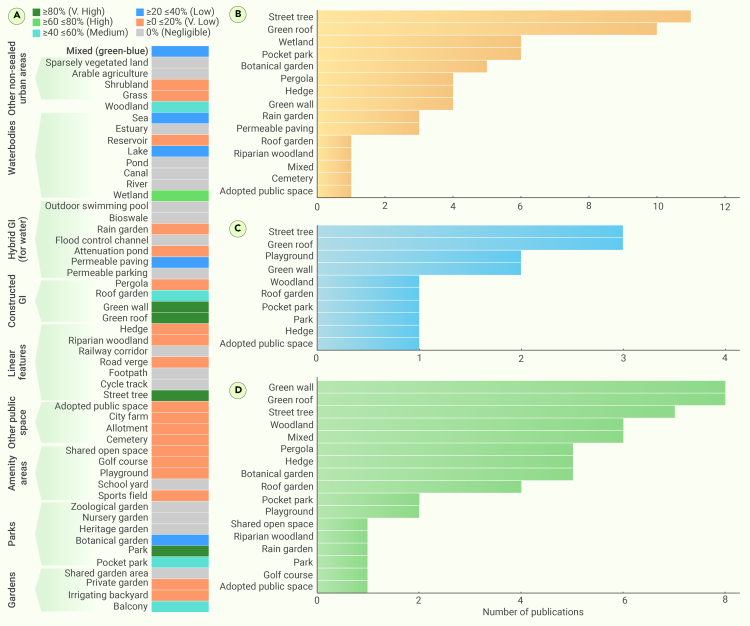
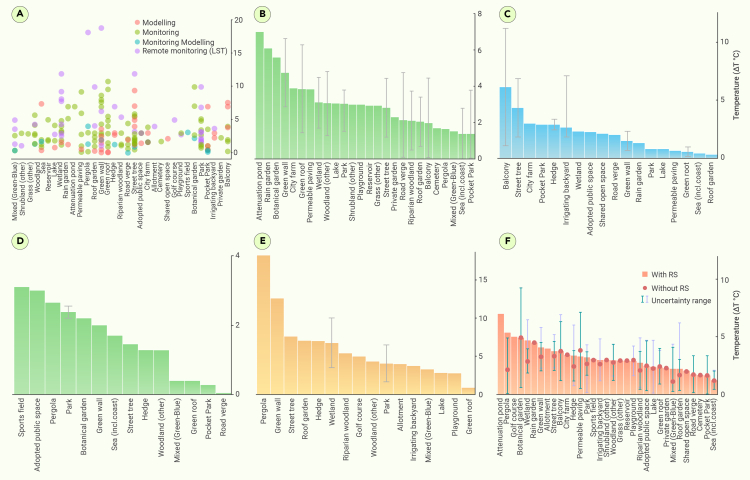
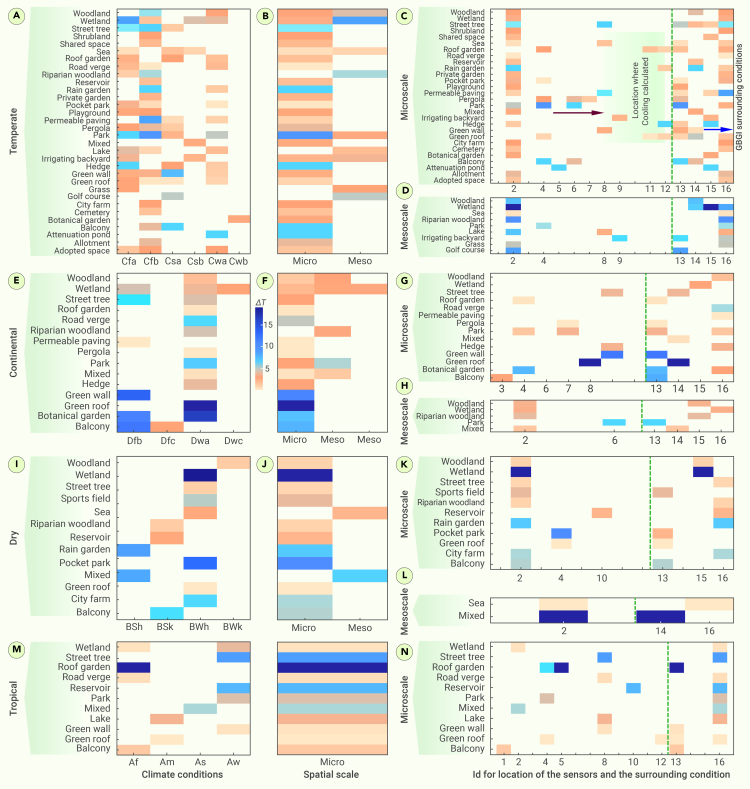
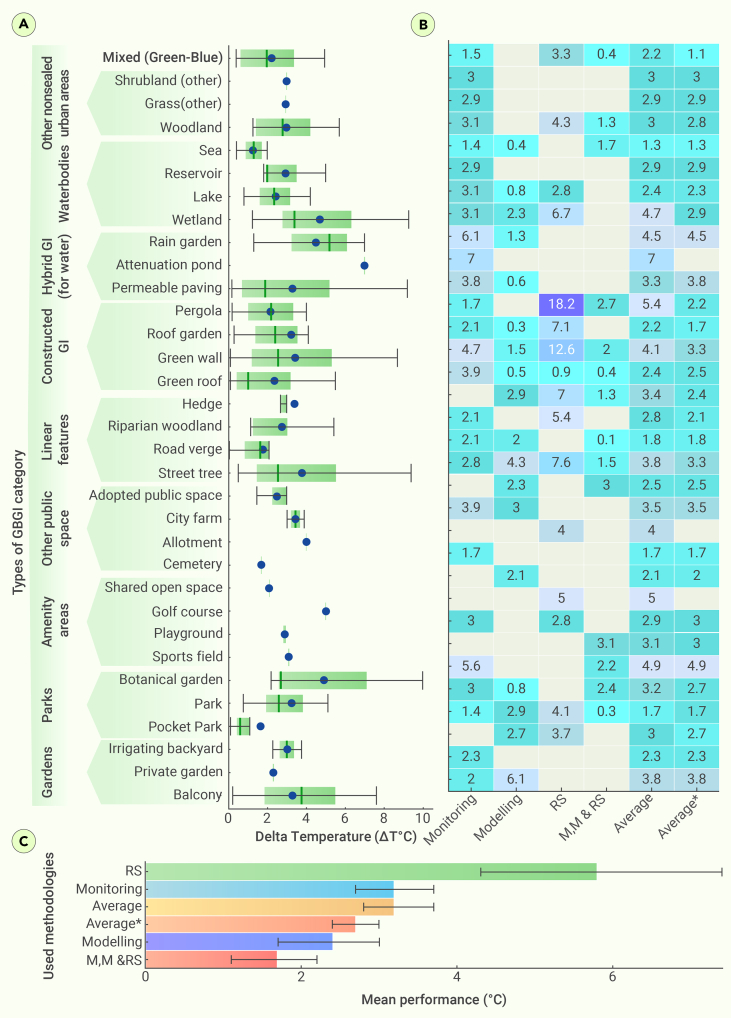
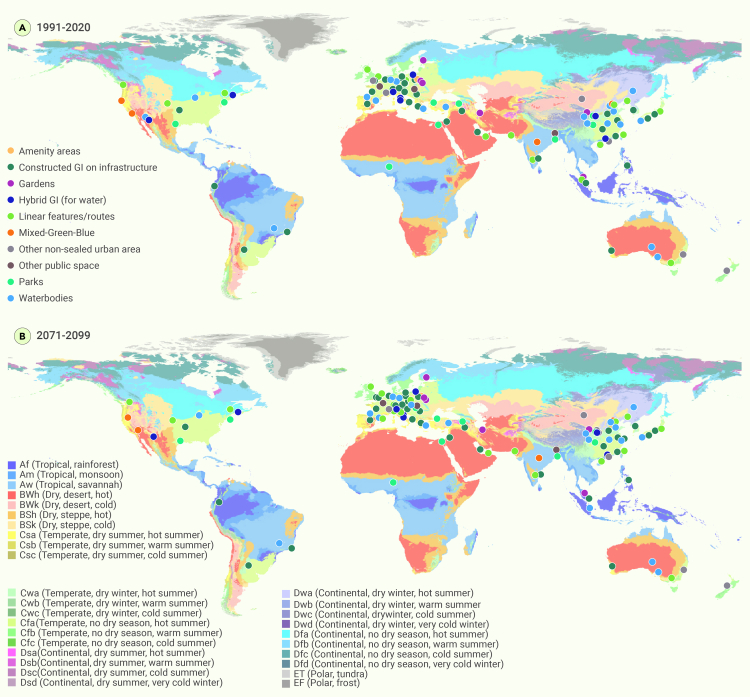
The combination of urbanization and global warming leads to urban overheating and compounds the frequency and intensity of extreme heat events due to climate change. Yet, the risk of urban overheating can be mitigated by urban green-blue-grey infrastructure (GBGI), such as parks, wetlands, and engineered greening, which have the potential to effectively reduce summer air temperatures. Despite many reviews, the evidence bases on quantified GBGI cooling benefits remains partial and the practical recommendations for implementation are unclear. This systematic literature review synthesizes the evidence base for heat mitigation and related co-benefits, identifies knowledge gaps, and proposes recommendations for their implementation to maximize their benefits. After screening 27,486 papers, 202 were reviewed, based on 51 GBGI types categorized under 10 main divisions. Certain GBGI (green walls, parks, street trees) have been well researched for their urban cooling capabilities. However, several other GBGI have received negligible (zoological garden, golf course, estuary) or minimal (private garden, allotment) attention. The most efficient air cooling was observed in botanical gardens (5.0 ± 3.5°C), wetlands (4.9 ± 3.2°C), green walls (4.1 ± 4.2°C), street trees (3.8 ± 3.1°C), and vegetated balconies (3.8 ± 2.7°C). Under changing climate conditions (2070-2100) with consideration of RCP8.5, there is a shift in climate subtypes, either within the same climate zone (e.g., Dfa to Dfb and Cfb to Cfa) or across other climate zones (e.g., Dfb [continental warm-summer humid] to BSk [dry, cold semi-arid] and Cwa [temperate] to Am [tropical]). These shifts may result in lower efficiency for the current GBGI in the future. Given the importance of multiple services, it is crucial to balance their functionality, cooling performance, and other related co-benefits when planning for the future GBGI. This global GBGI heat mitigation inventory can assist policymakers and urban planners in prioritizing effective interventions to reduce the risk of urban overheating, filling research gaps, and promoting community resilience.
Keywords: climate change; heat mitigation; heat stress; nature-based solutions; sustainable development goals; urban cooling.
© 2024 The Author(s).
Conflict of interest statement
The authors declare no competing interests.
Figures
Similar articles
-
Air pollution abatement from Green-Blue-Grey infrastructure.Innov Geosci. 2024 Dec 10;2(4):100100. doi: 10.59717/j.xinn-geo.2024.100100. Innov Geosci. 2024. PMID: 40242400
-
Efficacy assessment of green-blue nature-based solutions against environmental heat mitigation.Environ Int. 2023 Sep;179:108187. doi: 10.1016/j.envint.2023.108187. Epub 2023 Sep 4. Environ Int. 2023. PMID: 37699297
-
Exploring Climate and Air Pollution Mitigating Benefits of Urban Parks in Sao Paulo Through a Pollution Sensor Network.Int J Environ Res Public Health. 2025 Feb 18;22(2):306. doi: 10.3390/ijerph22020306. Int J Environ Res Public Health. 2025. PMID: 40003531 Free PMC article.
-
Review on the cooling potential of green roofs in different climates.Sci Total Environ. 2021 Oct 15;791:148407. doi: 10.1016/j.scitotenv.2021.148407. Epub 2021 Jun 10. Sci Total Environ. 2021. PMID: 34412394 Review.
-
Synergistic control of urban heat island and urban pollution island effects using green infrastructure.J Environ Manage. 2024 Nov;370:122985. doi: 10.1016/j.jenvman.2024.122985. Epub 2024 Oct 25. J Environ Manage. 2024. PMID: 39461153 Review.
Cited by
-
How Systemic Barriers Can Impact Health Inequities When Facing Climate Change Stressors: A Scoping Review of Global Differences.Geohealth. 2025 Jun 18;9(6):e2024GH001272. doi: 10.1029/2024GH001272. eCollection 2025 Jun. Geohealth. 2025. PMID: 40535095 Free PMC article. Review.
-
Global urban greening and its implication for urban heat mitigation.Proc Natl Acad Sci U S A. 2025 Jan 28;122(4):e2417179122. doi: 10.1073/pnas.2417179122. Epub 2025 Jan 21. Proc Natl Acad Sci U S A. 2025. PMID: 39835896 Free PMC article.
-
Air pollution abatement from Green-Blue-Grey infrastructure.Innov Geosci. 2024 Dec 10;2(4):100100. doi: 10.59717/j.xinn-geo.2024.100100. Innov Geosci. 2024. PMID: 40242400
-
Impacts of road development in sub-Saharan Africa: A call for holistic perspectives in research and policy.iScience. 2025 Jan 28;28(2):111913. doi: 10.1016/j.isci.2025.111913. eCollection 2025 Feb 21. iScience. 2025. PMID: 40028288 Free PMC article. Review.
-
Urban Microclimates and Their Relationship with Social Isolation: A Review.Int J Environ Res Public Health. 2025 Jun 6;22(6):909. doi: 10.3390/ijerph22060909. Int J Environ Res Public Health. 2025. PMID: 40566335 Free PMC article. Review.
References
-
- Wang F., Harindintwali J.D., Wei K., et al. Climate change: Strategies for mitigation and adaptation. Innov. Geosci. 2023;1
-
- Sahani J., Kumar P., Debele S., et al. Heat risk of mortality in two different regions of the United Kingdom. Sustain. Cities Soc. 2022;80
-
- Wedler M., Pinto J.G., Hochman A. More frequent, persistent, and deadly heat waves in the 21st century over the Eastern Mediterranean. Sci. Total Environ. 2023;870 - PubMed
Publication types
LinkOut - more resources
Full Text Sources
Miscellaneous
