. 2024 Feb 15:15:1352048.
doi: 10.3389/fendo.2024.1352048. eCollection 2024.

Sex differences and age-related changes in vertebral body volume and volumetric bone mineral density at the thoracolumbar spine using opportunistic QCT

Affiliations

Sex differences and age-related changes in vertebral body volume and volumetric bone mineral density at the thoracolumbar spine using opportunistic QCT

Sebastian Rühling et al. Front Endocrinol (Lausanne). .

Abstract

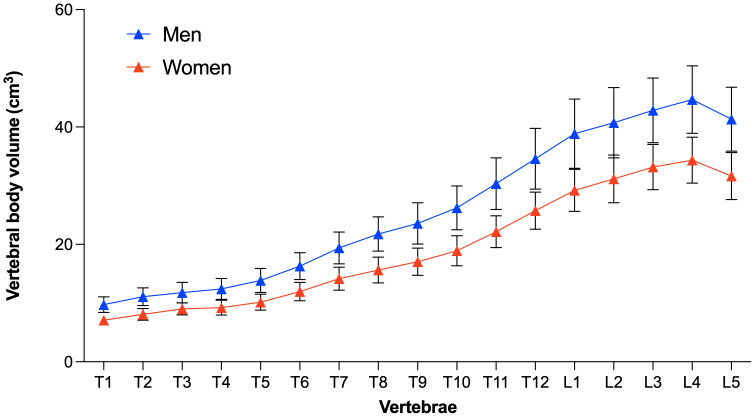
Objectives: To quantitatively investigate the age- and sex-related longitudinal changes in trabecular volumetric bone mineral density (vBMD) and vertebral body volume at the thoracolumbar spine in adults.

Methods: We retrospectively included 168 adults (mean age 58.7 ± 9.8 years, 51 women) who received ≥7 MDCT scans over a period of ≥6.5 years (mean follow-up 9.0 ± 2.1 years) for clinical reasons. Level-wise vBMD and vertebral body volume were extracted from 22720 thoracolumbar vertebrae using a convolutional neural network (CNN)-based framework with asynchronous calibration and correction of the contrast media phase. Human readers conducted semiquantitative assessment of fracture status and bony degenerations.

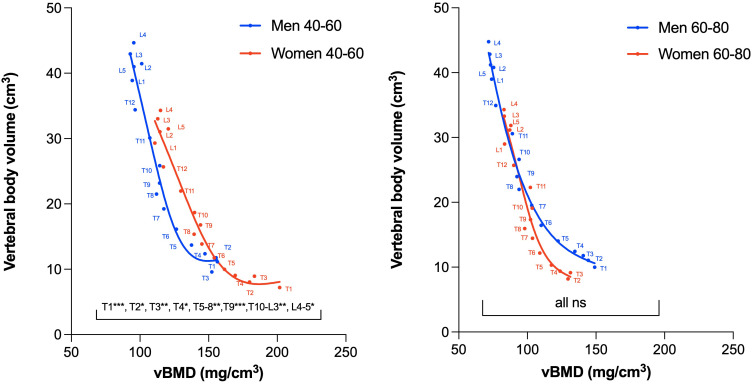
Results: In the 40-60 years age group, women had a significantly higher trabecular vBMD than men at all thoracolumbar levels (p<0.05 to p<0.001). Conversely, men, on average, had larger vertebrae with lower vBMD. This sex difference in vBMD did not persist in the 60-80 years age group. While the lumbar (T12-L5) vBMD slopes in women only showed a non-significant trend of accelerated decline with age, vertebrae T1-11 displayed a distinct pattern, with women demonstrating a significantly accelerated decline compared to men (p<0.01 to p<0.0001). Between baseline and last follow-up examinations, the vertebral body volume slightly increased in women (T1-12: 1.1 ± 1.0 cm3; L1-5: 1.0 ± 1.4 cm3) and men (T1-12: 1.2 ± 1.3 cm3; L1-5: 1.5 ± 1.6 cm3). After excluding vertebrae with bony degenerations, the residual increase was only small in women (T1-12: 0.6 ± 0.6 cm3; L1-5: 0.7 ± 0.7 cm3) and men (T1-12: 0.7 ± 0.6 cm3; L1-5: 1.2 ± 0.8 cm3). In non-degenerated vertebrae, the mean change in volume was <5% of the respective vertebral body volumes.

Conclusion: Sex differences in thoracolumbar vBMD were apparent before menopause, and disappeared after menopause, likely attributable to an accelerated and more profound vBMD decline in women at the thoracic spine. In patients without advanced spine degeneration, the overall volumetric changes in the vertebral body appeared subtle.

Keywords: aging; bone geometry; menopause; opportunistic QCT; osteoporosis; sex-differences; vertebral fractures.


Conflict of interest statement

The authors of this manuscript declare relationships with the following companies: JK, SR, and MH have equity in Bonescreen GmbH. The remaining authors declare that the research was conducted in the absence of any commercial or financial relationships that could be construed as a potential conflict of interest.

Figures

Figure 1
Figure 1
Overview of the automated spine processing pipeline. Exemplary sagittal CT scan of a 67-year-old man that serves as an input scan (A). Labelling and automated segmentation of vertebral bodies (T1-L5) was achieved using a CNN-based framework (B). The initial segmentation was used to create subregion masks of the vertebral body: masks of the cortical bone (green) and masks of the trabecular compartment (light grey). CNN, convolutional neural network; CT, computed tomography.
Figure 2
Figure 2
Relationship between age and vBMD for the lumbar spine (averaged values of L1-3 or L4 and L5) in women (left) and men (right). Data points include all available measurements of the patients over time, with red data points depicting individuals with VFs. Dotted horizontal lines denote the designated QCT cut-off values for osteopenia (<120 mg/cm3) and osteoporosis (<80 mg/cm3), while the areas within the respective ranges are highlighted in yellow (for osteopenia) and light red (for osteoporosis). The black lines illustrate the mean vBMD. Linear regression for women: y=-1.63*x+188.0; and men: y=-1.38*x+165.6. VF, vertebral fracture; QCT, quantitative computed tomography; vBMD, volumetric bone mineral density.
Figure 3
Figure 3
Relationship between level-wise thoracolumbar vBMD and age in a subgroup with pairs matched for sex- and age. T1 is not displayed to improve the readability of this figure. The straight lines (red=women; blue=men) represent linear regressions. The dashed lines represent the 95% CI. Statistically significant differences between the slopes were found at T1-11 levels. vBMD, volumetric bone mineral density; CI, confidence interval.
Figure 4
Figure 4
Plot showing Pearson’s correlation coefficients between vBMD T1 through T12 with respect to the averaged vBMD of L1–L3 before (blue) and after (green) exclusion of vertebrae due to fractures and degenerative changes. vBMD, volumetric bone mineral density.
Figure 5
Figure 5
Level-wise vertebral body volume and trabecular volume at the thoracolumbar spine for both sexes. Data points represent the respective mean.
Figure 6
Figure 6
Level-wise vertebral body volume in women and men. Data points represent the respective mean and standard deviation.
Figure 7
Figure 7
Association between vertebral body volume and vBMD in women and men aged 40-60 years (left) and women and men aged 60-80 years (right). In the 40-60 age group, the vBMD was significantly higher for all vertebral levels in women (red curve), whereas in the 60-80 age group, no significant difference was found for any vertebral level (due to a larger age-dependent vBMD decrease in women compared to men). Note, that the principal relationship between volume and density (i.e., the slope of the presented curves) all show similar trends independent of age groups and sexes. Due to insufficient data points, the T1 level is not shown for women in the 60-80 age group. vBMD, volumetric bone mineral density; ns, non-significant. * p<.05; **p<.01;***p<.001.
Figure 8
Figure 8
Box plots depicting the median in vertebral body volume change (Δ body volume in cm3) for women (A) and men (B) between baseline and last follow-up CT scans for degenerated (dark blue) and non-degenerated vertebrae (light blue). Error bars indicate the minimum and maximum. Exclusion of degenerative vertebrae resulted in a significant reduction of Δ volume change at the thoracic spine in both sexes. CT, computed tomography. **** p<.0001. ns, non-significant.

References

    1. Schousboe JT. Epidemiology of vertebral fractures. J Clin Densitom (2016) 19:8–22. doi: 10.1016/j.jocd.2015.08.004 - DOI - PubMed
    1. Compston JE, McClung MR, Leslie WD. Osteoporosis. Lancet (2019) 393:364–76. doi: 10.1016/S0140-6736(18)32112-3 - DOI - PubMed
    1. Samelson EJ, Hannan MT, Zhang Y, Genant HK, Felson DT, Kiel DP. Incidence and risk factors for vertebral fracture in women and men: 25-Year follow-up results from the population-based Framingham Study. J Bone Miner Res (2006) 21:1207–14. doi: 10.1359/jbmr.060513 - DOI - PubMed
    1. Bouxsein ML, Karasik D. Bone geometry and skeletal fragility. Curr Osteoporos Rep (2006) 4:49–56. doi: 10.1007/s11914-006-0002-9 - DOI - PubMed
    1. Riggs BL, Melton LJ, Robb RA, Camp JJ, Atkinson EJ, Peterson JM, et al. . Population-based study of age and sex differences in bone volumetric density, size, geometry, and structure at different skeletal sites. J Bone Miner Res (2004) 19:1945–54. doi: 10.1359/JBMR.040916 - DOI - PubMed

Publication types

LinkOut - more resources