. 2024 Mar 1;17(3):dmm050511.
doi: 10.1242/dmm.050511. Epub 2024 Mar 5.

Key considerations to improve the normalization, interpretation and reproducibility of morbidity data in mammalian models of viral disease

Affiliations

Key considerations to improve the normalization, interpretation and reproducibility of morbidity data in mammalian models of viral disease

Jessica A Belser et al. Dis Model Mech. .

Abstract

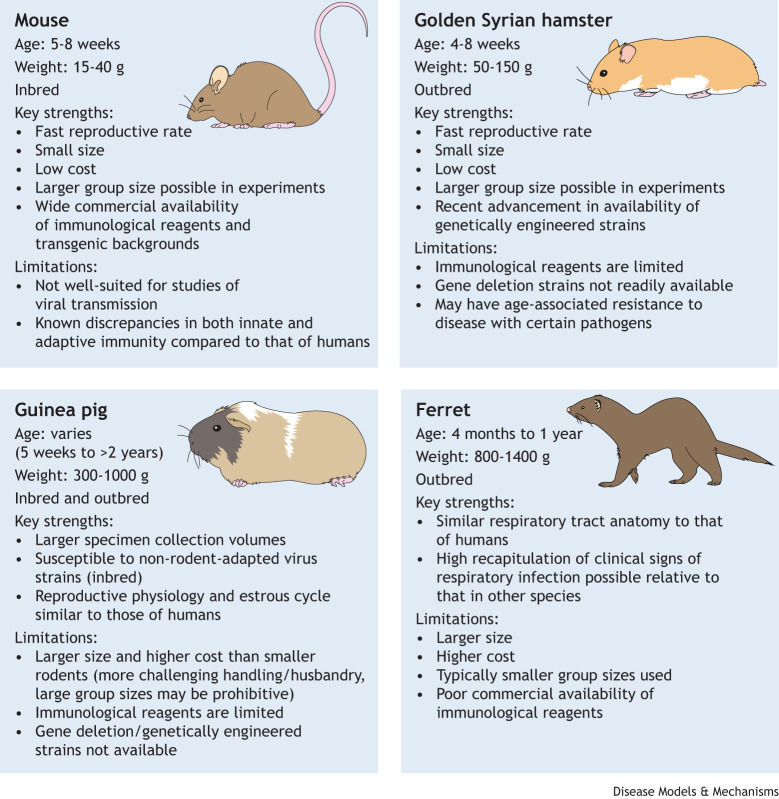
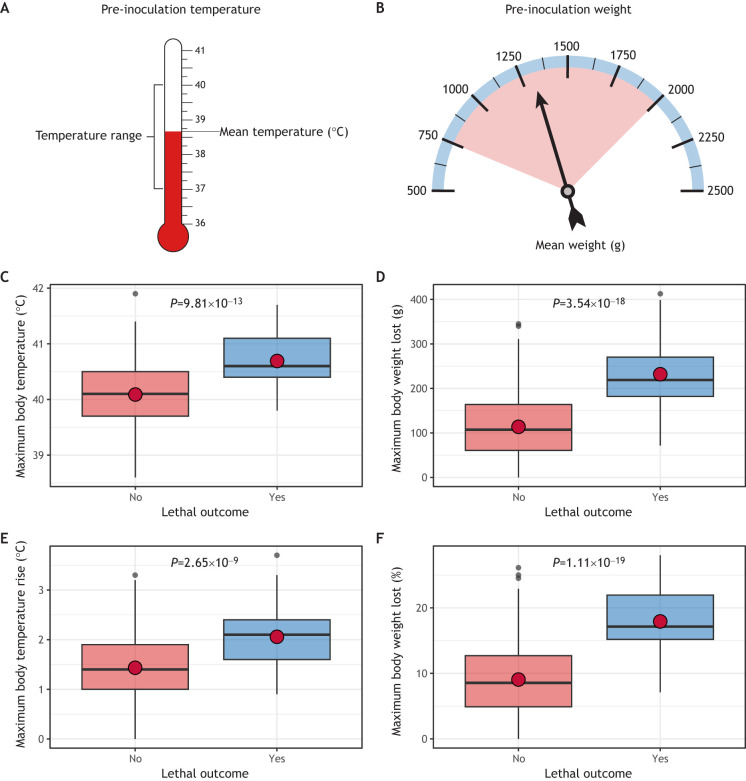
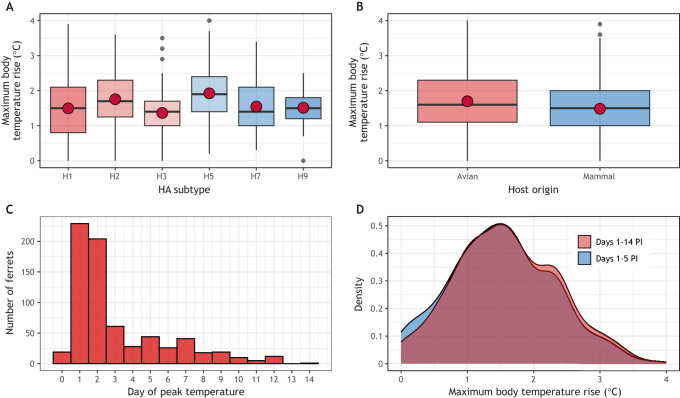
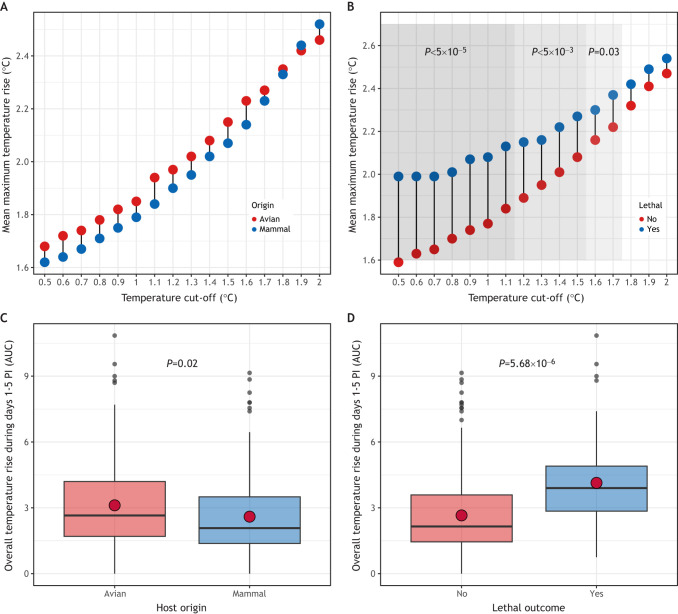
Viral pathogenesis and therapeutic screening studies that utilize small mammalian models rely on the accurate quantification and interpretation of morbidity measurements, such as weight and body temperature, which can vary depending on the model, agent and/or experimental design used. As a result, morbidity-related data are frequently normalized within and across screening studies to aid with their interpretation. However, such data normalization can be performed in a variety of ways, leading to differences in conclusions drawn and making comparisons between studies challenging. Here, we discuss variability in the normalization, interpretation, and presentation of morbidity measurements for four model species frequently used to study a diverse range of human viral pathogens - mice, hamsters, guinea pigs and ferrets. We also analyze findings aggregated from influenza A virus-infected ferrets to contextualize this discussion. We focus on serially collected weight and temperature data to illustrate how the conclusions drawn from this information can vary depending on how raw data are collected, normalized and measured. Taken together, this work supports continued efforts in understanding how normalization affects the interpretation of morbidity data and highlights best practices to improve the interpretation and utility of these findings for extrapolation to public health contexts.

Keywords: Ferret; Pathogenesis; Virus.


Conflict of interest statement

Competing interests The authors declare no competing or financial interests.

Figures

Fig. 1.
Fig. 1.
Comparison of four mammalian models frequently used to study viral pathogens. Mice, golden Syrian hamsters, guinea pigs and ferrets are used in a range of research and public health applications to study viral pathogens (see Table 1), but possess different key strengths and limitations, including but not limited to those depicted here. The typical age and weight at time of use (infection, vaccination, etc.) are shown for each mammalian model, and for guinea pigs, outbred animals are typically used at younger ages, whereas inbred animals are used at wider age range.
Fig. 2.
Fig. 2.
Variability in non-normalized temperature and weight measurements in ferrets used for influenza A virus risk assessment studies. (A,B) Prior to inoculation with virus, ferrets can exhibit substantial variability in pre-inoculation temperature and weight. Among ferrets previously used to study virus pathogenicity of influenza A virus (IAV) (see Box 1 for a description of the data used to conduct these analyses), pre-inoculation baseline temperatures ranged from 37 to 40°C, with a mean temperature of 38.7°C (A) and pre-inoculation baseline weights ranged from 764.4 to 2056 g, with a mean weight of 1275.3 g (B). (C,E) Temperature data for IAV-infected ferrets in which the viral infection did or did not produce a lethal outcome during a 14-day post-inoculation (PI) observation period. The highest recorded temperature (non-normalized data) (C) and the maximum increase in body temperature (normalized data) (E) are shown. (D,F) Weight loss data for IAV-infected ferrets in which the viral infection did or did not produce a lethal outcome during a 14-day PI observation period. Maximum body weight loss in grams from the pre-inoculation baseline (non-normalized data) (D) and maximum percentage weight loss from the pre-inoculation baseline (normalized data) (F) are shown. In box-and-whiskers plots, boxes show the interquartile range, the central line marks the median, the red dot depicts the mean, and whiskers show the upper and lower 25% of values. Significance was determined using a two-tailed unpaired Welch's t-test. n=353 ferrets. See Fig. S1 for a more technical presentation of these analyses. Collectively, these analyses indicate that there is substantial baseline variability in temperature and weight among animals used for risk assessment purposes, with statistically significant differences among peak measurements of both temperature and weight loss independent of data normalization.
Fig. 3.
Fig. 3.
Normalized temperature increases in ferrets infected with influenza A virus. (A,B) Among ferrets previously used to study virus pathogenicity of influenza A virus (IAV) (see Box 1 for a description of the data used to conduct these analyses), data were stratified by the hemagglutinin (HA) subtype of viruses used for inoculation (A) or by the host origin of the inoculating virus (B). The plots show that infection with many different viral subtypes (A) and host origins (B) is capable of eliciting elevated peak temperature readings (>1°C) between days 1 and 14 post inoculation (PI) in ferrets. Median (horizontal lines) and mean (red dots) values were generally similar for each set of aggregated data. Boxes depict the interquartile range and whiskers show the upper and lower 25% of values. See Fig. S2 for a more technical presentation of these analyses. (C) Day of peak temperature reading recorded from days 1 to 14 PI. Peak temperature readings in IAV-inoculated ferrets often occur within the first few days post inoculation. (D) Density plot depicting the overlap between maximum body temperature rise recorded during days 1-14 PI (red) or days 1-5 PI (blue). n=717 ferrets. Collectively, these analyses indicate that a diversity of IAVs both well and poorly adapted to cause mammalian infection are nonetheless capable of eliciting elevated peak temperature readings in ferrets post inoculation, with potential utility in using different gating strategies to define the time range in which peak measurements are collected and reported.
Fig. 4.
Fig. 4.
Analysis of increased body temperature threshold and sustained temperature increases in ferrets infected with influenza A virus. (A,B) Among ferrets previously used to study virus pathogenicity of influenza A virus (IAV) (see Box 1 for a description of the data used to conduct these analyses), data were stratified by the host origin of the virus (A) or whether the inoculating virus was associated with a lethal outcome (B). The mean temperature increase recorded during days 1-5 post inoculation (PI) was analyzed. The x-axis shows the different temperature threshold cut-offs and the y-axis shows the mean peak temperature rise (in °C) greater than or equal to the specified cut-off. The shading represents statistical significance, determined using a two-tailed unpaired Welch's t-test. n=717 ferrets. These graphs show that use of different temperature cut-offs can result in statistically significant differences in mean peak temperature rise across different groups of data, but only when stratified with certain variables (e.g. with lethal outcome but not host origin in the example here). (C,D) Box-and-whiskers plots of the area under the curve (AUC) of temperature increase recorded during days 1-5 PI was analyzed from data stratified by host origin of the virus (C) or whether the inoculating virus was associated with a lethal outcome (D). Boxes show the interquartile range, the central line marks the median, the red dot depicts the mean, and whiskers show the upper and lower 25% of values. Statistical significance was determined using a two-tailed unpaired Welch's t-test in C,D. n=353 ferrets. These graphs indicate that AUC can represent a meaningful way to quantify elevated temperature in serially collected data, with the degree of statistical significance dependent on the variable for which data are stratified. See Fig. S3 for more a more technical presentation of these analyses.
Fig. 5.
Fig. 5.
Normalized weight loss in ferrets infected with influenza A virus. (A,B) Among ferrets previously used to study virus pathogenicity of influenza A virus (IAV) (see Box 1 for a description of the data used to conduct these analyses), data were stratified by the hemagglutinin (HA) subtype of the virus used for inoculation (A) or by the host origin of the inoculating virus (B). The plots show that infection with many different viral subtypes (A) and host origins (B) can be associated with varying degrees of maximum body weight loss (expressed as a percentage of pre-inoculation body weight) between days 1-14 post inoculation (PI) in ferrets. Median (horizontal lines) and mean (red dots) values were generally similar for each set of aggregated data. Boxes depict the interquartile range and whiskers show the upper and lower 25% of values. (C) The day of maximum weight loss percentage detected occurred between days 1 and 14 PI. (D) Among ferrets with a lethal outcome following IAV infection, there was a statistically significant linear correlation between the day of maximum weight loss observed and the maximum body weight lost. Dots represent individual ferrets that have been categorized into low, medium or high levels of weight loss. (E,F) Box-and-whiskers plots of the area under the curve (AUC) of maximum body weight loss recorded during days 1-3 PI from data stratified by host origin of the virus (E) or whether the inoculating virus was associated with a lethal outcome (F). Statistical significance in F was determined using a two-tailed unpaired Welch's t-test in D,F. n=717 ferrets (A-D) or 353 ferrets (E,F). These graphs support that AUC can represent a meaningful way to quantify weight loss detection in serially collected data, with the degree of statistical significance dependent on the variable for which data is stratified. See Fig. S4 for more a more technical presentation of these analyses. Collectively, these data indicate that trends in normalized weight loss data can be observed in ferrets post inoculation with a diverse range of IAVs, from both peak recorded values and from serially collected datapoints. However, the way in which data are stratified can reveal trends in data not uniformly present among all variables.

Similar articles

Cited by

References

    1. Atkins, C., Miao, J., Kalveram, B., Juelich, T., Smith, J. K., Perez, D., Zhang, L., Westover, J. L. B., Van Wettere, A. J., Gowen, B. B.et al. (2018). Natural history and pathogenesis of wild-type Marburg virus infection in STAT2 knockout hamsters. J. Infect. Dis. 218, S438-S447. 10.1093/infdis/jiy457 - DOI - PMC - PubMed
    1. Balls, M. and Straughan, D. W. (1996). The three Rs of Russell & Burch and the testing of biological products. Dev. Biol. Stand. 86, 11-18. - PubMed
    1. Belser, J. A., Eckert, A. M., Tumpey, T. M. and Maines, T. R. (2016). Complexities in ferret influenza virus pathogenesis and transmission models. Microbiol. Mol. Biol. Rev. 80, 733-744. 10.1128/MMBR.00022-16 - DOI - PMC - PubMed
    1. Belser, J. A., Johnson, A., Pulit-Penaloza, J. A., Pappas, C., Pearce, M. B., Tzeng, W. P., Hossain, M. J., Ridenour, C., Wang, L., Chen, L. M.et al. (2017). Pathogenicity testing of influenza candidate vaccine viruses in the ferret model. Virology 511, 135-141. 10.1016/j.virol.2017.08.024 - DOI - PMC - PubMed
    1. Belser, J. A., Pulit-Penaloza, J. A. and Maines, T. R. (2020). Ferreting out influenza virus pathogenicity and transmissibility: past and future risk assessments in the ferret model. Cold Spring Harb. Perspect. Med. 10, a038323. 10.1101/cshperspect.a038323 - DOI - PMC - PubMed

Grants and funding