

Taxonomic and metabolic development of the human gut microbiome across life stages: a worldwide metagenomic investigation
- PMID: 38441032
- PMCID: PMC11019788
- DOI: 10.1128/msystems.01294-23
Taxonomic and metabolic development of the human gut microbiome across life stages: a worldwide metagenomic investigation
Abstract
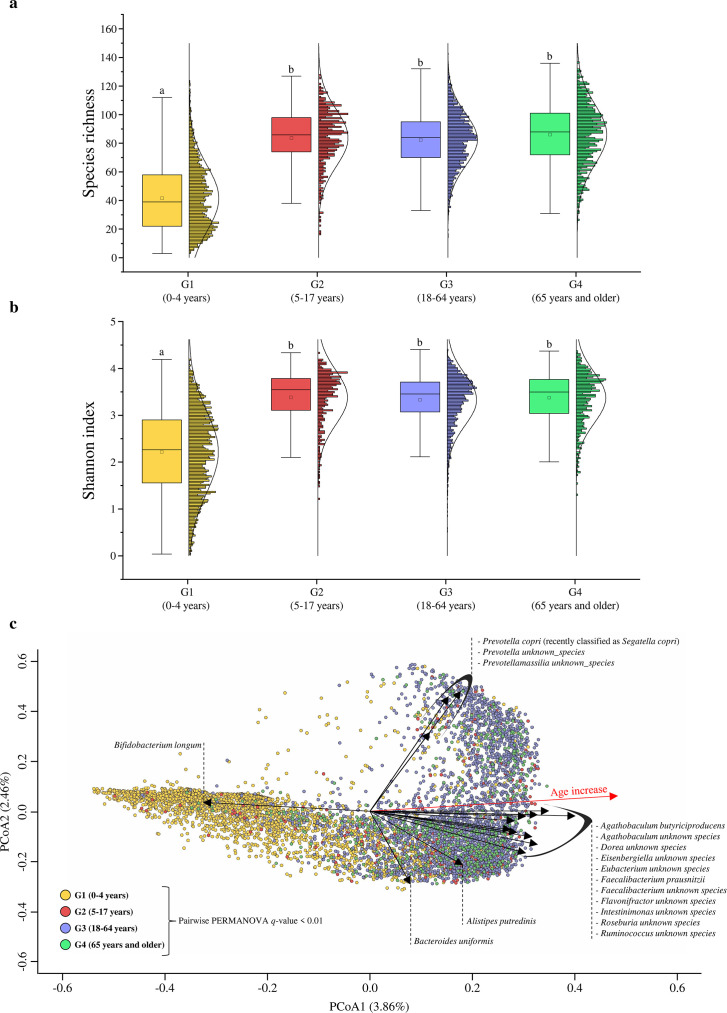
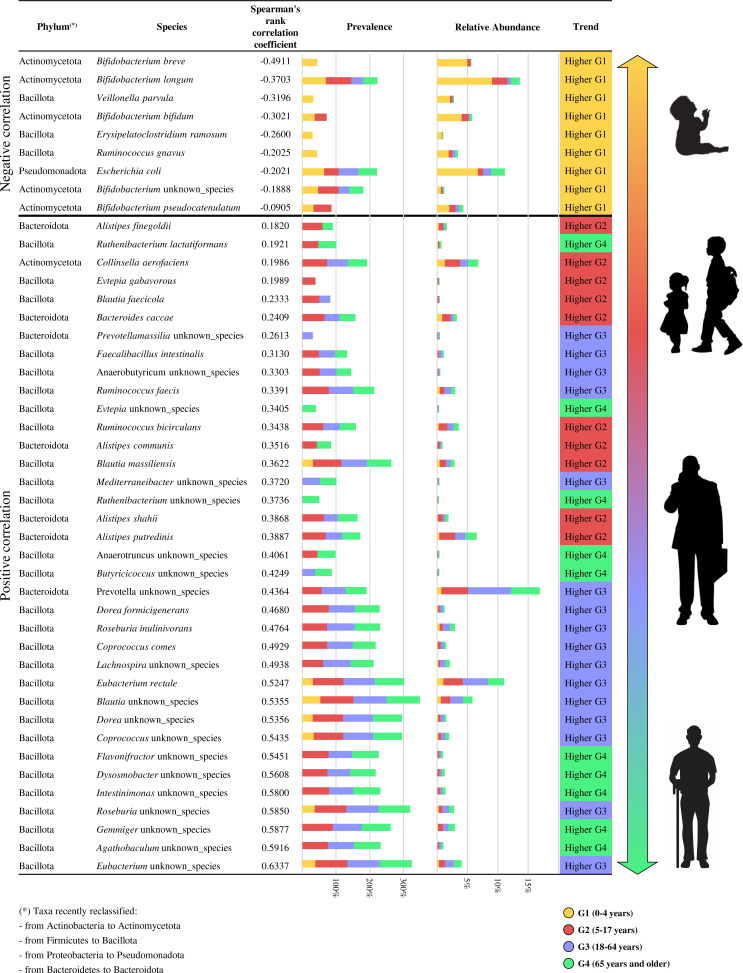
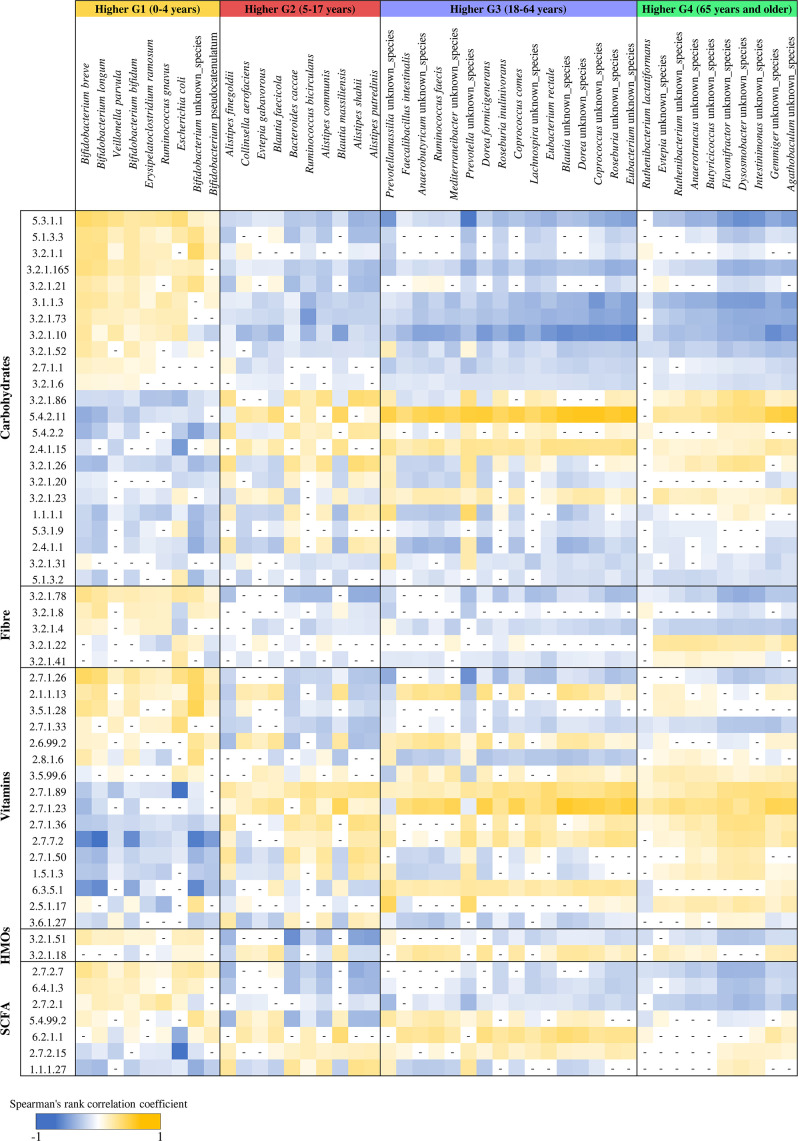
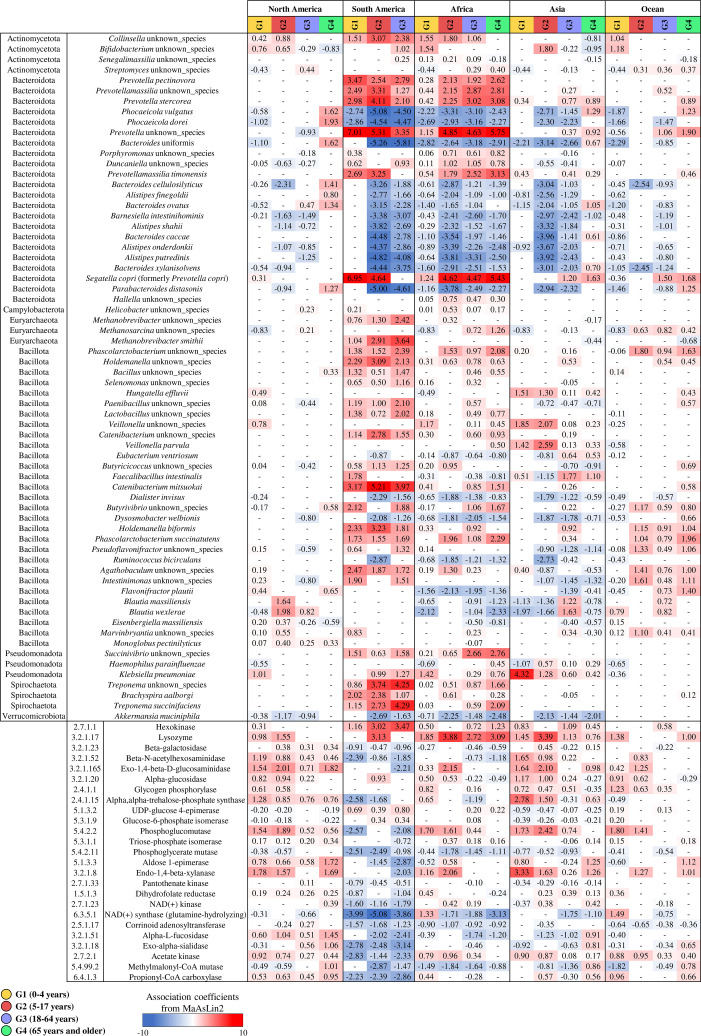
The human gut microbiota is a dynamic community of microorganisms that undergo variable changes over the entire life span. To thoroughly investigate the possible fluctuations of the microbiota throughout human life, we performed a pooled analysis of healthy fecal samples across different age groups covering the entire human life span. Our study integrated data from 79 publicly available studies and new stool samples from an Italian cohort, i.e., the Parma Microbiota project, resulting in 6,653 samples processed through the shotgun metagenomic approach. This approach has allowed species-level taxonomic reconstruction of the gut microbiota and investigation of its metabolic potential across the human life span. From a taxonomic point of view, our findings confirmed and detailed at species-level accuracy that the microbial richness of the gut microbiota gradually increases in the first stage of life, becoming relatively stable during adolescence. Moreover, the analysis identified the potential core microbiota representative of distinct age groups, revealing age-related bacterial patterns and the continuous rearrangement of the microbiota in terms of relative abundances across the life span rather than the acquisition and loss of taxa. Furthermore, the shotgun approach provided insights into the functional contribution of the human gut microbiome. The metagenomic analysis revealed functional age-related differences, particularly in carbohydrate and fiber metabolism, suggesting a co-evolution of the microbiome assembly with diet. Additionally, we identified correlations between vitamin synthesis, such as thiamine and niacin, and early life, suggesting a potential role of the microbiome in human physiology, in particular in the functions of the host's nervous and immune systems.
Importance: In this study, we provided comprehensive insights into the dynamic nature of the human gut microbiota across the human life span. In detail, we analyzed a large data set based on a shotgun metagenomic approach, combining public data sets and new samples from the Parma Microbiota project and obtaining a detailed overview of the possible relationship between gut microbiota development and aging. Our findings confirmed the main stages in microbial richness development and revealed specific core microbiota associated with different age stages. Moreover, the shotgun metagenomic approach allowed the disentangling of the functional changes in the microbiome across the human life span, particularly in diet-related metabolism, which is probably correlated to bacterial co-evolution with dietary habits. Notably, our study also uncovered positive correlations with vitamin synthesis in early life, suggesting a possible impact of the microbiota on human physiology.
Keywords: human gut microbiome; human life span; human microbiota; shotgun metagenomics.
Conflict of interest statement
The authors declare no conflict of interest.
Figures
Similar articles
-
Vitamin biosynthesis in the gut: interplay between mammalian host and its resident microbiota.Microbiol Mol Biol Rev. 2025 Jun 25;89(2):e0018423. doi: 10.1128/mmbr.00184-23. Epub 2025 Apr 2. Microbiol Mol Biol Rev. 2025. PMID: 40172109 Review.
-
Integrated multi-omics analysis reveals the functional signature of microbes and metabolomics in pre-diabetes individuals.Microbiol Spectr. 2025 Jul;13(7):e0145924. doi: 10.1128/spectrum.01459-24. Epub 2025 Jun 9. Microbiol Spectr. 2025. PMID: 40488467 Free PMC article.
-
Metagenomic and phylogenetic analyses reveal gene-level selection constrained by bacterial phylogeny, surrounding oxalate metabolism in the gut microbiota.mSphere. 2025 Jun 25;10(6):e0091324. doi: 10.1128/msphere.00913-24. Epub 2025 May 13. mSphere. 2025. PMID: 40358144 Free PMC article.
-
Metaproteomics Reveals Community Coalescence Outcomes in Co-Cultured Human Gut Microbiota.Proteomics. 2025 Jul 26:e70009. doi: 10.1002/pmic.70009. Online ahead of print. Proteomics. 2025. PMID: 40713811
-
Effects of Probiotics on Preterm Infant Gut Microbiota Across Populations: A Systematic Review and Meta-Analysis.Adv Nutr. 2024 Jun;15(6):100233. doi: 10.1016/j.advnut.2024.100233. Epub 2024 May 20. Adv Nutr. 2024. PMID: 38908894 Free PMC article.
Cited by
-
Age-stratification reveals age-specific intestinal microbiota signatures in juvenile idiopathic arthritis.Mol Cell Pediatr. 2024 Dec 10;11(1):12. doi: 10.1186/s40348-024-00186-6. Mol Cell Pediatr. 2024. PMID: 39653980 Free PMC article.
-
Vitamin biosynthesis in the gut: interplay between mammalian host and its resident microbiota.Microbiol Mol Biol Rev. 2025 Jun 25;89(2):e0018423. doi: 10.1128/mmbr.00184-23. Epub 2025 Apr 2. Microbiol Mol Biol Rev. 2025. PMID: 40172109 Review.
-
Gut microbiome and bone health: update on mechanisms, clinical correlations, and possible treatment strategies.Osteoporos Int. 2025 Feb;36(2):167-191. doi: 10.1007/s00198-024-07320-0. Epub 2024 Dec 7. Osteoporos Int. 2025. PMID: 39643654
-
Association of niacin intake and metabolic dysfunction-associated steatotic liver disease: findings from National Health and Nutrition Examination Survey.BMC Public Health. 2024 Oct 8;24(1):2742. doi: 10.1186/s12889-024-20161-0. BMC Public Health. 2024. PMID: 39379884 Free PMC article.
-
Effects of bacteriophages on gut microbiome functionality.Gut Microbes. 2025 Dec;17(1):2481178. doi: 10.1080/19490976.2025.2481178. Epub 2025 Mar 31. Gut Microbes. 2025. PMID: 40160174 Free PMC article. Review.
References
-
- Milani C, Duranti S, Bottacini F, Casey E, Turroni F, Mahony J, Belzer C, Delgado Palacio S, Arboleya Montes S, Mancabelli L, Lugli GA, Rodriguez JM, Bode L, de Vos W, Gueimonde M, Margolles A, van Sinderen D, Ventura M. 2017. The first microbial colonizers of the human gut: composition, activities, and health implications of the infant gut microbiota.. Microbiol Mol Biol Rev 81:e00036-17. doi:10.1128/MMBR.00036-17 - DOI - PMC - PubMed
MeSH terms
Substances
Grants and funding
LinkOut - more resources
Full Text Sources
