. 2024 Apr;33(7):e17314.
doi: 10.1111/mec.17314. Epub 2024 Mar 5.

An inquiline mosquito modulates microbial diversity and function in an aquatic microecosystem

Affiliations

An inquiline mosquito modulates microbial diversity and function in an aquatic microecosystem

Aldo A Arellano et al. Mol Ecol. 2024 Apr.

Abstract

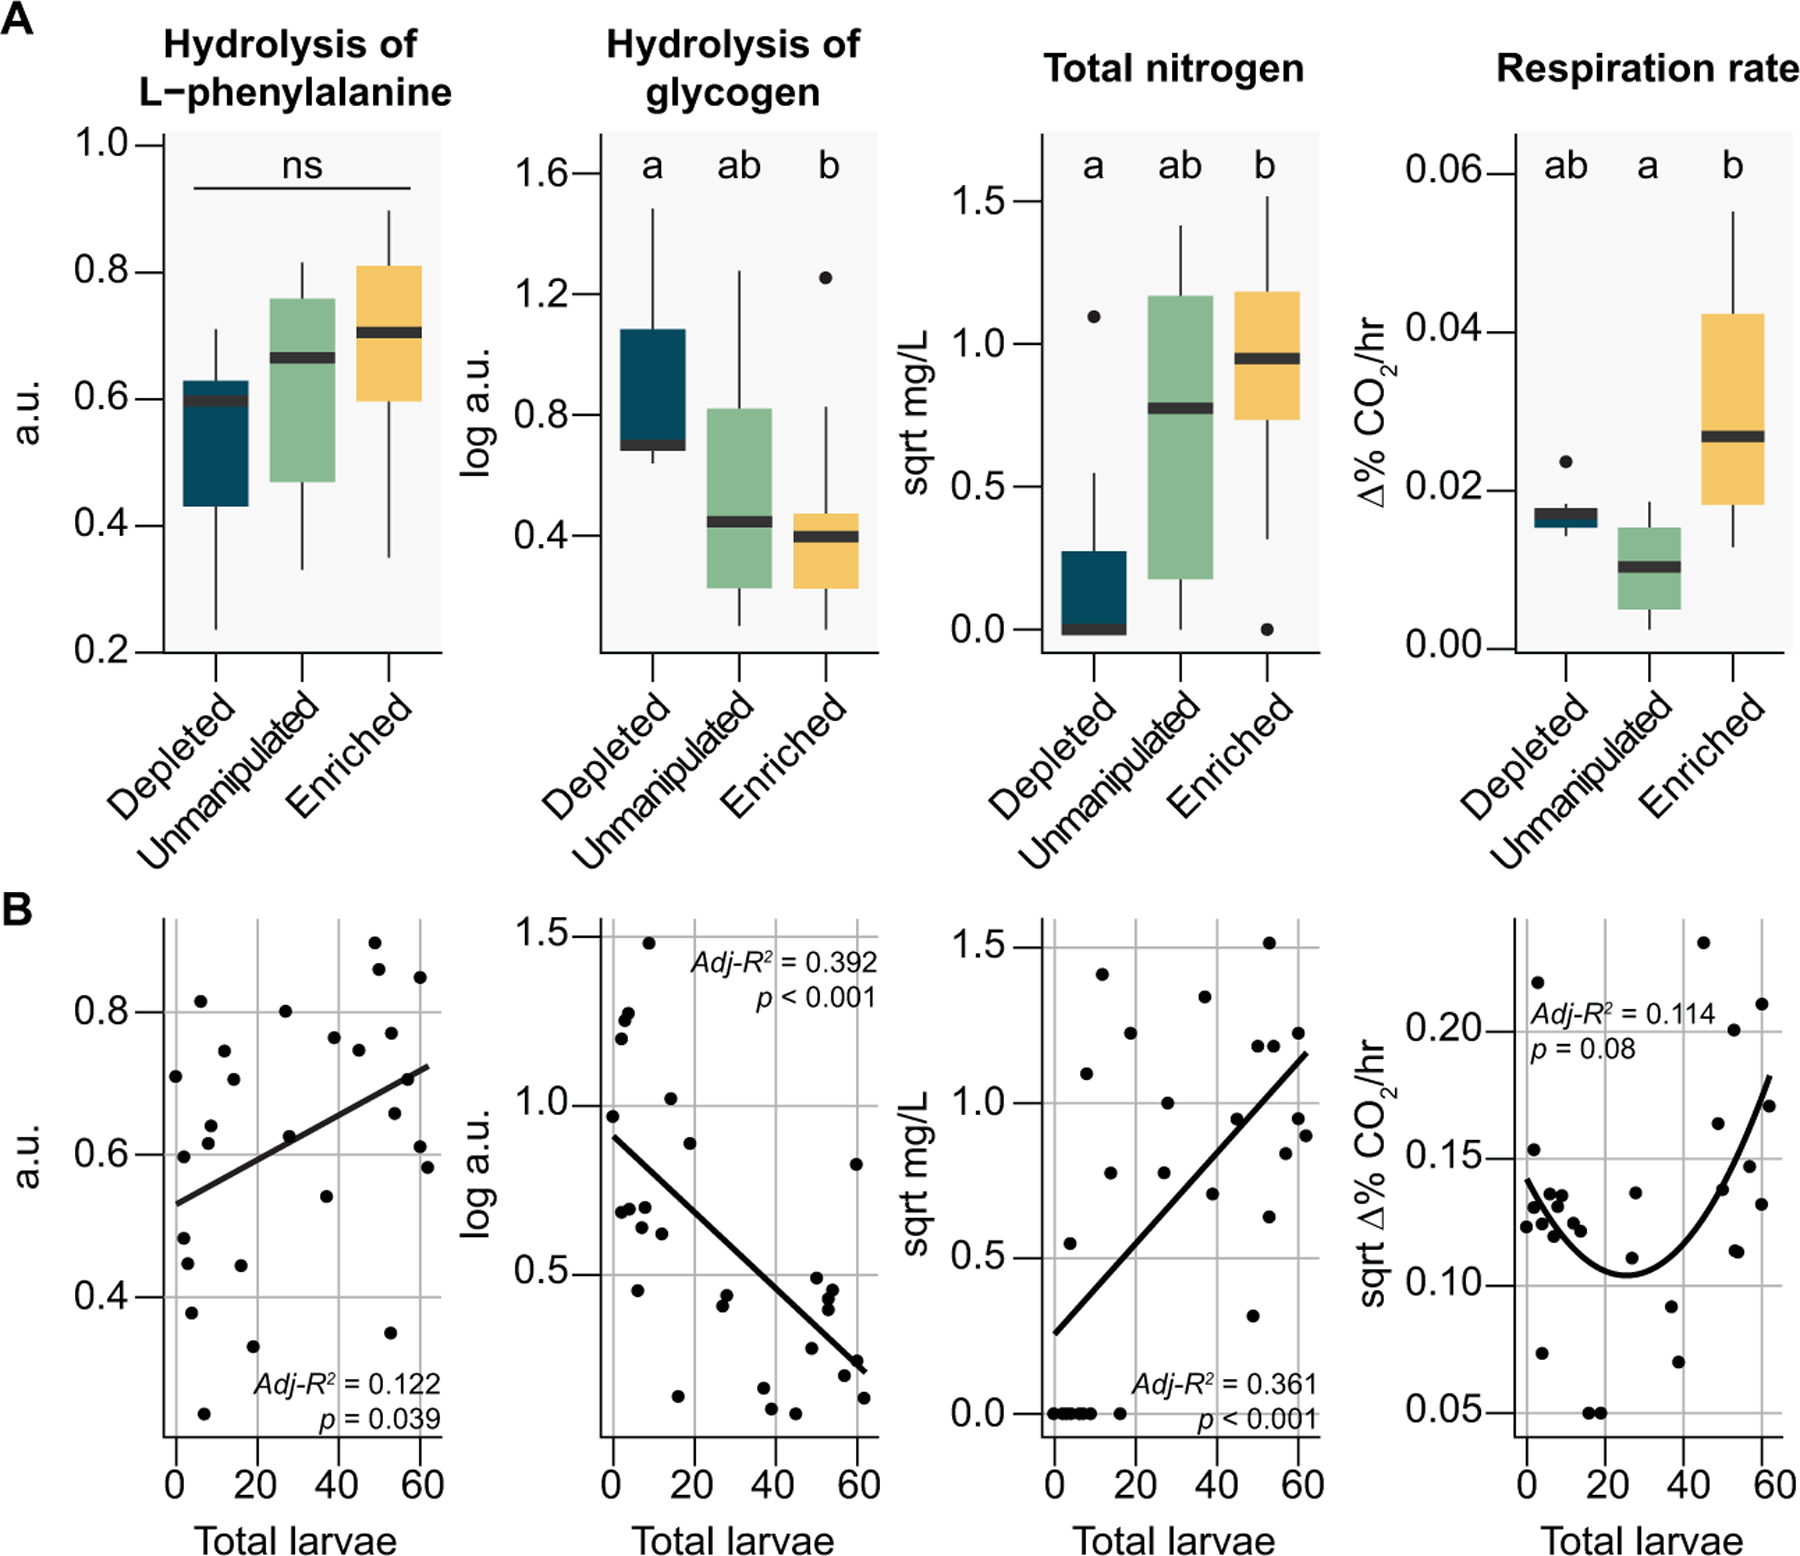
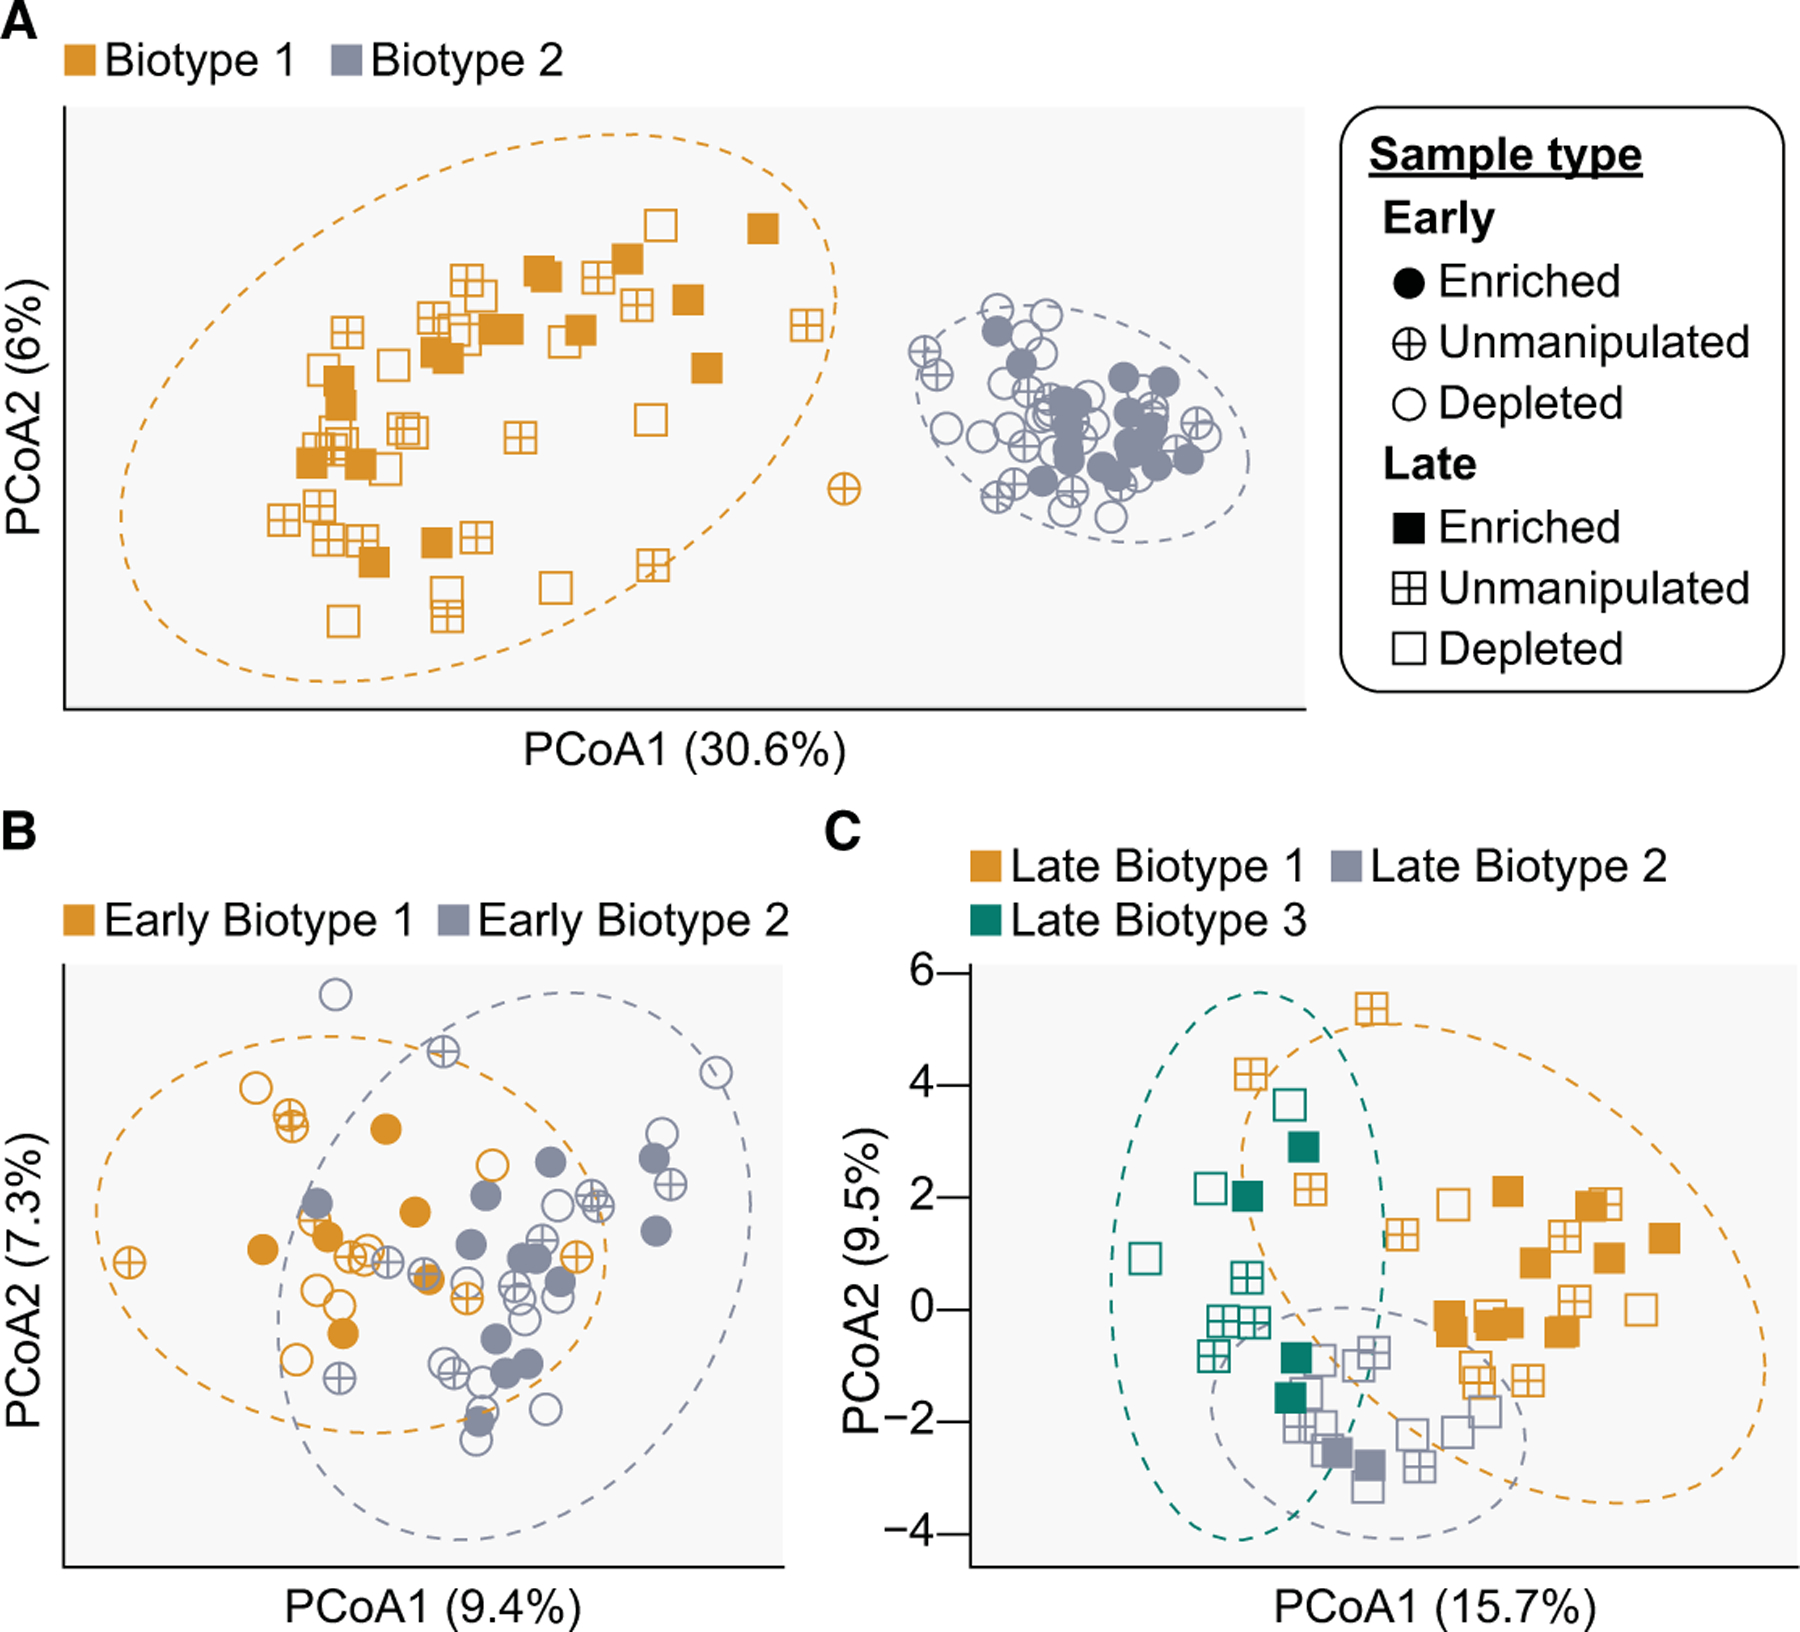
Understanding microbial roles in ecosystem function requires integrating microscopic processes into food webs. The carnivorous pitcher plant, Sarracenia purpurea, offers a tractable study system where diverse food webs of macroinvertebrates and microbes facilitate digestion of captured insect prey, releasing nutrients supporting the food web and host plant. However, how interactions between these macroinvertebrate and microbial communities contribute to ecosystem functions remains unclear. We examined the role of the pitcher plant mosquito, Wyeomyia smithii, in top-down control of the composition and function of pitcher plant microbial communities. Mosquito larval abundance was enriched or depleted across a natural population of S. purpurea pitchers over a 74-day field experiment. Bacterial community composition and microbial community function were characterized by 16S rRNA amplicon sequencing and profiling of carbon substrate use, bulk metabolic rate, hydrolytic enzyme activity, and macronutrient pools. Bacterial communities changed from pitcher opening to maturation, but larvae exerted minor effects on high-level taxonomic composition. Higher larval abundance was associated with lower diversity communities with distinct functions and elevated nitrogen availability. Treatment-independent clustering also supported roles for larvae in curating pitcher microbial communities through shifts in community diversity and function. These results demonstrate top-down control of microbial functions in an aquatic microecosystem.

Keywords: carnivorous plant; microbiota; nitrogen; nutrient degradation/cycling; symbiosis; top‐down control.


Conflict of interest statement

Conflicts of interest

All authors declare no conflicts of interest.

Figures

FIGURE 1
FIGURE 1
Study design for field-based manipulations at Cedarburg Bog, Wisconsin, USA (a), and the effects on larval abundance in pitchers assigned to different treatment groups over time (b). Sixty unopened Sarracenia purpurea pitchers were tagged in the field and visited shortly after opening to standardize prey capture by the addition of ten Drosophila melanogaster in 10–15 mL sterile water (= Day 0). Seven days later (= Day 7), 20 pitchers were assigned to each of three treatments: “Enriched” (yellow), “Unmanipulated” (green), and “Depleted” (blue). Water was also collected for bacterial 16S rRNA gene amplicon sequencing and enzymatic assays of protease and chitinase activity (= early timepoint, Day 7). At 10–14-day intervals thereafter, pitchers were visited to maintain treatment manipulations (see Days 18, 28, 39, 53 and 63) and to collect samples for additional assays for enzyme activity (see Days 18, 28 and 39). At the late timepoint (= Day 74), all remaining pitcher fluid was collected for bacterial 16S rRNA gene amplicon sequencing and profiling of carbon substrate use, bulk microbial respiration, and macronutrient concentrations. Larvae added to Enriched pitchers were derived from newly hatched eggs laid by adult females in our laboratory Wyeomyia smithii colony (established from mosquitoes collected from natural populations in Wisconsin) and were maintained under sterile conditions prior to field introductions. Boxplots show high, low and median values, with lower and upper edges of each box denoting first and third quartiles, respectively. Dashed lines are “loess” fit lines showing the trend of larval abundance in each treatment group over time. Asterisks (*) indicate timepoints where larval abundance was significantly higher in Enriched pitchers relative to Depleted pitchers (Dunn’s test; BH-adj p < .001).
FIGURE 2
FIGURE 2
(a) Relative abundance of bacterial orders in fluid collected from “Enriched”, “Unmanipulated”, and “Depleted” pitchers at the early (upper, Day 7) and late (lower, Day 74) timepoint. Coloured bars present the proportion of sequencing reads assigned to a given order. Low abundance orders (<2%) are represented by the “Other” category. (b) Differences in alpha diversity between communities in Enriched, Unmanipulated and Depleted pitchers as measured by breakaway richness (left) and Shannon’s H index (right). Mean values ± standard errors are shown. Different letters indicate significant differences between treatment groups (betta test, p < .01).
FIGURE 3
FIGURE 3
(a) Differences in select measures of microbial community function within “Enriched”, “Unmanipulated” and “Depleted” pitchers. Boxplots show high, low and median values, with lower and upper edges of each box denoting first and third quartiles, respectively. Different letters indicate significant differences between treatment groups (Tukey–Kramer HSD test, p < .05). (b) Regression analyses between the same functional measures (y-axis) and cumulative larval abundance in individual pitchers (x-axis). Significant relationships were identified between cumulative larval abundance and measures of Lphenylalanine hydrolysis efficiency (p = .039, R2 = .122), glycogen hydrolysis efficiency (p < .001, R2 = .392), and TN concentration (p < .001, R2 = .361), but not respiration (p = .08, R2 = .114).
FIGURE 4
FIGURE 4
BCA visualization of biotypes as identified by PAM clustering of communities across the entire dataset (a) or separated by early (b, Day 7) and late samples (c, Day 74). Symbols in each panel are coloured by biotype, while the legend in the upper right of the figure designates pitcher treatment group (“Enriched”, “Unmanipulated” or “Depleted”) and timepoint of sampling (early or late) by symbol fill and shape, respectively. Ellipses (dashed lines) represent 95% confidence intervals.
FIGURE 5
FIGURE 5
Relative abundance of bacterial orders in late (Day 74) communities assigned to “Late Biotype 1”, “Late Biotype 2”, and “Late Biotype 3” (left), along with the relative abundances of select genera that were enriched in each biotype (right). Coloured bars in the left panel present the proportion of sequencing reads assigned to a given order, with low abundance orders (<2%) being represented by the “Other” category. Boxplots in the right panel show high, low, and median values, with lower and upper edges of each box denoting first and third quartiles, respectively. Only boxplots for the two genera with the highest BCA coefficients in each biotype are presented. Other taxonomic drivers of biotypes can be found in Table S5.

References

    1. Adlassnig W, Peroutka M, & Lendl T (2011). Traps of carnivorous pitcher plants as a habitat: Composition of the fluid, biodiversity and mutualistic activities. Annals of Botany, 107(2), 181–194. 10.1093/aob/mcq238 - DOI - PMC - PubMed
    1. Amir A, McDonald D, Navas-Molina JA, Kopylova E, Morton JT, Zech Xu Z, Kightley EP, Thompson LR, Hyde ER, Gonzalez A, & Knight R (2017). Deblur Rapidly Resolves Single-Nucleotide Community Sequence Patterns. mSystems, 2(2). 10.1128/mSystems.00191-16 - DOI - PMC - PubMed
    1. Arellano AA, & Coon KL (2022). Bacterial communities in carnivorous pitcher plants colonize and persist in inquiline mosquitoes. Animal Microbiome, 4(1), 13. 10.1186/s42523-022-00164-1 - DOI - PMC - PubMed
    1. Armitage DW (2017). Linking the development and functioning of a carnivorous pitcher plant’s microbial digestive community. The ISME Journal, 11(11), 2439–2451. 10.1038/ismej.2017.99 - DOI - PMC - PubMed
    1. Arumugam M, Raes J, Pelletier E, Le Paslier D, Yamada T, Mende DR, Fernandes GR, Tap J, Bruls T, Batto J-M, Bertalan M, Borruel N, Casellas F, Fernandez L, Gautier L, Hansen T, Hattori M, Hayashi T, Kleerebezem M, … Bork P (2011). Enterotypes of the human gut microbiome. Nature, 473(7346), 174–180. 10.1038/nature09944 - DOI - PMC - PubMed

Substances

LinkOut - more resources