. 2024 May;11(18):e2307630.
doi: 10.1002/advs.202307630. Epub 2024 Mar 5.

Turmeric-Derived Nanoparticles Functionalized Aerogel Regulates Multicellular Networks to Promote Diabetic Wound Healing

Affiliations

Turmeric-Derived Nanoparticles Functionalized Aerogel Regulates Multicellular Networks to Promote Diabetic Wound Healing

Bodeng Wu et al. Adv Sci (Weinh). 2024 May.

Abstract

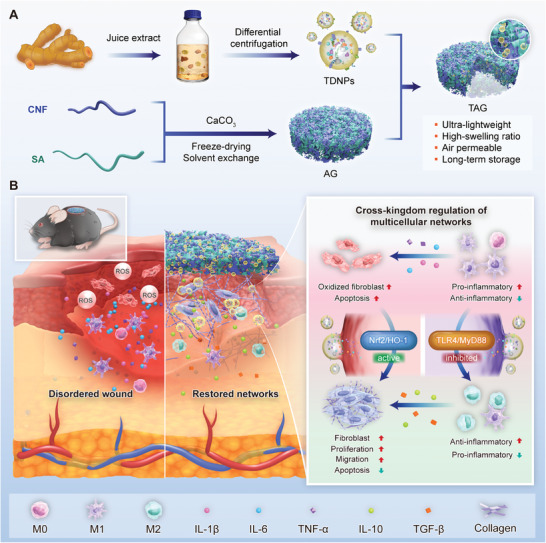
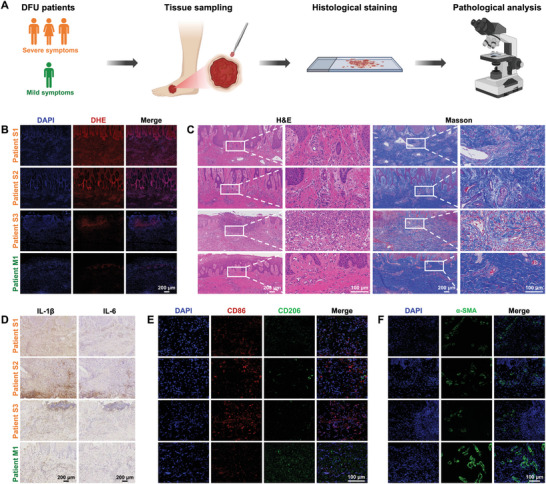
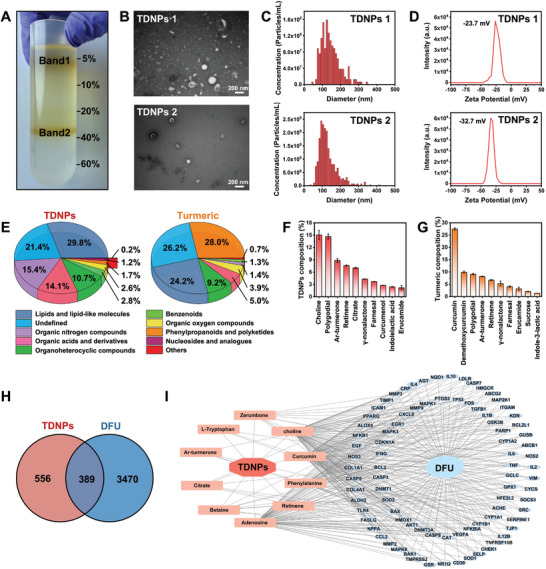
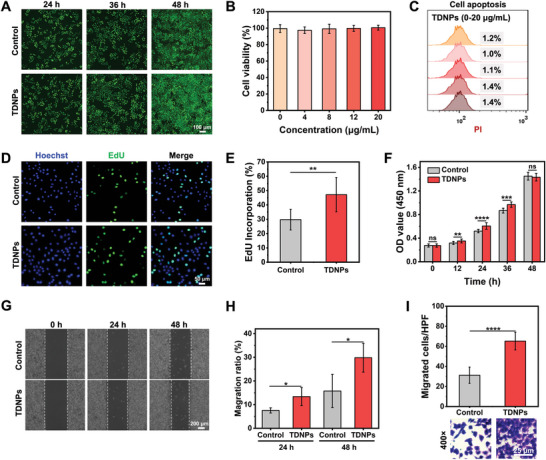
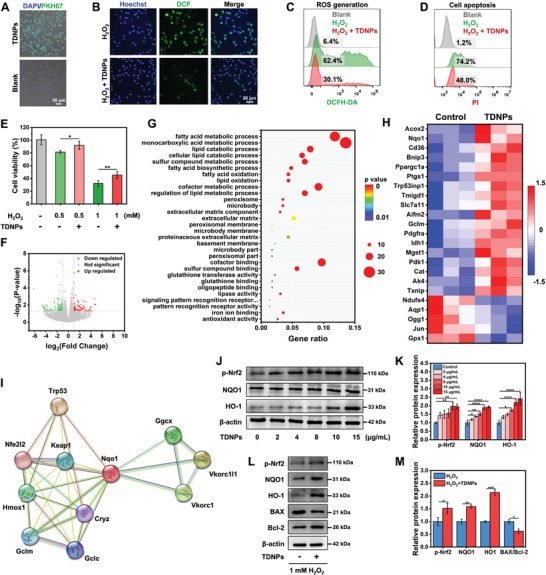
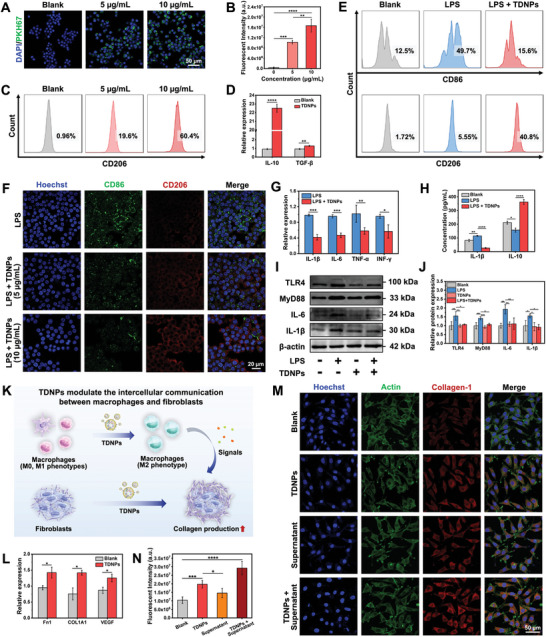
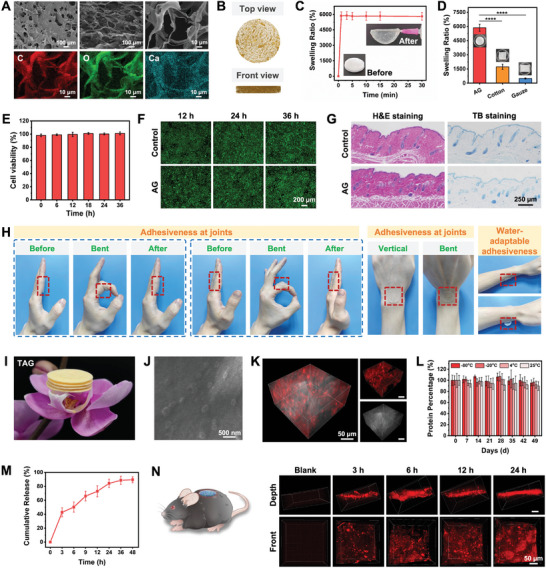
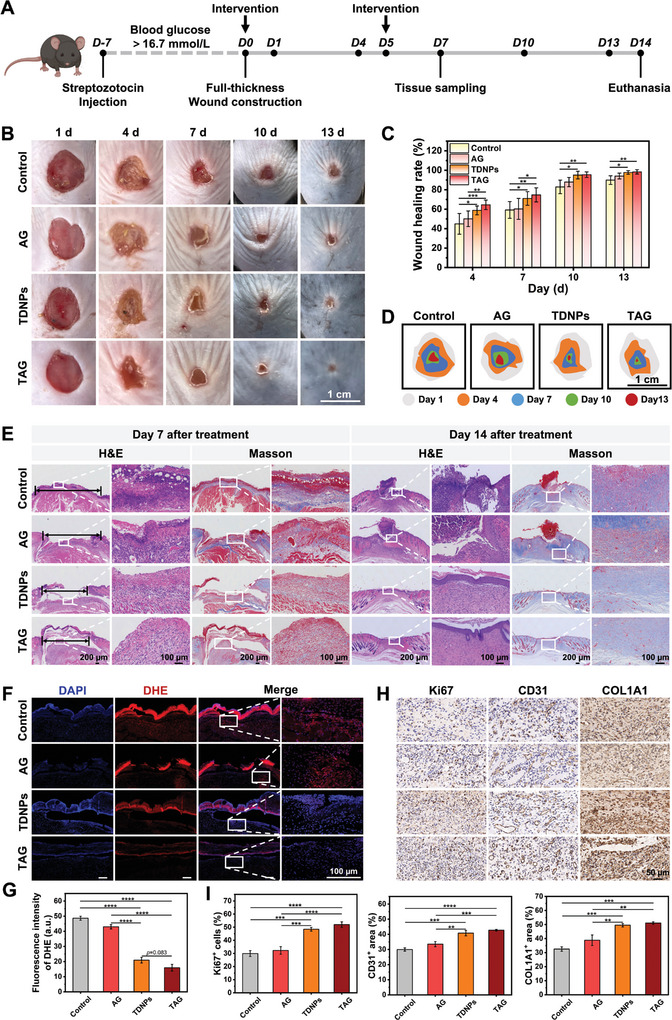
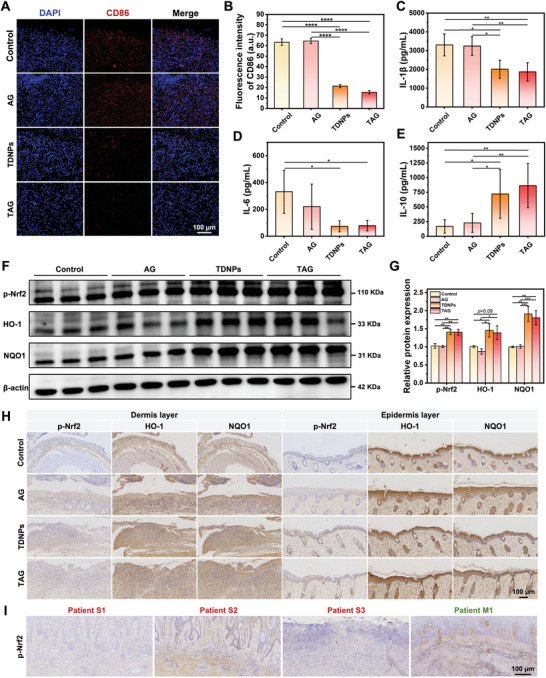
Regulation of excessive inflammation and impaired cell proliferation is crucial for healing diabetic wounds. Although plant-to-mammalian regulation offers effective approaches for chronic wound management, the development of a potent plant-based therapeutic presents challenges. This study aims to validate the efficacy of turmeric-derived nanoparticles (TDNPs) loaded with natural bioactive compounds. TDNPs can alleviate oxidative stress, promote fibroblast proliferation and migration, and reprogram macrophage polarization. Restoration of the fibroblast-macrophage communication network by TDNPs stimulates cellular regeneration, in turn enhancing diabetic wound healing. To address diabetic wound management, TDNPs are loaded in an ultralight-weight, high swelling ratio, breathable aerogel (AG) constructed with cellulose nanofibers and sodium alginate backbones to obtain TDNPs@AG (TAG). TAG features wound shape-customized accessibility, water-adaptable tissue adhesiveness, and capacity for sustained release of TDNPs, exhibiting outstanding performance in facilitating in vivo diabetic wound healing. This study highlights the potential of TDNPs in regenerative medicine and their applicability as a promising solution for wound healing in clinical settings.

Keywords: Nrf2/HO‐1 pathway; aerogels; cross‐kingdom regulations; diabetic wound healing; turmeric‐derived nanoparticles.


Conflict of interest statement

The authors declare no conflict of interest.

Figures

Scheme 1
Scheme 1
TDNPs‐loaded aerogel serves as an immunomodulatory dressing by modulating multicellular networks for diabetic wound healing. A) Isolation of TDNPs and fabrication of AG and TAG dressings. B) TAG promotes diabetic wound healing by enhancing antioxidant capacity, inhibiting inflammation, and restoring multicellular regulatory networks in the wound microenvironment. TDNPs, turmeric‐derived nanoparticles; AG, aerogel; CNF, cellulose nanofiber; SA, sodium alginate; TAG, TDNPs‐loaded aerogel (TDNPs@AG).
Figure 1
Figure 1
Pathological analysis of DFU tissues from patients with severe (n = 3) and mild (n = 1) symptoms. A) Flowchart showing collection and analysis of clinical DFU tissues. B) DHE, and C) H&E and Masson's trichrome staining of DFU tissues. D) Expressions of IL‐1β and IL‐6 in DFU tissues. E) Polarization of macrophages in DFU tissues. F) Immunofluorescence staining of α‐SMA in DFU tissues. DFU, diabetic foot ulcer; DHE, dihydroethidium; H&E, hematoxylin and eosin.
Figure 2
Figure 2
Purification and characterization of TDNPs. A) Two bands formed after iodixanol gradient (5%/10%/20%/40%/60%) ultracentrifugation. B) TEM images of TDNPs 1 and TDNPs 2, respectively. C) Size distributions, and D) zeta potential analysis of TDNPs 1 and TDNPs 2, respectively. E) Pie charts showing the compositions of TDNPs and turmeric tissue (n = 3). The top 10 metabolites observed in F) TDNPs and G) turmeric (n = 3). H) Potential target gene intersection between TDNPs and DFU. I) Potential target gene network of TDNPs and DFU. Data are presented as mean ± SD. TEM, transmission electron microscope; DFU, diabetic foot ulcer; TDNPs, turmeric‐derived nanoparticles.
Figure 3
Figure 3
Characterization of TDNPs in fibroblasts. A) Fibroblasts were treated with PBS or TDNPs for different time periods and stained with calcein‐AM and propidium iodide (PI). Green and red fluorescence indicate live and dead cells, respectively. (B) Cell viability of fibroblasts after the addition of TDNPs at varied concentrations (0, 4, 8, 12, and 20 µg mL−1, respectively) for 24 h (n = 5). C) Analysis of apoptosis of fibroblasts pre‐treated with TDNPs, using PI as an indicator. D) EdU images of fibroblasts treated with PBS and TDNPs. E) Quantification of EdU incorporation (shown in (D)) (n = 3). F) Growth trends of fibroblasts with or without treatment with TDNPs over 48 h (n = 5). G) Migration capacity of fibroblasts measured using a wound‐healing test. H) Migration ratio of fibroblasts under different formulations (corresponding to(G)) (n = 4). I) Statistical analysis and representative images of the migrating cells observed in high power field (HPF), under different formulas (n = 3). Data are presented as mean ± SD. Statistical significance was based on Student's t‐test and one‐way ANOVA with post‐hoc test; ns, not significant, *p < 0.05, **p < 0.01, ***p < 0.001, and ****p < 0.0001. TDNPs, turmeric‐derived nanoparticles; PBS, phosphate buffer saline; EDU, 5‐ethynyl‐2′‐deoxyuridine.
Figure 4
Figure 4
Characterization of TDNPs in fibroblasts. A) Uptake of TDNPs by L929 cells. B) Intracellular ROS level of L929 cells treated with H2O2 and H2O2 + TDNPs (n = 3). C) Flow cytometry analysis of L929 cells handled with PBS, H2O2, and H2O2 + TDNPs, using the DCFH‐DA probe as an indicator (n = 3). D) Cell apoptosis of L929 cells after different treatments (n = 3). E) Viability of L929 cells under different conditions (n = 5). F) Volcano plot analysis of DEGs in L929 cells and TDNPs‐treated L929 cells. G) GO enrichment analysis of the up‐regulated DEGs. H) Upregulated and downregulated genes involved in oxidative stress after TDNPs treatment (fold change ≥ 2 and p < 0.05) (n = 3). I) Cytoscape plot of STRING protein–protein interaction analysis of Nqo1. J) Western blot analysis of endogenous antioxidant markers p‐Nrf2, NQO1, and HO‐1 in L929 cells after treatment with TDNPs (n = 3). K) Quantification of protein expression levels of p‐Nrf2, NQO1, and HO‐1 (corresponding to(J)) (n = 3). Values are normalized to that of L929 cells treated with control. L) Western blot analysis of endogenous antioxidant markers of L929 cells under H2O2 and H2O2 + TDNPs treatments, respectively (n = 3). M) Quantification of protein expression levels of p‐Nrf2, NQO1, HO‐1, and BAX/Bcl‐2 (corresponding to(L)) (n = 3). Values are normalized to that of L929 cells treated with control. Data are presented as mean ± SD. Statistical significance was based on Student's t‐test and one‐way ANOVA with post‐hoc test; *p < 0.05, **p < 0.01, ***p < 0.001, and ****p < 0. 0001. TDNPs, turmeric‐derived nanoparticles; ROS, reactive oxygen species; PBS, phosphate buffer saline; DCFH‐DA, dichlorodihydrofluorescein diacetate; DEGs, differentially expressed genes; GO, gene ontology; STRING, search tool for recurring instances of neighboring genes.
Figure 5
Figure 5
Effect of TDNPs on macrophage polarization and macrophage–fibroblast communication. A) CLSM showing the uptake of TDNPs (green fluorescence) by macrophages. B) Fluorescence intensity analysis of TDNPs ingestion by macrophages (n = 3). C) Polarization of macrophages after treatment with TDNPs (5 and 10 µg mL−1) (n = 3). D) Relative expression of IL‐10 and TGF‐β in macrophages before and after treatment with TDNPs (n = 3). E) Polarization of macrophages after treatment with various formulations (n = 3). F) CLSM images of macrophages under varied treatments and labeled with CD86 and CD206 fluorescent antibodies. G,H) Expression of cytokines in macrophages assessed by G) qPCR and H) ELISA. (n = 3). I) Western blot analysis of TLR4–MyD88 pathway regulated by TDNPs in macrophage (n = 3). J) Quantification of protein expression levels of TLR4, MyD88, IL‐6, and IL‐1β (corresponding to(I)) (n = 3). Values are normalized to that of L929 cells treated with control. K) Schematic illustration of the influence of TDNPs on communication between macrophages and fibroblasts. L) Gene expressions of Fn1, COL1A1, and VEGF in fibroblasts supplemented with cell supernatant from TDNPs‐treated macrophages (n = 3). M) CLSM images of collagen in fibroblasts after various treatments. N) Quantification of fluorescence intensity of collagen (corresponding to(L)) (n = 3). Data are expressed as mean ± SD. Statistical significance was based on Student's t‐test and one‐way ANOVA with post‐hoc test; *p < 0.05, **p < 0.01, ***p < 0.001, and ****p < 0.0001. TDNPs, turmeric‐derived nanoparticles; CLSM, confocal laser scanning microscopy; LPS, Lipopolysaccharide.
Figure 6
Figure 6
Characterization of TAG. A) SEM image and energy dispersive X‐ray analysis of the aerogel (AG). B) Microtomography of AG showing porous structure. C) Swelling property of AG. The inserts show the AG before and after soaking in water. D) Swelling ratio of AG, medical cotton, and gauze (n = 3). E,F) Cytotoxicity of AG in L929 cells (n = 5). G) Histological analysis of skin samples collected from mice treated with AG or control (n = 3). H) Adhesion of AG on joints and skin surface. I) Picture showing four patches of TAG on a flower. J) SEM image of TAG with TDNPs inside the matrix. K) Distribution of TDNPs within AG. Red fluorescence represents DID‐labeled TDNPs. L) Remaining protein in TAG under different storage conditions for 49 days (n = 3). M) Release pattern of TDNPs from TAG (n = 3). N) Penetration of TDNPs into the skin tissues. Data are shown as mean ± SD. Statistical significance was based on one‐way ANOVA with post‐hoc test; ****p < 0.0001. TAG, TDNPs‐loaded aerogel (TDNPs@AG); H&E, hematoxylin and eosin; SEM, scanning electron microscope.
Figure 7
Figure 7
In vivo wound‐healing effect of TAG. A) Flowchart of experimental procedures. B) Representative photographs of diabetic wounds treated with different formulations on days 1, 4, 7, 10, and 13, respectively. C) Wound contractions of mice treated with PBS, AG, TDNPs, or TAG (n ≥ 7). D) Schematic images of diabetic wound contraction in mice within 13 days of treatment with different formulations. E) H&E and Masson's trichrome staining of the wound tissues obtained from diabetic mice with varied dressings on days 7 and 14, respectively (n = 3). F) Representative DHE staining images of diabetic wounds in each group. G) Statistical data of DHE fluorescence intensity at the wound bed on day 7 (n = 3). H) Representative images of Ki67, CD31, and COL1A1 expressions in different groups of tissues. I) Statistical data of Ki67+ cells, CD31+ area, and COL1A1+ area in tissues obtained from different groups (n = 3). Data are presented as mean ± SD. Statistical significance was based on one‐way ANOVA with post‐hoc test; *p < 0.05, **p < 0.01, ***p < 0.001, and ****p < 0.0001. TDNPs, turmeric‐derived nanoparticles; TAG, TDNPs‐loaded aerogel (TDNPs@AG); PBS, phosphate buffer saline; AG, aerogel; DHE, dihydroethidium; H&E, hematoxylin and eosin.
Figure 8
Figure 8
In vivo anti‐inflammatory and antioxidant effect of TAG. A) Representative images of immunofluorescence staining with CD86 in diabetic cutaneous ulcer tissue obtained from mice with varied dressing. B) Quantification of fluorescence intensity (CD86) (n = 3). C–E) Statistical analysis of IL‐1β, IL‐6, and IL‐10 in skin tissue, measured using ELISA (n = 7). F) Western blot analysis of p‐Nrf2, HO‐1, and NQO1 in wound tissues obtained from mice with varied dressings. G) Quantification of protein expression levels of p‐Nrf2, HO‐1, and NQO1 (corresponding to(F)) (n = 3). Values are normalized to that of L929 cells treated with control. H) Representative images of p‐Nrf2, NQO1, and HO‐1 expression wound tissues obtained from mice with varied dressings. I) Expression of p‐Nrf2 in skin tissues obtained from DFU patients. Data are presented as mean ± SD. Statistical significance was based on one‐way ANOVA with post‐hoc test; a non‐parametric Wilcoxon rank‐sum test was used to assess the IL‐1β and IL‐6 ELISA data; *p < 0.05, **p < 0.01, ***p < 0.001, and ****p < 0.0001. TDNPs, turmeric‐derived nanoparticles; AG, aerogel; TAG, TDNPs‐loaded aerogel (TDNPs@AG); ELISA, enzyme‐linked immunosorbent assay.

References

    1. Sun H., Saeedi P., Karuranga S., Pinkepank M., Ogurtsova K., Duncan B. B., Stein C., Basit A., Chan J. C. N., Mbanya J. C., Pavkov M. E., Ramachandaran A., Wild S. H., James S., Herman W. H., Zhang P., Bommer C., Kuo S., Boyko E. J., Magliano D. J., Diabetes Res. Clin. Pract. 2022, 183, 109119. - PMC - PubMed
    1. Jeffcoate W. J., Harding K. G., Lancet 2003, 361, 1545. - PubMed
    1. Jupiter D. C., Thorud J. C., Buckley C. J., Shibuya N., Int. Wound J. 2016, 13, 892. - PMC - PubMed
    1. Hart T., Milner R., Cifu A., JAMA, J. Am. Med. Assoc. 2017, 318, 1387. - PubMed
    1. Falanga V., Lancet 2005, 366, 1736. - PubMed

LinkOut - more resources