. 2024 Mar 5:15:159-174.
doi: 10.18632/oncotarget.28558.

GZ17-6.02 interacts with proteasome inhibitors to kill multiple myeloma cells

Affiliations

GZ17-6.02 interacts with proteasome inhibitors to kill multiple myeloma cells

Laurence Booth et al. Oncotarget. .

Abstract

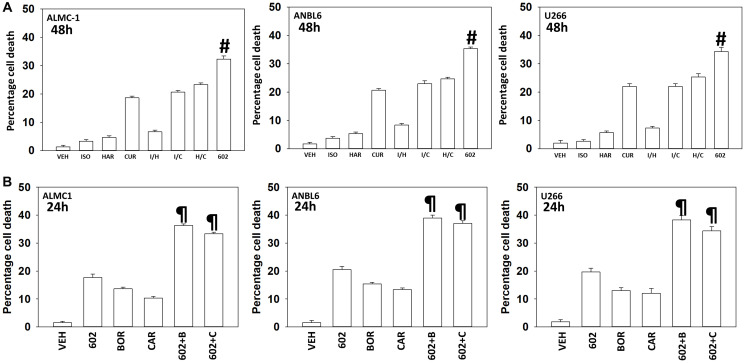
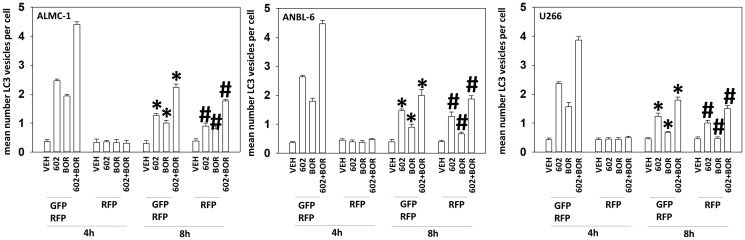
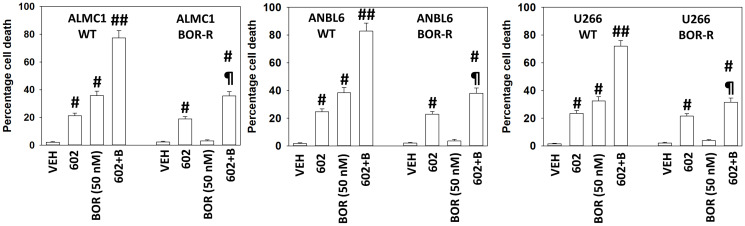
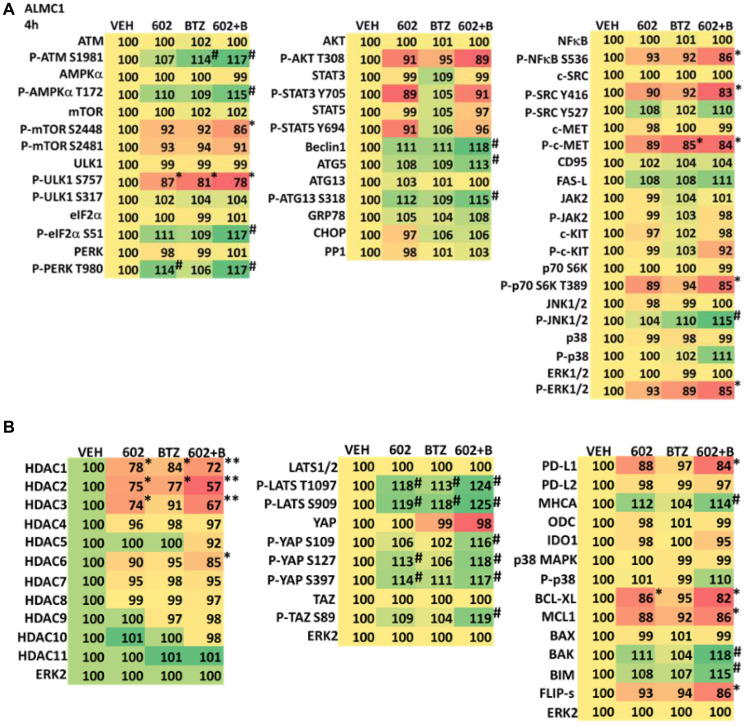
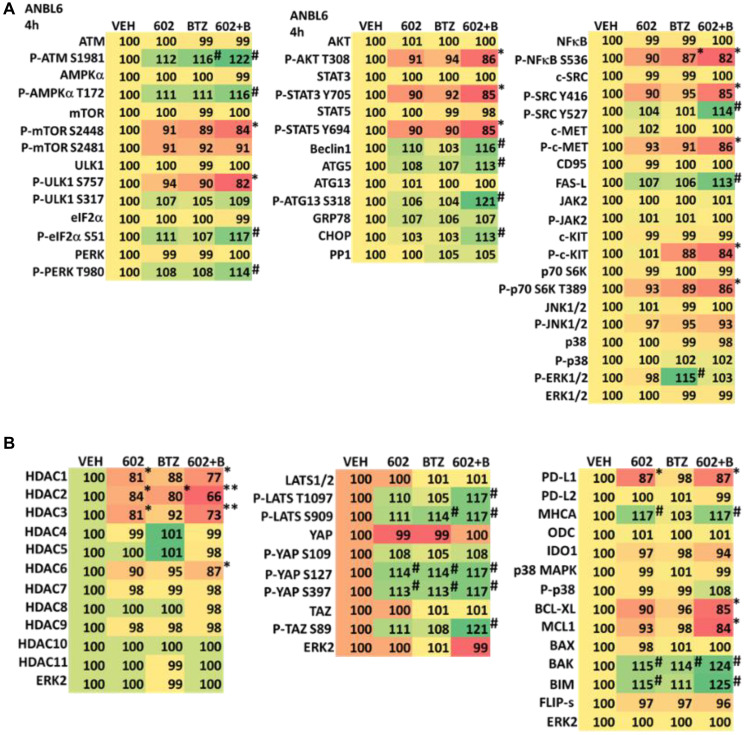
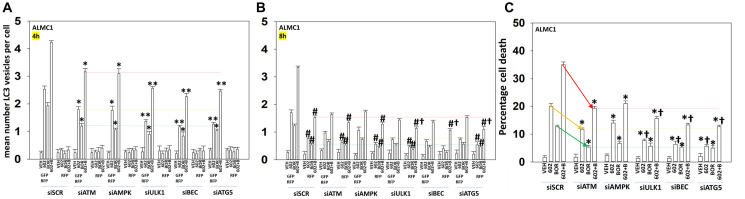
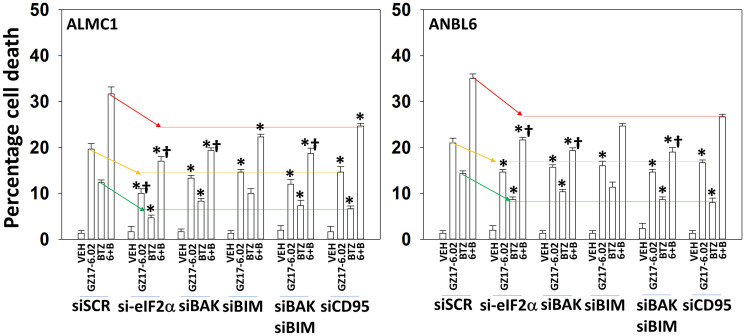
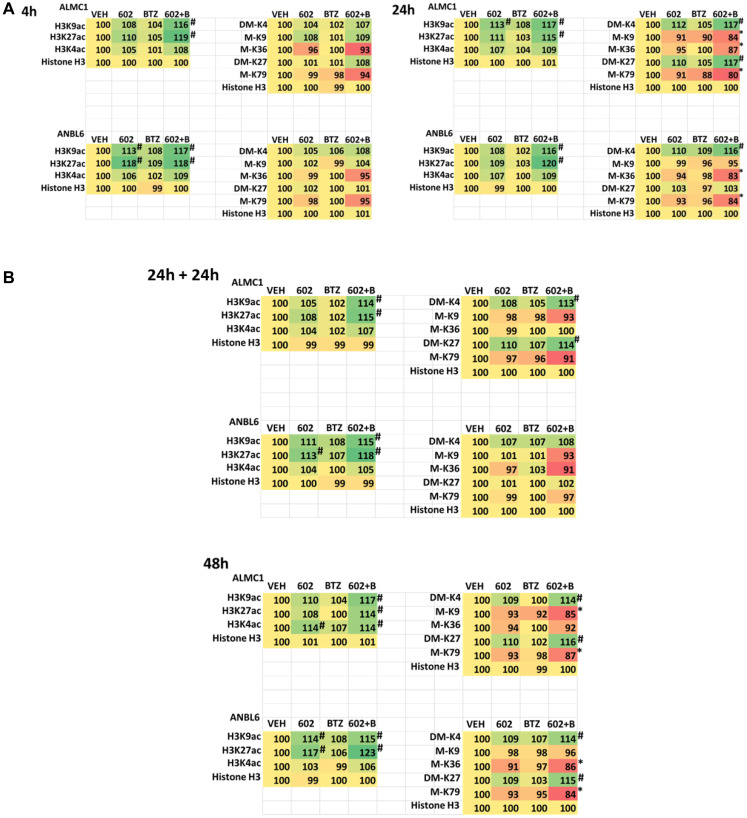
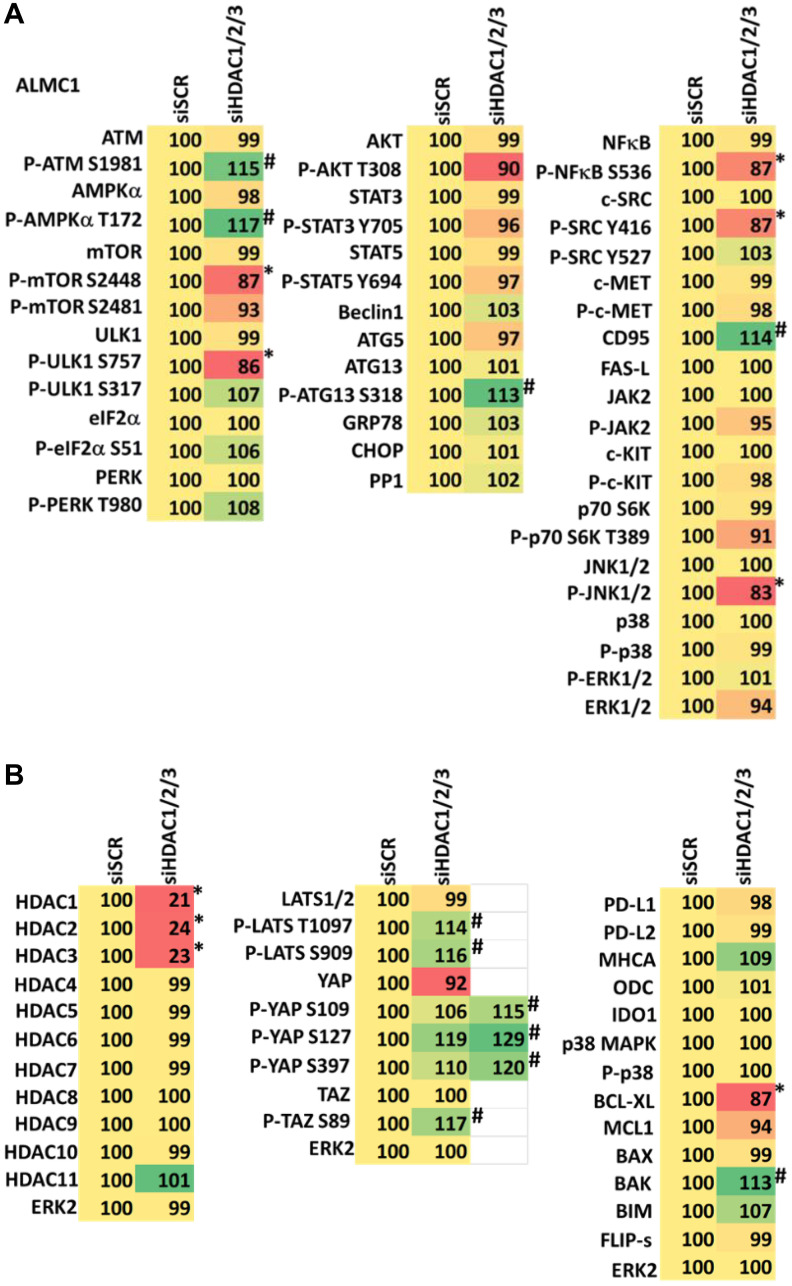
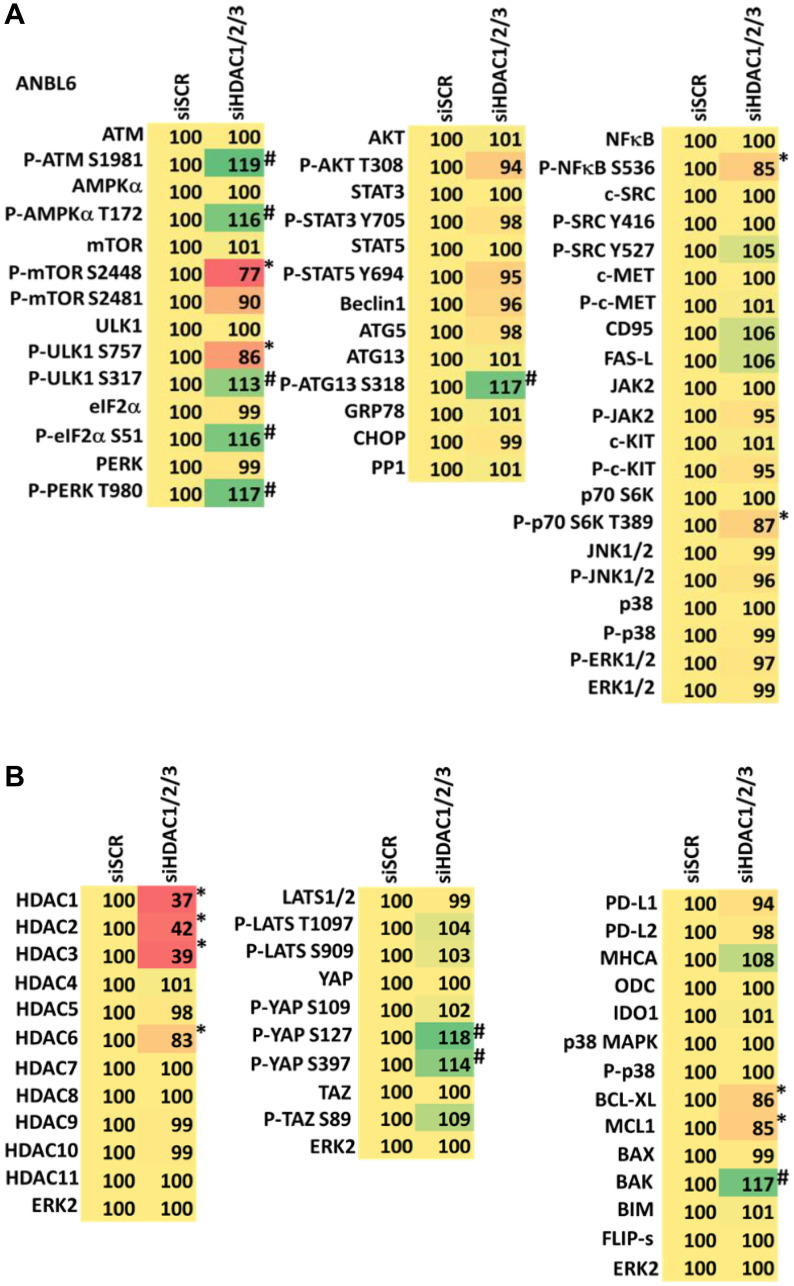
GZ17-6.02, a synthetically manufactured compound containing isovanillin, harmine and curcumin, has undergone phase I evaluation in patients with solid tumors (NCT03775525) with a recommended phase 2 dose (RP2D) of 375 mg PO BID. GZ17-6.02 was more efficacious as a single agent at killing multiple myeloma cells than had previously been observed in solid tumor cell types. GZ17-6.02 interacted with proteasome inhibitors in a greater than additive fashion to kill myeloma cells and alone it killed inhibitor-resistant cells to a similar extent. The drug combination of GZ17-6.02 and bortezomib activated ATM, the AMPK and PERK and inactivated ULK1, mTORC1, eIF2α, NFκB and the Hippo pathway. The combination increased ATG13 S318 phosphorylation and the expression of Beclin1, ATG5, BAK and BIM, and reduced the levels of BCL-XL and MCL1. GZ17-6.02 interacted with bortezomib to enhance autophagosome formation and autophagic flux, and knock down of ATM, AMPKα, ULK1, Beclin1 or ATG5 significantly reduced both autophagy and tumor cell killing. Knock down of BAK and BIM significantly reduced tumor cell killing. The expression of HDACs1/2/3 was significantly reduced beyond that previously observed in solid tumor cells and required autophagy. This was associated with increased acetylation and methylation of histone H3. Combined knock down of HDACs1/2/3 caused activation of ATM and the AMPK and caused inactivation of ULK1, mTORC1, NFκB and the Hippo pathway. HDAC knock down also enhanced ATG13 phosphorylation, increased BAK levels and reduced those of BCL-XL. Collectively, our present studies support performing additional in vivo studies with multiple myeloma cells.

Keywords: ER stress; GZ17-6.02; autophagy; bortezomib; proteasome inhibitor.


Conflict of interest statement

CONFLICTS OF INTEREST

PD has received funding support from Genzada Pharmaceuticals Inc. for these studies. Dr. West is a paid officer of the company. Dr. Dent is a Consultant and Key Scientific advisor to the company. PD and CW thank Dr. Daniel Von Hoff, a consultant and key scientific advisor for Genzada Pharmaceuticals, for expert guidance during performance of these studies and for editing the manuscript.

Figures

Figure 1
Figure 1. GZ17-6.02 and proteasome inhibitors interact in a greater than additive fashion to kill multiple myeloma cells.
(A) ALMC1, ANBL6 and U266 cells were treated with vehicle control, GZ17-6.02 (curcumin (2.0 μM) + harmine (4.5 μM) + isovanillin (37.2 μM)) or with component parts of GZ17-6.02 as individual agents at the indicated concentrations or in duo combinations. Cells were isolated 48 h afterwards and viability determined via trypan blue exclusion assays (n = 3 +/− SD). # p < 0.05 greater than other tested drug treatments. (B) ALMC1, ANBL6 and U266 cells were treated with vehicle control, GZ17-6.02 (2 μM curcumin, final), bortezomib (10 nM), carfilzomib (5 nM) or the drugs in combination, as indicated. Twenty-four h later, cells were isolated, and viability determined via trypan blue exclusion assays (n = 3 +/− SD). p < 0.05 greater than other tested drug treatments.
Figure 2
Figure 2. GZ17-6.02 and bortezomib interact to cause autophagosome formation and autophagic flux.
ALMC1, ANBL6 and U266 cells were transfected with a plasmid to express LC3-GFP-RFP. Twenty-four h later, cells were treated with vehicle control, GZ17-6.02 (curcumin 2 μM, final), bortezomib (10 nM) or the drugs in combination for 4 h and 8 h. At each time point, the mean number of autophagosomes (GFP+ RFP+) and autolysosomes (RFP+) per cell were determined randomly in >100 cells. (n = 3 +/− SD). * p < 0.05 less than corresponding value at 4 h; # p < 0.05 greater than corresponding value at 4 h.
Figure 3
Figure 3. GZ17-6.02 efficacy is not significantly reduced in bortezomib-resistant multiple myeloma cells.
Multiple myeloma cells were grown in 50 nM bortezomib for a month. Surviving “resistant” cells and parental cells were then treated with vehicle control, GZ17-6.02 (2 μM curcumin, final), bortezomib (50 nM) or the drugs in combination for 24 h. Cells were isolated after 24 h and viability determined by trypan blue exclusion assay (n = 3 +/− SD) # p < 0.05 greater than vehicle control; ## p < 0.05 greater than GZ17-6.02 single agent value; p < 0.05 less than corresponding value in wild type parental cells.
Figure 4
Figure 4
(A) GZ17-6.02 and bortezomib regulate signaling pathways in ALMC1 cells. Cells were treated with vehicle control, GZ17-6.02 (2 μM, curcumin final), bortezomib (10 nM) or the drugs in combination for 4 h. Cells were centrifuged and fixed in situ, permeabilized, stained with the indicated validated primary antibodies and imaged with secondary antibodies carrying red- and green-fluorescent tags. The staining intensity of at least 100 cells per well/condition is determined in three separate studies. The data are the normalized amount of fluorescence set at 100% comparing intensity values for vehicle control (n = 3 +/− SD). # p < 0.05 greater than vehicle control; * p < 0.05 less than vehicle control. Tabular data are presented as a heat-map (Microsoft Excel: conditional formatting, color scales: green, yellow, red). Green indicates greater levels and red indicates lower levels of staining. (B) GZ17-6.02 and bortezomib regulate signaling pathways in ALMC1 cells. Cells were treated with vehicle control, GZ17-6.02 (2 μM, curcumin final), bortezomib (10 nM) or the drugs in combination for 4 h. Cells were centrifuged and fixed in situ, permeabilized, stained with the indicated validated primary antibodies and imaged with secondary antibodies carrying red- and green-fluorescent tags. The staining intensity of at least 100 cells per well/condition is determined in three separate studies. The data are the normalized amount of fluorescence set at 100% comparing intensity values for vehicle control (n = 3 +/− SD). # p < 0.05 greater than vehicle control; * p < 0.05 less than vehicle control. Tabular data are presented as a heat-map (Microsoft Excel: conditional formatting, color scales: green, yellow, red). Green indicates greater levels and red indicates lower levels of staining.
Figure 5
Figure 5
(A) GZ17-6.02 and bortezomib regulate signaling pathways in ANBL6 cells. Cells were treated with vehicle control, GZ17-6.02 (2 μM, curcumin final), bortezomib (10 nM) or the drugs in combination for 4 h. Cells were centrifuged and fixed in situ, permeabilized, stained with the indicated validated primary antibodies and imaged with secondary antibodies carrying red- and green-fluorescent tags. The staining intensity of at least 100 cells per well/condition is determined in three separate studies. The data are the normalized amount of fluorescence set at 100% comparing intensity values for vehicle control (n = 3 +/− SD). # p < 0.05 greater than vehicle control; * p < 0.05 less than vehicle control. Tabular data are presented as a heat-map (Microsoft Excel: conditional formatting, color scales: green, yellow, red). Green indicates greater levels and red indicates lower levels of staining. (B) GZ17-6.02 and bortezomib regulate signaling pathways in ANBL6 cells. Cells were treated with vehicle control, GZ17-6.02 (2 μM, curcumin final), bortezomib (10 nM) or the drugs in combination for 4 h. Cells were centrifuged and fixed in situ, permeabilized, stained with the indicated validated primary antibodies and imaged with secondary antibodies carrying red- and green-fluorescent tags. The staining intensity of at least 100 cells per well/condition is determined in three separate studies. The data are the normalized amount of fluorescence set at 100% comparing intensity values for vehicle control (n = 3 +/− SD). # p < 0.05 greater than vehicle control; * p < 0.05 less than vehicle control. Tabular data are presented as a heat-map (Microsoft Excel: conditional formatting, color scales: green, yellow, red). Green indicates greater levels and red indicates lower levels of staining.
Figure 6
Figure 6. Signaling by ATM-AMPK and autophagosome formation are toxic events when cells are treated with GZ17-6.02 and bortezomib.
(A, B) ALMC1 cells were transfected with a plasmid to express LC3-GFP-RFP and co-transfected with a scrambled siRNA or with siRNA molecules to knock down the expression of ATM, AMPKα, ULK1, Beclin1 or ATG5. Twenty-four h later, cells were treated with vehicle control, GZ17-6.02 (curcumin 2 μM, final), bortezomib (10 nM) or the drugs in combination for 4 h and 8 h. At each time point, the mean number of autophagosomes (GFP+ RFP+) and autolysosomes (RFP+) per cell were determined randomly in >100 cells. (n = 3 +/− SD). * p < 0.05 less than corresponding value at 4 h; ** p < 0.05 less than corresponding values in siATM and siAMPK transfected cells; # p < 0.05 greater than corresponding value at 4 h; p < 0.05 less than corresponding values in siATM and siAMPK transfected cells. (C) ALMC1 cells were transfected with a scrambled siRNA or with siRNA molecules to knock down the expression of ATM, AMPKα, ULK1, Beclin1 or ATG5. Twenty-four h later, cells were treated with vehicle control, GZ17-6.02 (curcumin 2 μM, final), bortezomib (10 nM) or the drugs in combination for 24 h. Twenty-four h later, cells were isolated, and viability determined via trypan blue exclusion assays (n = 3 +/− SD). * p < 0.05 less than corresponding value in siSCR cells; p < 0.05 less than corresponding values in siATM and siAMPK transfected cells.
Figure 7
Figure 7. ER stress signaling plays an important role in mediating GZ17-6.02/bortezomib lethality.
ALMC1 and ANBL6 cells were transfected with scrambled siRNA or with siRNA molecules to knock down eIF2α, BAK, BIM or CD95. After 24 h, cells were treated with vehicle control, GZ17-6.02 (2 μM curcumin, final), bortezomib (10 nM) or the drugs in combination for 24 h. Twenty-four h later, cells were isolated, and viability determined via trypan blue exclusion assays (n = 3 +/− SD). * p < 0.05 less than corresponding value in siSCR cells; p < 0.05 less than corresponding values in siCD95 transfected cells.
Figure 8
Figure 8
(A) GZ17-6.02 and bortezomib regulate histone H3 acetylation and methylation in multiple myeloma cells. ALMC1 and ANBL6 cells were treated with vehicle control, GZ17-6.02 (2 μM, curcumin final), bortezomib (10 nM) or the drugs in combination for 4 h. Cells were centrifuged and fixed in situ, permeabilized, stained with the indicated validated primary antibodies and imaged with secondary antibodies carrying red- and green-fluorescent tags. The staining intensity of at least 100 cells per well/condition is determined in three separate studies. The data are the normalized amount of fluorescence set at 100% comparing intensity values for vehicle control (n = 3 +/− SD). # p < 0.05 greater than vehicle control; * p < 0.05 less than vehicle control. Tabular data are presented as a heat-map (Microsoft Excel: conditional formatting, color scales: green, yellow, red). Green indicates greater levels and red indicates lower levels of staining. (B) GZ17-6.02 and bortezomib regulate histone H3 acetylation and methylation in multiple myeloma cells. ALMC1 and ANBL6 cells were treated with vehicle control, GZ17-6.02 (2 μM, curcumin final), bortezomib (10 nM) or the drugs in combination for 4 h. Cells were centrifuged and fixed in situ, permeabilized, stained with the indicated validated primary antibodies and imaged with secondary antibodies carrying red- and green-fluorescent tags. The staining intensity of at least 100 cells per well/condition is determined in three separate studies. The data are the normalized amount of fluorescence set at 100% comparing intensity values for vehicle control (n = 3 +/− SD). # p < 0.05 greater than vehicle control; * p < 0.05 less than vehicle control. Tabular data are presented as a heat-map (Microsoft Excel: conditional formatting, color scales: green, yellow, red). Green indicates greater levels and red indicates lower levels of staining.
Figure 9
Figure 9
(A) Knock down of HDACs1/2/3 regulates signaling in ALMC1 cells in a fashion similar to that of GZ17-6.02. Cells were transfected with a scrambled siRNA or with siRNAs combined to knock down the expression of HDACs1/2/3. After 12 h cells were centrifuged and fixed in situ, permeabilized, stained with the indicated validated primary antibodies and imaged with secondary antibodies carrying red- and green-fluorescent tags. The staining intensity of at least 100 cells per well/condition is determined in three separate studies. The data are the normalized amount of fluorescence set at 100% comparing intensity values for vehicle control (n = 3 +/− SD). # p < 0.05 greater than vehicle control; * p < 0.05 less than vehicle control. Tabular data are presented as a heat-map (Microsoft Excel: conditional formatting, color scales: green, yellow, red). Green indicates greater levels and red indicates lower levels of staining. (B) Knock down of HDACs1/2/3 regulates signaling in ALMC1 cells in a fashion similar to that of GZ17-6.02. Cells were transfected with a scrambled siRNA or with siRNAs combined to knock down the expression of HDACs1/2/3. After 12 h cells were centrifuged and fixed in situ, permeabilized, stained with the indicated validated primary antibodies and imaged with secondary antibodies carrying red- and green-fluorescent tags. The staining intensity of at least 100 cells per well/condition is determined in three separate studies. The data are the normalized amount of fluorescence set at 100% comparing intensity values for vehicle control (n = 3 +/− SD). # p < 0.05 greater than vehicle control; * p < 0.05 less than vehicle control. Tabular data are presented as a heat-map (Microsoft Excel: conditional formatting, color scales: green, yellow, red). Green indicates greater levels and red indicates lower levels of staining.
Figure 10
Figure 10
(A) Knock down of HDACs1/2/3 regulates signaling in ANBL6 cells in a fashion similar to that of GZ17-6.02. Cells were transfected with a scrambled siRNA or with siRNAs combined to knock down the expression of HDACs1/2/3. After 12 h cells were centrifuged and fixed in situ, permeabilized, stained with the indicated validated primary antibodies and imaged with secondary antibodies carrying red- and green-fluorescent tags. The staining intensity of at least 100 cells per well/condition is determined in three separate studies. The data are the normalized amount of fluorescence set at 100% comparing intensity values for vehicle control (n = 3 +/− SD). # p < 0.05 greater than vehicle control; * p < 0.05 less than vehicle control. Tabular data are presented as a heat-map (Microsoft Excel: conditional formatting, color scales: green, yellow, red). Green indicates greater levels and red indicates lower levels of staining. (B) Knock down of HDACs1/2/3 regulates signaling in ANBL6 cells in a fashion similar to that of GZ17-6.02. Cells were transfected with a scrambled siRNA or with siRNAs combined to knock down the expression of HDACs1/2/3. After 12 h cells were centrifuged and fixed in situ, permeabilized, stained with the indicated validated primary antibodies and imaged with secondary antibodies carrying red- and green-fluorescent tags. The staining intensity of at least 100 cells per well/condition is determined in three separate studies. The data are the normalized amount of fluorescence set at 100% comparing intensity values for vehicle control (n = 3 +/− SD). # p < 0.05 greater than vehicle control; * p < 0.05 less than vehicle control. Tabular data are presented as a heat-map (Microsoft Excel: conditional formatting, color scales: green, yellow, red). Green indicates greater levels and red indicates lower levels of staining.

Similar articles

References

    1. Albagoush SA, Shumway C, Azevedo AM. Multiple Myeloma. In: StatPearls. Treasure Island (FL): StatPearls Publishing; 2024. - PubMed
    1. Becker N. Epidemiology of multiple myeloma. Recent Results Cancer Res. 2011; 183:25–35. 10.1007/978-3-540-85772-3_2. - DOI - PubMed
    1. Alexander DD, Mink PJ, Adami HO, Cole P, Mandel JS, Oken MM, Trichopoulos D. Multiple myeloma: a review of the epidemiologic literature. Int J Cancer. 2007. (Suppl 12); 120:40–61. 10.1002/ijc.22718. - DOI - PubMed
    1. Leng Y, Hu X, Li L, Nkwocha J, Satta T, Sharma K, Kmeiciak M, Zhou H, Zhang Z, Zhou L, Chen W, Grant S. Mechanisms underlying synergism between circularized tumor necrosis factor-related apoptosis inducing ligand and bortezomib in bortezomib-sensitive or -resistant myeloma cells. Hematol Oncol. 2022; 40:999–1008. 10.1002/hon.3045. - DOI - PMC - PubMed
    1. Richardson PG, Hideshima T, Anderson KC. Bortezomib (PS-341): a novel, first-in-class proteasome inhibitor for the treatment of multiple myeloma and other cancers. Cancer Control. 2003; 10:361–69. 10.1177/107327480301000502. - DOI - PubMed

MeSH terms