. 2024 May 28;15(6):460-473.
doi: 10.1093/procel/pwae006.

Immune rebalancing at the maternal-fetal interface of maternal SARS-CoV-2 infection during early pregnancy

Affiliations

Immune rebalancing at the maternal-fetal interface of maternal SARS-CoV-2 infection during early pregnancy

Chenxiang Xi et al. Protein Cell. .

Abstract

The current coronavirus disease 2019 (COVID-19) pandemic caused by severe acute respiratory syndrome coronavirus (SARS-CoV-2) remains a threat to pregnant women. However, the impact of early pregnancy SARS-CoV-2 infection on the maternal-fetal interface remains poorly understood. Here, we present a comprehensive analysis of single-cell transcriptomics and metabolomics in placental samples infected with SARS-CoV-2 during early pregnancy. Compared to control placentas, SARS-CoV-2 infection elicited immune responses at the maternal-fetal interface and induced metabolic alterations in amino acid and phospholipid profiles during the initial weeks post-infection. However, subsequent immune cell activation and heightened immune tolerance in trophoblast cells established a novel dynamic equilibrium that mitigated the impact on the maternal-fetal interface. Notably, the immune response and metabolic alterations at the maternal-fetal interface exhibited a gradual decline during the second trimester. Our study underscores the adaptive immune tolerance mechanisms and establishment of immunological balance during the first two trimesters following maternal SARS-CoV-2 infection.

Keywords: SARS; fetal; immune; interface; maternal; rebalancing.


Conflict of interest statement

The authors declare that they have no conflicts of interest.

Figures
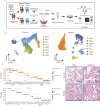
Figure 1.
Figure 1.
Characteristics of the study population and single-cell transcriptome profiles of the maternal-fetal interface. (A) Experimental design for the study. Placentas were collected from healthy donors and SARS-CoV-2-infected pregnancies. The decidua and chorion were separated and processed by mechanical and enzymatic methods to isolate single cells, which were multiplexed and profiled using single-cell RNA sequencing. (B) UMAP plots of first-trimester chorion tissues colored by cell type. (C) UMAP plots of first-trimester decidua tissues colored by cell type. (D) Bubble plots of key gene expression markers used for annotations of cells from first-trimester chorion and decidua tissues. (E) HE staining of decidua and chorion tissues from the first trimester. Scale bar = 200 μm.
Figure 2.
Figure 2.
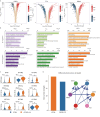
SARS-CoV-2 induces a wide range of antiviral responses at the maternal-fetal interface. (A) Volcano plot showing the DEGs in immune cells of decidual tissues from pregnant women infected with SARS-CoV-2. (B) Gene Ontology (GO) enrichment analysis of upregulated and downregulated DEGs in immune cells of decidua tissues from pregnant women infected with SARS-CoV-2. (C) Violin plots of select DEGs in different cell types of the first-trimester control and COVID-19 groups. Expression levels were transformed using logarithm. ** represents P < 0.01. (D) The differential interaction strength between immune cells and trophoblast cells. All the interaction strength between specific cells decreased in the COVID-19 group.
Figure 3.
Figure 3.
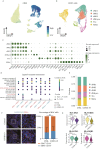
SARS-CoV-2 leads to limited activation of immune cells. (A) UMAP plot showing the expression level of CD45 in cells from first-trimester decidua tissues. (B) UMAP plot of CD45+ cells from first-trimester decidua tissues. (C) Bubble plots of key gene expression markers used for annotations of immune cells from first-trimester decidua tissues. (D) Bubble plot showing ligand–receptor interactions among NKCs and MACs of the first-trimester control and COVID-19 groups. (E) Stacked bar plot showing percentages of different immune cell types between the first-trimester control and COVID-19 groups. (F) Immunofluorescence staining of CD45 and CD14 (MAC markers) in the decidua (left panel) and a bar plot showing the percentage of MACs between the first-trimester control and COVID-19 groups. Scale bar = 50 μm. (G) Violin plots of select DEGs in MACs of the first-trimester control and COVID-19 groups. Expression levels were transformed using logarithm. ** represents P < 0.01.
Figure 4.
Figure 4.
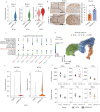
Immune tolerance in trophoblast cells is enhanced. (A) Violin plots of HLA-G in trophoblast cells of the first-trimester control and COVID-19 groups. Expression levels were transformed using logarithm. ** represents P < 0.01. (B) Immunohistochemistry and the immunohistochemistry score of HLA-G in chorion tissues of the first-trimester control and COVID-19 groups. Scale bar = 100 μm. (C) Bubble plot showing ligand–receptor interactions among NKCs and EVTs of the first-trimester control and COVID-19 groups. (D) RNA velocity streamlines embedded on the UMAP plot of SCTs, EVTs, and VCTs from first-trimester chorion tissues. (E) Violin plots of select DEGs in SCTs of the first-trimester control and COVID-19 groups. Expression levels were transformed using logarithm. ** represents P < 0.01. (F) Box plot showing the cytokine scores of different cell types between the control and COVID-19 groups. The mean ± SD of each group is shown in the plot.
Figure 5.
Figure 5.
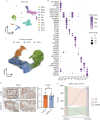
The impact of SARS-CoV-2 on the maternal-fetal interface gradually diminishes with development. (A) UMAP plots of second-trimester placental tissues colored by cell type. (B) Bubble plots of key gene expression markers used for annotation of cells from second-trimester placental tissues. (C) RNA velocity streamlines embedded on the UMAP plot of SCTs, EVTs and VCTs from first-trimester chorion tissues and second-trimester placental tissues. (D) Immunohistochemistry and the immunohistochemistry score of HLA-G in the placental tissues of the second-trimester control and COVID-19 groups. Scale bar = 100 μm. (E) Sankey plot showing DEG changes in EVTs between first-trimester and second-trimester tissues. NS means no significance.
Figure 6.
Figure 6.
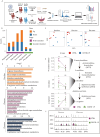
The metabolic changes caused by SARS-CoV-2 infection gradually diminish during placental development. (A) Experimental design for untargeted metabolomic analysis. (B) The stacked bar plot showing the counts of differentially regulated metabolites in each group. (C) PCA plots of the samples from three tissues. (D) KEGG analysis of differentially regulated metabolites from three tissues. (E) The diagram of arginine biosynthesis and the normalized levels of some metabolites in control and COVID-19 groups from first-trimester chorion tissues and second-trimester placental tissues. * and ** represent P < 0.05 and P < 0.01, respectively. (F) Violin plots of genes related to arginine biosynthesis in control and COVID-19 groups from first-trimester chorion tissues and second-trimester placental tissues. Expression levels were transformed using logarithm.

Similar articles

Cited by

References

    1. Abu-Raya B, Kollmann TR, Marchant A. et al.. The immune system of HIV-exposed uninfected infants. Front Immunol 2016;7:383. - PMC - PubMed
    1. Adebayo A, Varzideh F, Wilson S. et al.. l-Arginine and COVID-19: an update. Nutrients 2021;13:3951. - PMC - PubMed
    1. Amiot L, Vu N, Samson M.. Immunomodulatory properties of HLA-G in infectious diseases. J Immunol Res 2014;2014:298569. - PMC - PubMed
    1. Ashkar AA, Croy BA.. Interferon-gamma contributes to the normalcy of murine pregnancy. Biol Reprod 1999;61:493–502. - PubMed
    1. Bailey CC, Zhong G, Huang IC. et al.. IFITM-family proteins: the cell’s first line of antiviral defense. Annu Rev Virol 2014;1:261–283. - PMC - PubMed