

Drought, temperature, and moisture availability: understanding the drivers of isotopic decoupling in native pine species of the Nepalese Himalaya
- PMID: 38441667
- PMCID: PMC11108894
- DOI: 10.1007/s00484-024-02647-z
Drought, temperature, and moisture availability: understanding the drivers of isotopic decoupling in native pine species of the Nepalese Himalaya
Abstract
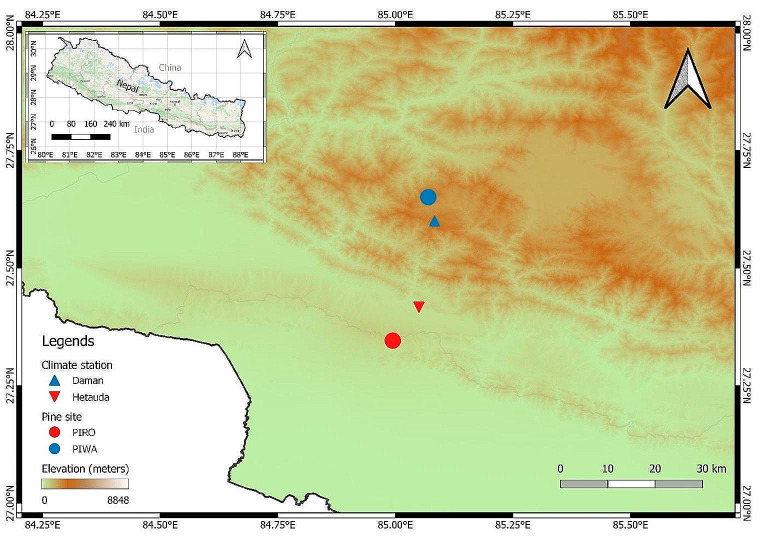
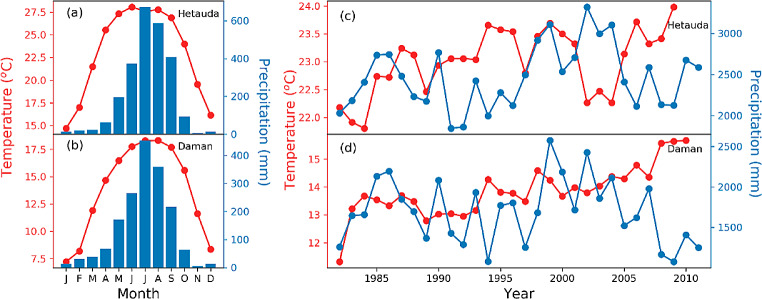
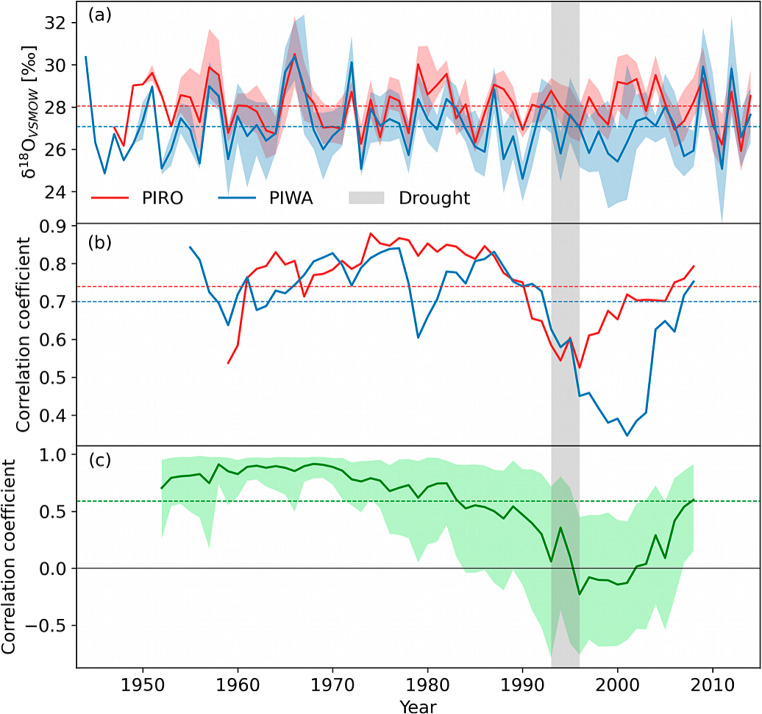
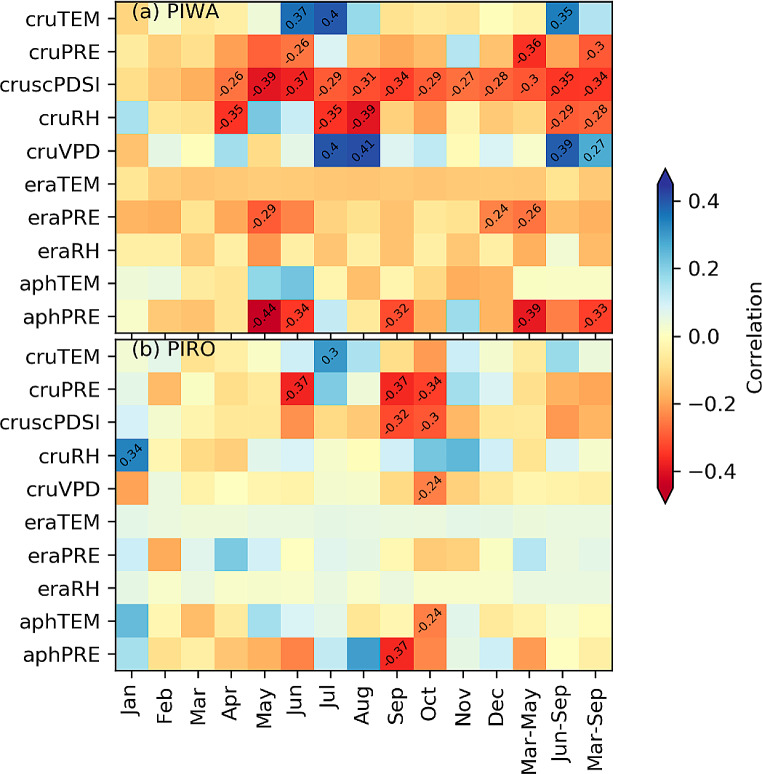
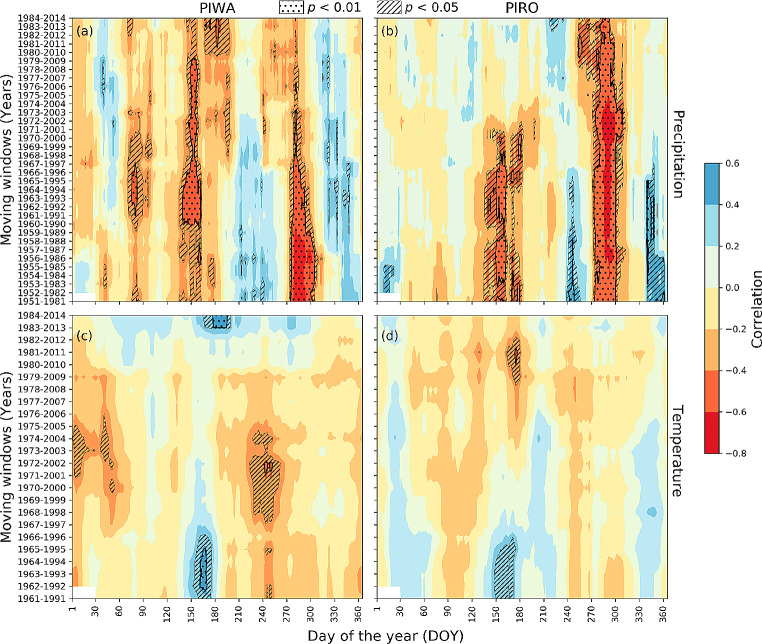
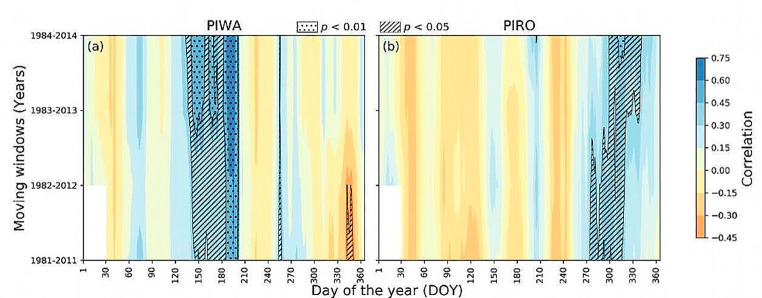
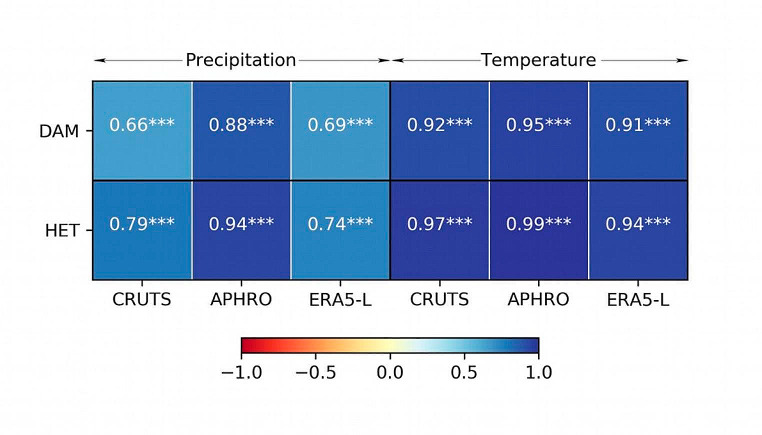
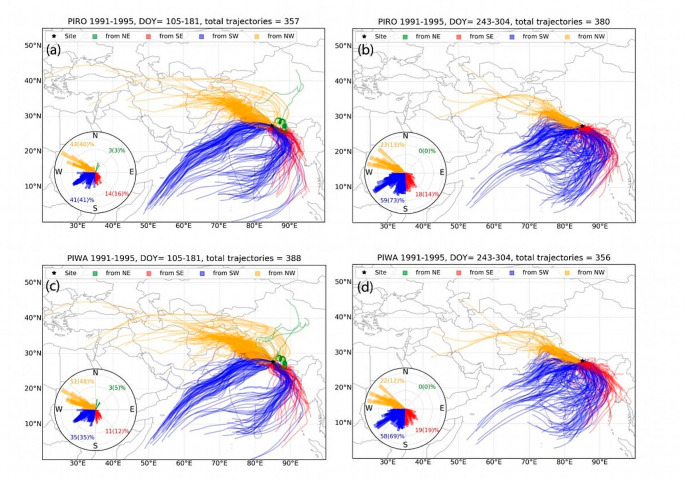
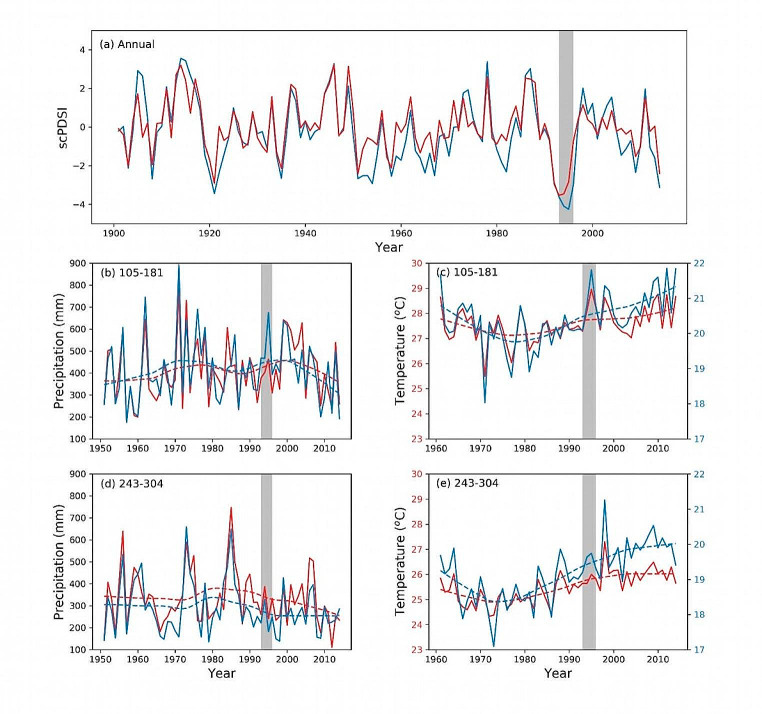
The Himalayas experienced long-term climate changes and recent extreme weather events that affected plant growth and the physiology of tree species at high-elevation sites. This study presents the first statistically robust δ18OTR chronologies for two native pine species, Pinus roxburghii, and Pinus wallichiana, in the lower Nepalese Himalaya. The isotope chronologies exhibited 0.88‰ differences in overall mean isotope values attributed to varying elevations (460-2000 m asl). Comparative analysis of climate response using data sets from different sources and resolutions revealed the superiority of the APHRODITE (Asian Precipitation - Highly-Resolved Observational Data Integration Towards Evaluation) data set calibrated for the South Asian Summer Monsoon (SASM)-dominated region. Both species exhibited negative correlations with monsoon precipitation and positive correlations with temperature. However, during the peak monsoon season (July-August), daily resolved climate data disentangled statistically insignificant relationships, and revealed that δ18OTR is influenced by atmospheric moisture. Both congeneric species showed a decoupling between the chronologies after 1995. However, no significant change in air moisture origin and monsoon regime between the study sites was observed, indicating a consistent dominant moisture source during different monsoon seasons. Besides, we also observed the decreased inter-series correlation of both δ18OTR chronologies after 1995, with P. wallichiana experiencing a steeper decrease than P. roxburghii. The weakening correlations between and within the chronologies coincided with a regional drought during 1993-1995 in both sites, highlighting the strong regulation of local climate on the impact of regional extreme climate events. Our findings emphasise the importance of employing climate data with optimal spatial and temporal resolution for improved δ18OTR-climate relationships at the intra-annual scale while considering the influence of site-specific local environmental conditions. Assessing climate data sets with station data is vital for accurately interpreting climate change's impact on forest response and long-term climate reconstructions.
Keywords: Isotopic decoupling; Local environmental effects; Native pine species; Nepalese Himalaya; Precipitation; Stable oxygen isotopes; Temperature.
© 2024. The Author(s).
Figures
References
-
- Altieri S, Mereu S, Cherubini P, Castaldi S, Sirignano C, Lubritto C, Battipaglia G. Tree-ring carbon and oxygen isotopes indicate different water use strategies in three Mediterranean shrubs at Capo Caccia (Sardinia, Italy) Trees. 2015;29:1593–1603. doi: 10.1007/s00468-015-1242-z. - DOI
-
- An W, Liu X, Hou S, Zeng X, Sun W, Wang W, Wang Y, Xu G, Ren J. Unstable relationships between tree ring δ18O and climate variables over southwestern China: possible impacts from increasing central Pacific SSTs. Theoret Appl Climatol. 2019;136:391–402. doi: 10.1007/s00704-018-2483-8. - DOI
-
- Aryal S, Bhuju DR, Kharal DK, Gaire NP, Dyola N. Climatic upshot using growth pattern of Pinus roxburghii from western Nepal. Pak J Bot. 2018;50:579–588.
-
- Baker JC, Hunt SF, Clerici SJ, Newton RJ, Bottrell SH, Leng MJ, Heaton TH, Helle G, Argollo J, Gloor M, Brienen RJ. Oxygen isotopes in tree rings show good coherence between species and sites in Bolivia. Glob Planet Change. 2015;133:298–308. doi: 10.1016/j.gloplacha.2015.09.008. - DOI
MeSH terms
Substances
LinkOut - more resources
Full Text Sources
