. 2024 Mar 19;63(6):743-753.
doi: 10.1021/acs.biochem.4c00009. Epub 2024 Mar 5.

Lipid-Binding Regions within PKC-Related Serine/Threonine Protein Kinase N1 (PKN1) Required for Its Regulation

Affiliations

Lipid-Binding Regions within PKC-Related Serine/Threonine Protein Kinase N1 (PKN1) Required for Its Regulation

Jason L J Lin et al. Biochemistry. .

Abstract

PKC-related serine/threonine protein kinase N1 (PKN1) is a protease/lipid-activated protein kinase that acts downstream of the RhoA and Rac1 pathways. PKN1 comprises unique regulatory, hinge region, and PKC homologous catalytic domains. The regulatory domain harbors two homologous regions, i.e., HR1 and C2-like. HR1 consists of three heptad repeats (HR1a, HR1b, and HR1c), with PKN1-(HR1a) hosting an amphipathic high-affinity cardiolipin-binding site for phospholipid interactions. Cardiolipin and C18:1 oleic acid are the most potent lipid activators of PKN1. PKN1-(C2) contains a pseudosubstrate sequence overlapping that of C20:4 arachidonic acid. However, the cardiolipin-binding site(s) within PKN1-(C2) and the respective binding properties remain unclear. Herein, we reveal (i) that the primary PKN1-(C2) sequence contains conserved amphipathic cardiolipin-binding motif(s); (ii) that trimeric PKN1-(C2) predominantly adopts a β-stranded conformation; (iii) that two distinct types of cardiolipin (or phosphatidic acid) binding occur, with the hydrophobic component playing a key role at higher salt levels; (iv) the multiplicity of C18 fatty acid binding to PKN1-(C2); and (v) the relevance of our lipid-binding parameters for PKN1-(C2) in terms of kinetic parameters previously determined for the full-length PKN1 enzyme. Thus, our discoveries create opportunities to design specific mammalian cell inhibitors that disrupt the localization of membrane-associated PKN1 signaling molecules.


Conflict of interest statement

The authors declare no competing financial interest.

Figures

Figure 1
Figure 1
Primary structure of rat PKN1. (A) PKN1 consists of a unique regulatory domain comprising HR1 featuring three heptad repeats (HR1a, HR1b, and HR1c) and a C2-like domain, a hinge region, a PKC homologous kinase (catalytic) domain, and a short C-terminal extension. PKN1-(HR1a) contains a pseudosubstrate motif that overlaps with an amphipathic cardiolipin-binding (high-affinity) site. A phosphatidylcholine-binding site was also identified within PKN1-(HR1b). Three PKN1 constructs including PKN1-(C2)-(342–605), the focus of this study, PKN1-(310–473), and PKN1-(25–485) were expressed as recombinant proteins. A conserved nPKC C2-like pseudosubstrate motif [PKN1-(488–502)] has been identified [highlighted in yellow in (B)] as overlapping with the arachidonic acid (C20:4) binding region, i.e., [PKN1-(455–511)]. An antibody raised against the hinge region [PKN1-(539–556)] was used for immunostaining analysis. (B) Five tryptophan residues in PKN1-(C2), i.e., Trp345, Trp410, Trp418, Trp438, and Trp518, served as fluorophores (red letters) for intrinsic fluorescence spectrometry analysis. The PKN1-(C2) pseudosubstrate sequence is highlighted in yellow. Conserved amphipathic L(I)R(K)X-like motifs (blue letters), similar to those present in the HR1 domain, are also present in the PKN1-(C2) sequence.
Figure 2
Figure 2
Expression and purification of the PKN1-(C2) protein. (A) PKN1-(C2) was bacterially expressed and recovered from inclusion bodies before being solubilized and affinity-purified in the presence of 8 M urea. Lane 1: cell extracts before induction. Lane 2: cell extracts after induction. Lane 3: induced cell extracts in 8 M urea. Lane 4: the breakthrough fraction. Lane 5: the wash fraction. Lane 6: the affinity-purified C2 polypeptide. (B) Left: Refolding of the PKN1-(C2) polypeptide (1.5 μM) was monitored by intrinsic tryptophan fluorescence spectrometry. The λmax values of the denatured polypeptide (dashed gray line) and refolded protein (solid black line) are 348.5 and 336.6 nm, respectively. Right: Normalized emission fluorescence spectra of PKN1-(C2) in phosphate buffer pH7.4 containing 25 mM (dashed gray line) or 300 mM (solid black line) NaCl at 25 °C. (C) Refolded PKN1-(C2) predominantly eluted in a trimeric conformation under peak “b” in S-200 size-exclusion chromatography (Ve 8.2 mL, 107 kDa), together with a minor shoulder peak “a” (Ve 7.3 mL, 138 kDa) (Table S1). The identity of PKN1-(C2) was confirmed by anti-PKN1-(539–556) immunostaining. (D) Upper: Two molecular ions were detected with apparent masses of 31,625 [M + H]+ and 15,809 [M + H]2+. Lower: In addition to a 31,603 Da peak, a trace of a 63,621 Da (inset) species was detected.
Figure 3
Figure 3
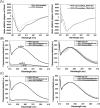
Structural impacts of phospholipid binding to PKN1-(C2). (A) Left: PKN1-(C2) (1.7 μM) was analyzed by CD spectroscopy in 20 mM phosphate buffer pH 7.4 and 25 mM NaCl at 25 °C. The spectra were recorded in the absence (solid black line) or presence (dashed gray line) of 6.6 μM cardiolipin. Right: The CD spectra of premixed PKN1-(C2) (1.7 μM) and cardiolipin (6.6 μM) in the presence of 25 mM (dashed gray line) or 150 mM (dashed black line) NaCl. (B,C) Left: The original intrinsic tryptophan fluorescence spectra of 0.4 μM PKN1-(C2) in the absence (solid black line) or presence of cardiolipin (solid pale gray line), phosphatidic acid (solid dark gray line), phosphatidylcholine (dashed dark gray line), or phosphatidylserine (dashed pale gray line). Right: the fluorescence intensity of the respective protein–lipid binding signal was normalized to the λmax value of the PKN1-(C2) only in fluorescence emission spectra. A protein/lipid molar ratio of 1:10 was used in all experiments.
Figure 4
Figure 4
Distinct phospholipid-binding characteristics of PKN1-(C2). Interactions between PKN1-(C2) and phospholipids were measured as a function of the intrinsic tryptophan fluorescence quenching. PKN1-(C2) (0.3 μM) was titrated with phospholipids in a buffer containing 20 mM phosphate buffer, pH7 4, and 25 mM NaCl at 25 °C. The protein–phospholipid binding curves are marked by closed circles for cardiolipin (A), open circles for phosphatidic acid (B), closed triangles for phosphatidylcholine (C), and open triangles for phosphatidylserine (D). In (A) and (B), the bars in the graph marked as CsI and CsII define the range of free lipid concentrations for either type I or II interactions with PKN1-(C2). Lipid-to-protein stoichiometries were measured empirically by extrapolation with linear segments from their respective titration curves, which in both cases yielded a lipid-to-protein binding molar ratio. Scatchard plot analyses (inset) were conducted on the binding data, and the binding parameters are summarized in Table 1.
Figure 5
Figure 5
Influence of ionic strength on the binding curves for PKN1-(C2) with either cardiolipin or phosphatidylcholine. Left: the interactions between PKN1-(C2) and (A) cardiolipin or (B) phosphatidylcholine were measured as a function of intrinsic tryptophan quenching fluorescence. PKN1-(C2) at 0.4 or 0.17 μM was titrated with cardiolipin and phosphatidylcholine in a buffer containing 20 mM phosphate buffer pH 7.4 with either 25 mM NaCl (closed symbols) or 300 mM NaCl (open symbols) at 25 °C. Right: Scatchard plot analyses were conducted on the binding data, and the binding parameters are summarized in Table 2.
Figure 6
Figure 6
Interactions between PKN1-(C2) and C18 fatty acids. Emission fluorescence spectra of 0.3 μM PKN1-(C2) in the absence or presence of (A) oleic acid (closed circles) or (C) stearic acid (open circles) in 20 mM phosphate buffer pH 7.4 and 25 mM NaCl at 25 °C. The molar ratio of fatty acid to protein was 20. The binding curve for PKN1-(C2) with either (B) oleic acid or (D) stearic acid was measured as a function of the intrinsic tryptophan quenching fluorescence. Scatchard plots (right panel), derived from the binding curves shown in (A) or (C), are based on estimated stoichiometry, with the line of best fit for the binding data shown. The binding parameters are summarized in Table 3.
Figure 7
Figure 7
Proposed model for the regulatory and activation steps of PKN1. Proposed simplified model for the HR1- and C2-like-mediated regulatory and activation steps of PKN1. Step 1: the cytosolic PKN1 enzyme is recruited to the membrane via the phosphatidylcholine-binding site on its HR1b subdomain. Step 2: binding of the acidic phospholipid components to the high-affinity amphipathic binding sequence on PKN1-(HR1a) partially relieves the autoinhibitory effect imposed by the HR1 pseudosubstrate motif. Step 3: PKN1-(C2) interacts with the membrane to disrupt the C2-like pseudosubstrate sequence, thereby releasing the catalytic domain to expose the active site. Step 4: the active site of the PKN1 catalytic domain becomes accessible for substrate entry and, consequently, binding and phosphorylation.

Similar articles

References

    1. Pearce L. R.; Komander D.; Alessi D. R. The nuts and bolts of AGC protein kinases. Nat. Rev. Mol. Cell Biol. 2010, 11, 9–22. 10.1038/nrm2822. - DOI - PubMed
    1. Parker P. J.; Brown S. J.; Calleja V.; Chakravarty P.; Cobbaut M.; Linch M.; Marshall J. J. T.; Martini S.; McDonald N. Q.; Soliman T.; et al. Equivocal, explicit and emergent actions of PKC isoforms in cancer. Nat. Rev. Cancer 2021, 21, 51–63. 10.1038/s41568-020-00310-4. - DOI - PubMed
    1. Leonard T. A.; Różycki B.; Saidi L. F.; Hummer G.; Hurley J. H. Crystal Structure and Allosteric Activation of Protein Kinase C βII. Cell 2011, 144, 55–66. 10.1016/j.cell.2010.12.013. - DOI - PMC - PubMed
    1. Palmer R. H.; Ridden J.; Parker P. J. Cloning and expression patterns of two members of a novel protein-kinase-C-related kinase family. Eur. J. Biochem. 1995, 227, 344–351. 10.1111/j.1432-1033.1995.tb20395.x. - DOI - PubMed
    1. Peng B.; Morrice N. A.; Groenen L. C.; Wettenhall R. H. Phosphorylation Events Associated with Different States of Activation of a Hepatic Cardiolipin/Protease-activated Protein Kinase. J. Biol. Chem. 1996, 271, 32233–32240. 10.1074/jbc.271.50.32233. - DOI - PubMed

Publication types