. 2024 Mar 5;9(7):e169830.
doi: 10.1172/jci.insight.169830.

CD93 maintains endothelial barrier function and limits metastatic dissemination

Affiliations

CD93 maintains endothelial barrier function and limits metastatic dissemination

Kalyani Vemuri et al. JCI Insight. .

Abstract

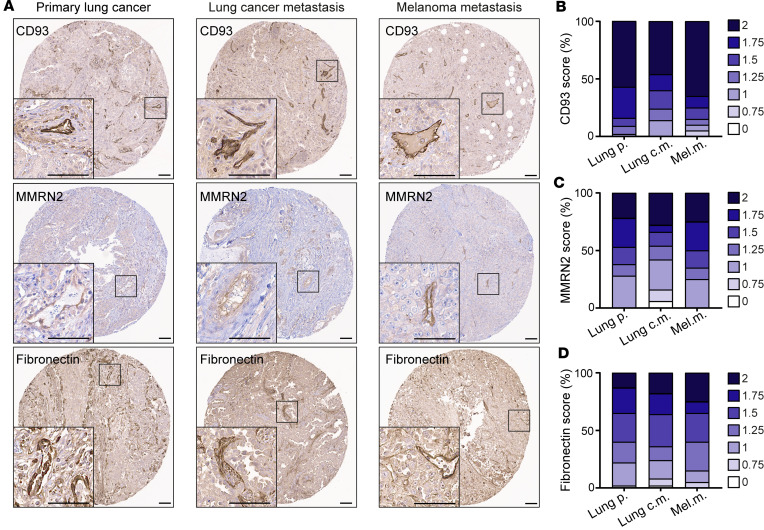
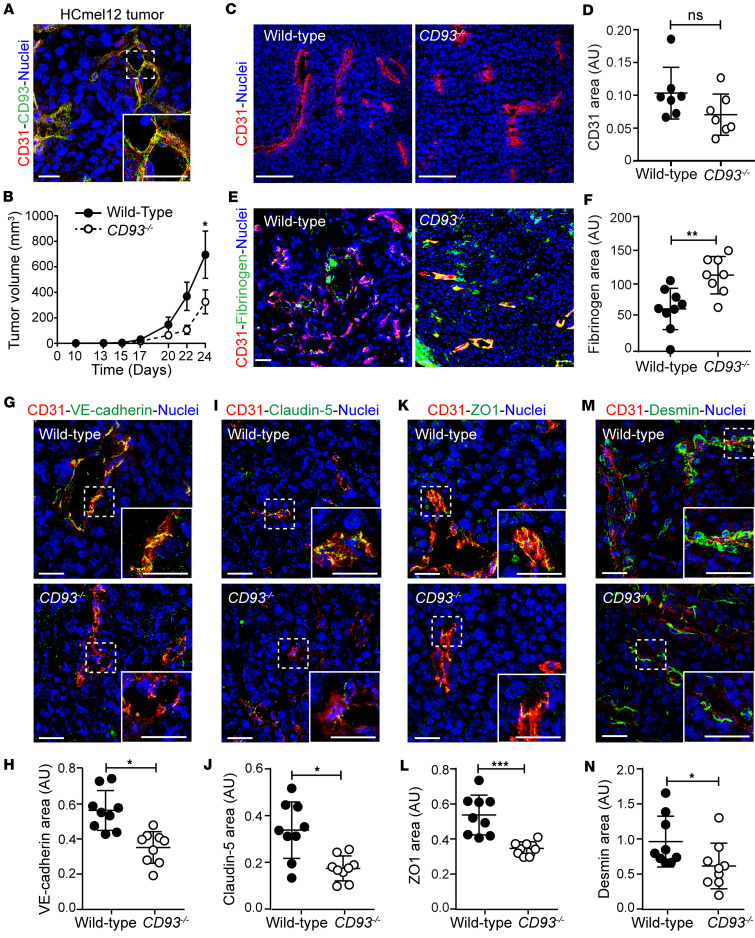
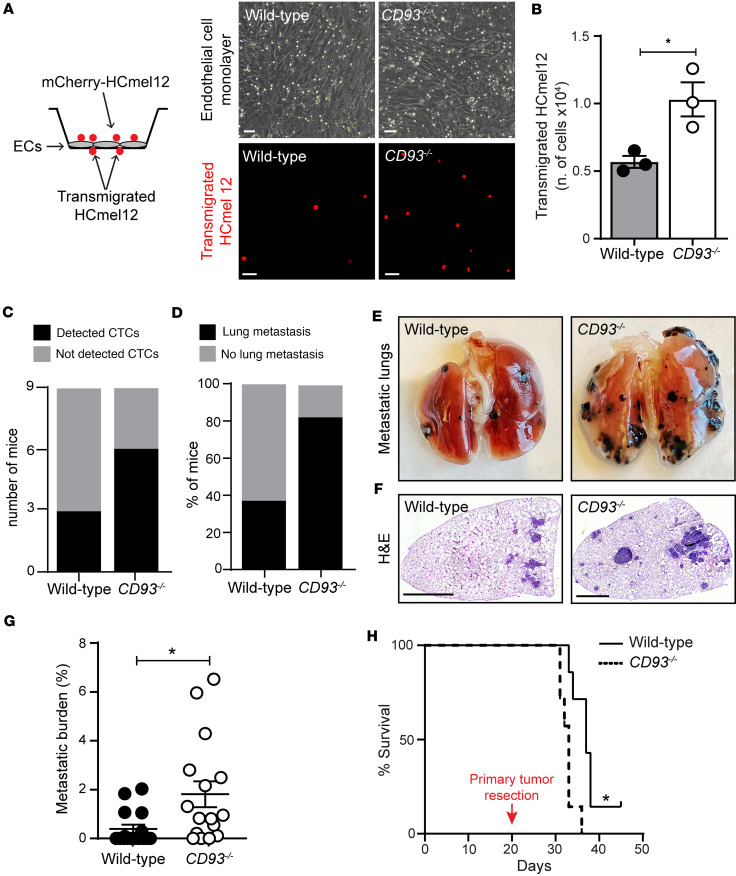
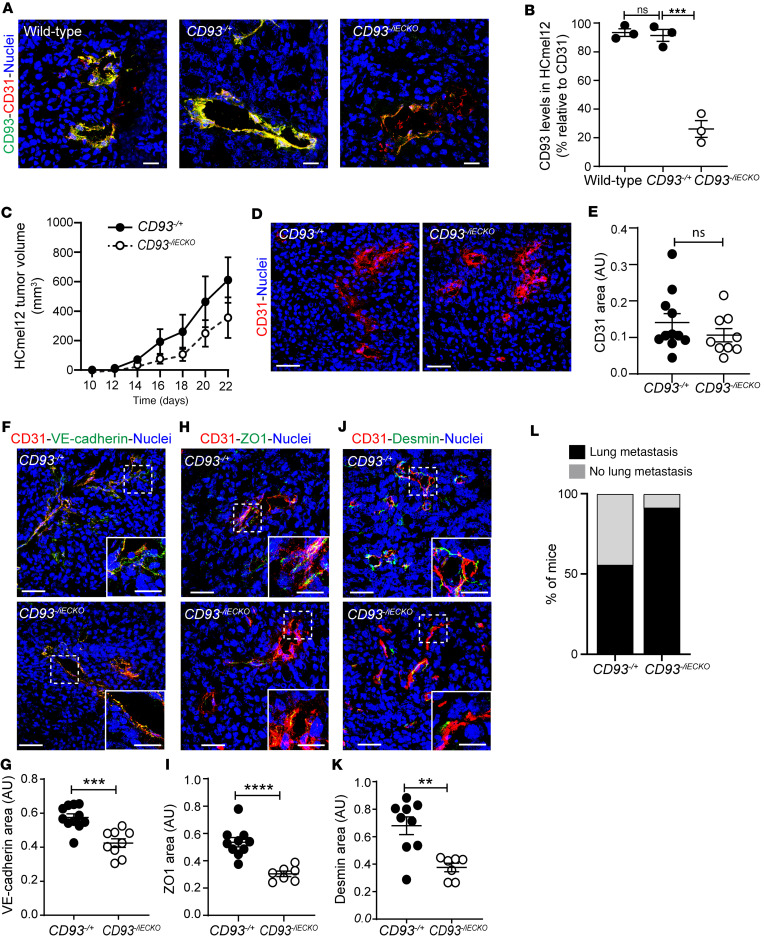
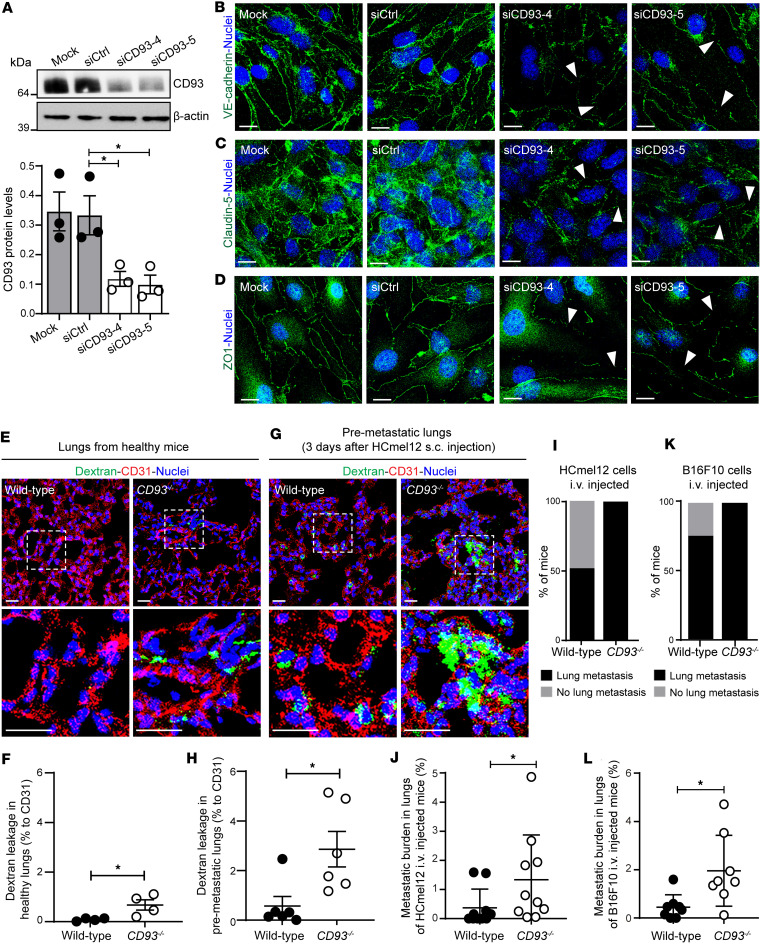
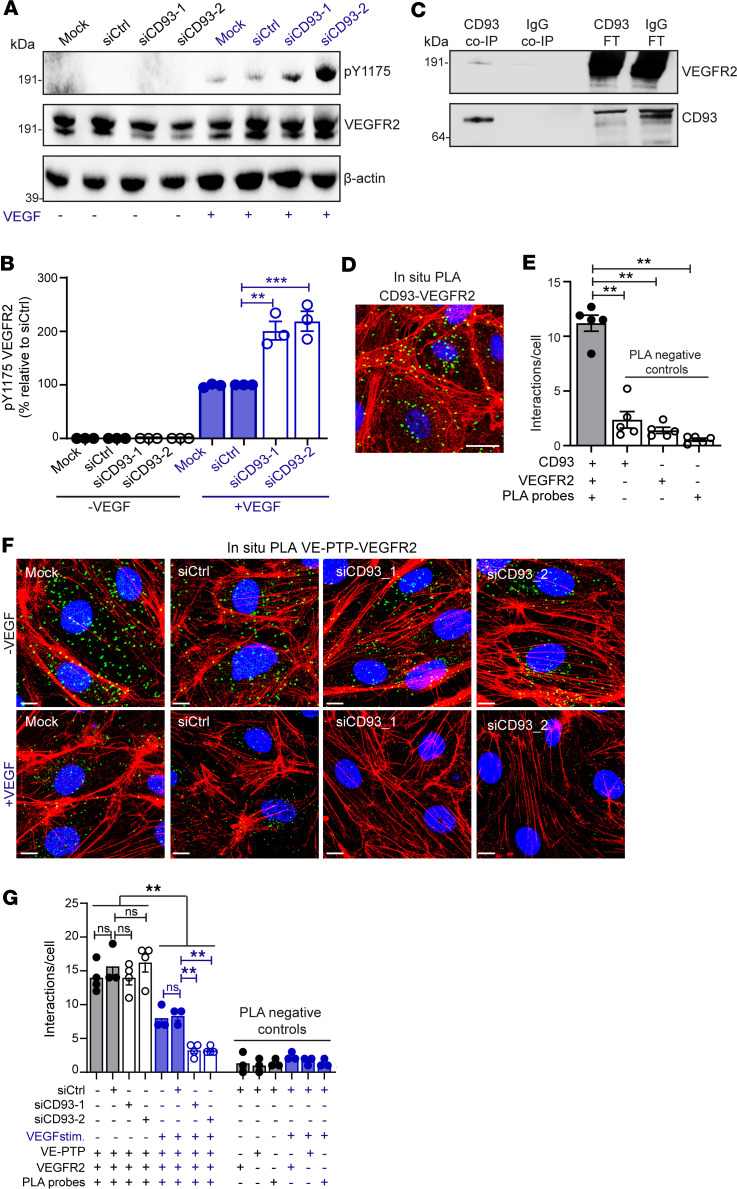
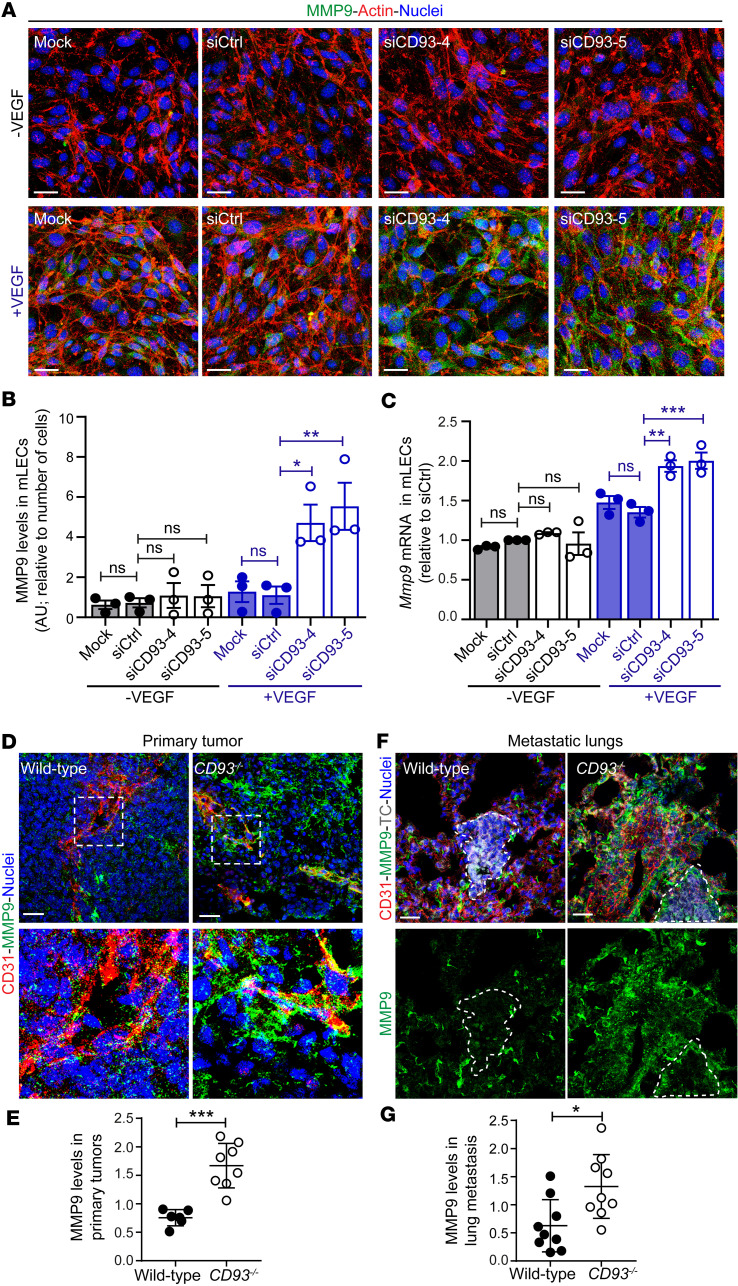
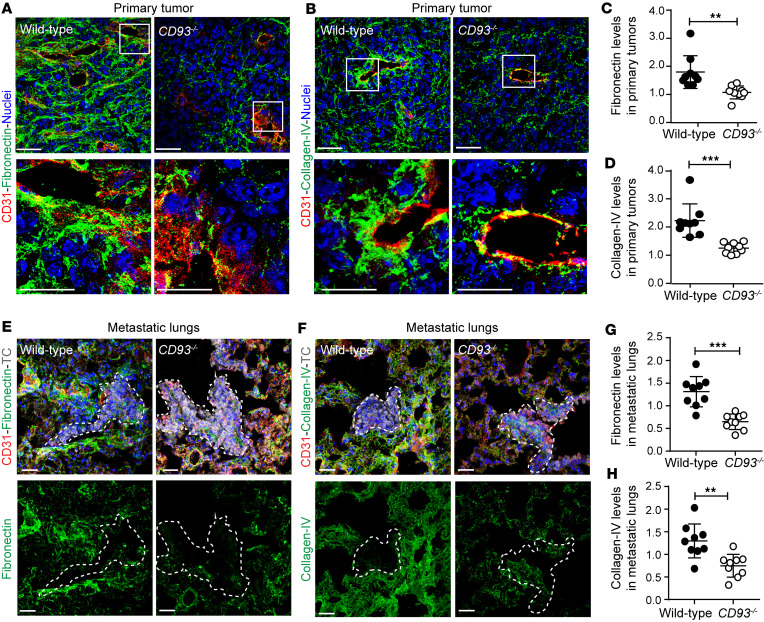
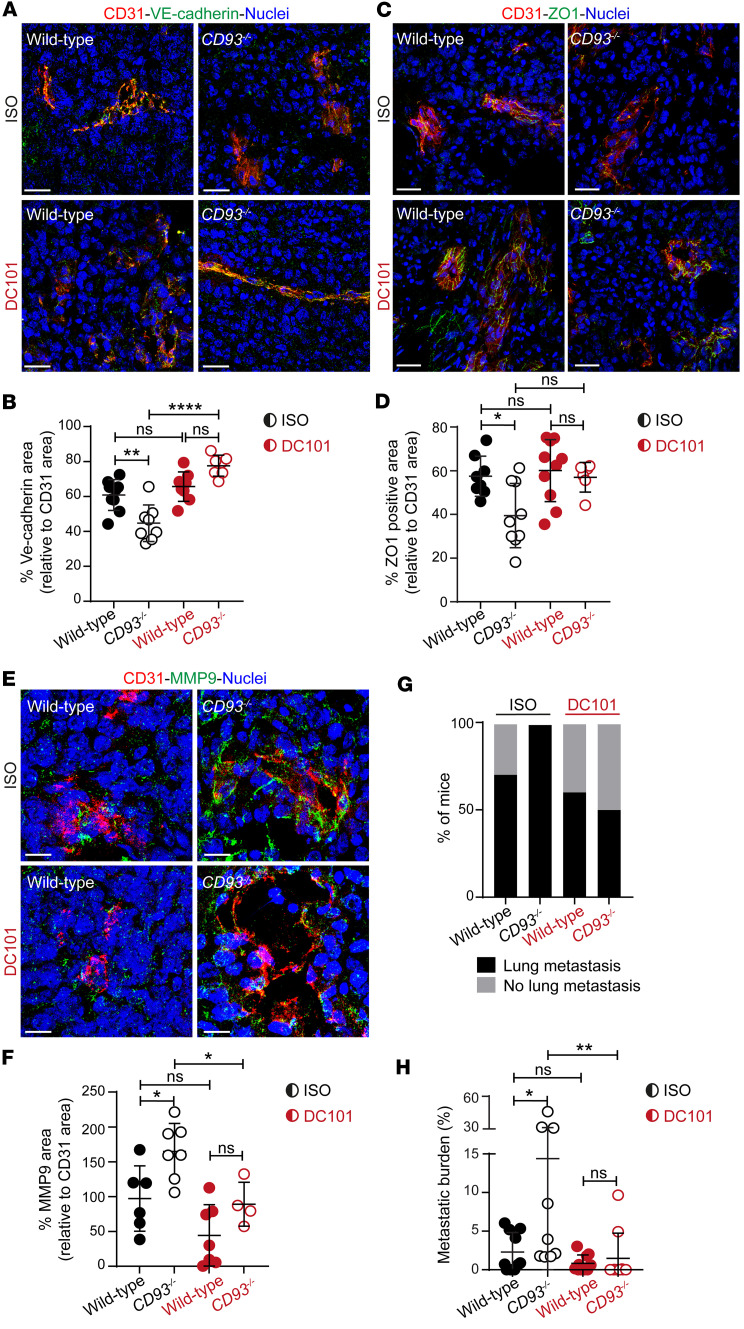
Compromised vascular integrity facilitates extravasation of cancer cells and promotes metastatic dissemination. CD93 has emerged as a target for antiangiogenic therapy, but its importance for vascular integrity in metastatic cancers has not been evaluated. Here, we demonstrate that CD93 participates in maintaining the endothelial barrier and reducing metastatic dissemination. Primary melanoma growth was hampered in CD93-/- mice, but metastatic dissemination was increased and associated with disruption of adherens and tight junctions in tumor endothelial cells and elevated expression of matrix metalloprotease 9 at the metastatic site. CD93 directly interacted with vascular endothelial growth factor receptor 2 (VEGFR2) and its absence led to VEGF-induced hyperphosphorylation of VEGFR2 in endothelial cells. Antagonistic anti-VEGFR2 antibody therapy rescued endothelial barrier function and reduced the metastatic burden in CD93-/- mice to wild-type levels. These findings reveal a key role of CD93 in maintaining vascular integrity, which has implications for pathological angiogenesis and endothelial barrier function in metastatic cancer.

Keywords: Endothelial cells; Extracellular matrix; Melanoma; Oncology; Vascular biology.


Figures

Figure 1
Figure 1. CD93, MMRN2, and fibronectin are highly expressed in the blood vessels of primary tumors and metastases.
(A) Immunohistochemical staining of CD93, MMRN2, and fibronectin in human tissue microarrays of primary lung cancer (n = 60), metastases originating from lung cancer (n = 50), and melanoma metastases (n = 20). Scale bars: 100 μm. Graphs represent the average of a semiquantitative scoring of CD93+ (B), MMRN2+ (C), and fibronectin+ (D) vessels performed in tumor cores of each patient by 2 researchers in a blinded fashion on a scale of 0 to 2 (0 = no vessel staining, 1 = medium intensity, and 2 = high intensity). Lung p., lung primary tumors; Lung c.m., lung cancer metastases; Mel.m., melanoma metastases.
Figure 2
Figure 2. CD93 deficiency impairs subcutaneous HCmel12 melanoma growth and tumor vascular integrity.
(A) HCmel12 tumor stained for CD93 (green), CD31 (red), and with Hoechst (blue). Scale bars: 20 μm. (B) Tumor growth in wild-type and CD93–/– mice (n = 16/group). *P < 0.05 by 2-way ANOVA. (C) Representative images of tumor vessels stained with Hoechst (blue) and for CD31 (red). Scale bars: 100 μm. (D) Quantification of CD31+ area in wild-type and CD93–/– tumors (n = 7/group, 6–8 fields of view/sample). (E) Representative images of fibrinogen leakage (green) and vessels (CD31, red). Scale bar: 150 μm. (F) Quantification of tumor vessel leakage in wild-type and CD93–/– mice (tumor tilescans, n = 8–9/group). Nuclei are visualized by Hoechst (blue). AU, arbitrary units; NS, not significant. **P < 0.01 by 2-tailed t test. Immunofluorescence images for the endothelial junction markers VE-cadherin (green) (G), claudin-5 (green) (I), ZO1 (green) (K), and desmin (green) (M) in HCmel12 tumors. (H, J, L, and N) Quantification graphs represent the area covered by the analyzed endothelial junction markers normalized to the CD31+ area in wild-type (n = 9, minimum of 5 fields of view/sample) and CD93–/– (n = 9 minimum of 5 fields of view/sample) tumors. Scale bars: 20 μm. *P < 0.05, ***P < 0.001 by 2-tailed t test. Values represent mean ± SEM.
Figure 3
Figure 3. Deletion of CD93 increases endothelial transmigration of tumor cells and promotes metastasis.
(A) In vitro permeability assay of HCmel12 cells transmigrating through wild-type and CD93–/– endothelial cell monolayers. Scale bars: 50 μm. (B) Graph represents the number of transmigrated tumor cells (3 independent experiments). *P < 0.05 by 2-tailed t test. (C) Number of wild-type and CD93–/– mice showing detectable levels of mCherry+ circulating tumor cells (CTCs) in the blood 19 days after subcutaneous inoculation of mCherry-HCmel12 cells (n = 9/group). mCherry expression was detected in the circulation by qPCR. (D) Percentage of mice that developed lung metastasis 24 days after subcutaneous inoculation of HCmel12 cells (n = 16/group). Representative images of metastatic lungs (E) and H&E-stained lung sections (F). Scale bars: 1 mm. (G) Metastatic burden per mouse (percentage of lung tissue area covered by metastases; lung tilescans of n = 16/group). *P < 0.05 by Mann-Whitney test. (H) Survival of wild-type and CD93–/– mice (n = 7/group) after tumor resection. *P < 0.05 by Gehan-Breslow-Wilcoxon test. Values represent mean ± SEM.
Figure 4
Figure 4. Endothelial cell–specific CD93 deletion impairs HCmel12 vascular integrity and increases metastatic spread.
(A) Immunofluorescent staining showing CD93 levels (green) in HCmel12 tumors implanted in wild-type, CD93 heterozygous (CD93–/+), and CD93–/iECKO mice. Vessels are detected by CD31 (red) and nuclei by Hoechst (blue). Scale bars: 20 μm. (B) Quantification of CD93 levels in HCmel12 vessels of wild-type (n = 3, 3 fields of view/sample), CD93–/+ (n = 3, 3 fields of view/sample), and CD93–/iECKO (n = 3, 3 fields of view/sample) mice. ***P < 0.001 by 1-way ANOVA with Tukey′s multiple-comparison test. NS, not significant. (C) Tumor growth in CD93–/+ and CD93–/iECKO mice (n = 11/group). (D) Representative images of tumor vessels stained for CD31 (red). Scale bars: 25 μm. (E) Quantification of CD31+ area in CD93–/+ and CD93–/iECKO mice (n = 11/group, minimum of 4 fields of view/sample). (F) Representative images of VE-cadherin (green), (H) ZO1 (green), and (J) desmin (green) in HCmel12 tumors from in CD93–/+ and CD93–/iECKO mice. Scale bars: 20 μm and 10 μm (high-magnification insets in F, H, and J). (G, I, and K) Quantification graphs of VE-cadherin, ZO1, and desmin levels normalized by CD31+ area. CD93–/+ (n = 9, minimum of 4 fields of view/sample), CD93–/iECKO (n = 11, minimum of 4 fields of view/sample). AU, arbitrary units. **P < 0.01, ***P < 0.001, ****P < 0.0001 by 2-tailed t test. (L) Percentage of mice that developed lung metastasis 22 days after subcutaneous inoculation of HCmel12 cells (n = 11/group). Values represent mean ± SEM.
Figure 5
Figure 5. CD93 knockdown impairs endothelial junctions in murine lung endothelial cells and promotes vascular permeability and tumor cell extravasation in lungs.
(A) Western blot for CD93 and β-actin indicating the silencing efficiency of CD93 siRNAs in the mouse lung endothelial cells (mLECs). Values shown in the graph represent mean ± SEM (3 independent experiments). *P < 0.05 by 1-way ANOVA with Dunnett’s multiple-comparison test. Immunofluorescent staining of VE-cadherin (green) (B), claudin5 (green) (C), and ZO1 (green) (D) in control (Mock and siCtrl) and CD93 siRNA–silenced (siCD93-4 and siCD93-5) mLECs. Scale bars: 20 μm. Arrowheads point toward the disrupted endothelial junctions. Nuclei are visualized by Hoechst staining (blue). Representative images of dextran leakage in healthy (E) and in premetastatic lungs (G) in wild-type and CD93–/– mice. Scale bars: 20 μm. (F and H) Quantification of dextran leakage in wild-type and CD93–/– mice (n = 4–6/group, 4 fields of view/sample). Nuclei are visualized by Hoechst (blue). *P < 0.05 by 2-tailed t test. (I and K) Percentage of mice that developed metastases after intravenous injection (i.v.) of HCmel12 cells (I) or B16F10 cells (K). (J and L) Percentage of lung tissue area covered by metastases after i.v. injection of HCmel12 (J) and B16F10 cells (L). *P < 0.05 by Mann-Whitney test. Values represent mean ± SEM.
Figure 6
Figure 6. CD93 interacts with VEGFR2 and attenuates its phosphorylation in response to VEGF by promoting VE-PTP–VEGFR2 interaction.
(A) Western blot to detect p-Y1175 VEGFR2, total VEGFR2, and β-actin in HDBECs stimulated with/without VEGF (10 ng/mL, 5 minutes). (B) Quantification of p-Y1175 VEGFR2 normalized to the total VEGFR2 (3 independent experiments). (C) Western blot to detect VEGFR2 in CD93 and IgG coimmunoprecipitated samples (CD93 Co-IP and IgG Co-IP) and flow-through samples (CD93 FT and IgG FT) derived from HDBEC protein lysates. (D) In situ PLA for CD93 and VEGFR2 in HDBECs. Scale bar: 25 μm. (E) Quantification of CD93-VEGFR2 interaction (green dots) relative to cell number (5 fields of view/sample). (F) In situ PLA for VE-PTP and VEGFR2 in HDBECs with/without VEGF (10 ng/mL, 5 minutes). Scale bars: 25 μm. (G) Quantification of VE-PTP–VEGFR2 interactions relative to cell number (4 fields of view/sample). **P ≤ 0.01; ***P < 0.001 by 1-way ANOVA with Dunnett’s multiple-comparison test. NS, not significant. Values represent mean ± SEM.
Figure 7
Figure 7. CD93 regulates MMP9 levels in vitro as well as in primary and metastatic sites.
(A) Immunofluorescence images of MMP9 (green) in control mLECs (Mock and siCtrl) and mLECs silenced for CD93 (siCD93-4 and siCD93-5) with/without VEGF (10 ng/mL, 5 minutes). Actin and nuclei were visualized by phalloidin (red) and Hoechst (blue). Scale bars: 20 μm. (B). Quantification of MMP9 levels in mLECs. *P < 0.05, **P < 0.01 by 1-way ANOVA with Tukey′s multiple-comparison test (3 independent experiments). (C) Real-time qPCR showing Mmp9 mRNA levels in control mLECs (mock and siCtrl) and CD93-silenced mLECs (siCD93-4 and siCD93-5) with/without VEGF (3 independent experiments). **P < 0.01, ***P < 0.001 by 1-way ANOVA with Tukey′s multiple-comparison test. (D) Immunofluorescent staining of MMP9 (green) and CD31 (red) in HCmel12 primary tumor from wild-type and CD93–/– mice. Scale bars: 20 μm. (E) Quantification of the area covered by MMP9 normalized to the CD31+ area in wild-type (n = 5) and CD93–/– (n = 7) HCmel12 primary tumor tissue. (F) Immunofluorescent staining of MMP9 (green) and CD31 (red) in metastatic lungs from wild-type and CD93–/– mice. Metastatic lesion of mCherry-HCmel12 tumor cells (TC, gray) are defined by dotted line. Scale bars: 20 μm. (G) Quantification of the area covered by MMP9 around the lung metastatic lesion normalized to the CD31+ area in wild-type (n = 9) and CD93–/– (n = 9) lung metastatic lesions. All immunofluorescence quantifications were performed in a minimum of 4 fields of view/sample. AU, arbitrary units. *P < 0.05; **P < 0.01; ***P < 0.001 by 2-tailed t test (E and G). Values represent mean ± SEM.
Figure 8
Figure 8. CD93 deficiency impairs extracellular matrix deposition in the primary tumor site and at the metastatic lungs.
Representative immunofluorescent staining of fibronectin (green) (A) and collagen IV (green) (B), in the primary HCmel12 tumor vasculature of wild-type and CD93–/– mice. Vasculature is detected by CD31 staining (red). Nuclei are visualized by Hoechst (blue). (C and D) Quantification of fibronectin+ and collagen IV+ area in primary HCmel12 tumor vasculature (n = 9/group, minimum of 6 fields of view/sample). **P < 0.01; ***P < 0.001 by 2-tailed t test. (E and F) Representative immunofluorescence images of fibronectin (green) and collagen IV (green) in the metastatic lungs of wild-type and CD93–/– mice. Metastatic lesions of mCherry-HCmel12 tumor cells (TC, gray) are defined by a dotted line and the vasculature is detected by CD31 staining (red). Nuclei are visualized by Hoechst (blue). (G and H) Quantification of fibronectin+ and collagen IV+ area around the metastatic lesions in wild-type and CD93–/– lungs (n = 9/group, minimum of 3 fields of view/sample). Scale bars: 20 μm and 10 μm (high-magnification insets in A and B). AU, arbitrary units. **P < 0.01; ***P < 0.001 by 2-tailed t test. Values represent mean ± SEM.
Figure 9
Figure 9. VEGFR2 inhibition restores tumor vessel integrity in CD93-deficient mice and reduces metastatic dissemination.
Immunofluorescent staining of VE-cadherin (A), ZO1 (C), and MMP9 (E) in HCmel12 subcutaneous tumors from wild-type and CD93–/– mice treated with DC101 or isotype control (ISO). Scale bars: 20 μm. (B, D, and F) VE-cadherin (B), ZO1 (D), and MMP9 (F) expression was quantified and normalized to the CD31+ area. Wild-type ISO (n = 6–8), CD93–/– ISO (n = 7–9), wild-type DC101 (n = 7–10), and CD93–/– DC101 (n = 4–6). *P < 0.05; **P < 0.01; ****P < 0.0001 by 1-way ANOVA with Tukey’s multiple-comparison test. NS, not significant. All immunofluorescence quantifications were performed in a minimum of 5 fields of view/sample. (G) Percentage of mice that developed lung metastasis after subcutaneous inoculation of HCmel12 cells. Wild-type ISO (n = 10), CD93–/– ISO (n = 9), wild-type DC101 (n = 10), and CD93–/– DC101 (n = 10). (H) Metastatic burden per mouse (percentage of lung tissue area covered by metastases). Wild-type ISO (n = 10), CD93–/– ISO (n = 9), wild-type DC101 (n = 10), and CD93–/– DC101 (n = 10). *P < 0.05, **P ≤ 0.01 by 1-way ANOVA with Tukey’s multiple-comparison test.

References

    1. Jain RK. Normalization of tumor vasculature: an emerging concept in antiangiogenic therapy. Science. 2005;307(5706):58–62. doi: 10.1126/science.1104819. - DOI - PubMed
    1. Potente M, et al. Basic and therapeutic aspects of angiogenesis. Cell. 2011;146(6):873–887. doi: 10.1016/j.cell.2011.08.039. - DOI - PubMed
    1. De Palma M, et al. Microenvironmental regulation of tumour angiogenesis. Nat Rev Cancer. 2017;17(8):457–474. doi: 10.1038/nrc.2017.51. - DOI - PubMed
    1. Li X, et al. VEGFR2 pY949 signalling regulates adherens junction integrity and metastatic spread. Nat Commun. 2016;7:11017. doi: 10.1038/ncomms11017. - DOI - PMC - PubMed
    1. Quintero-Fabián S, et al. Role of matrix metalloproteinases in angiogenesis and cancer. Front Oncol. 2019;9:1370. doi: 10.3389/fonc.2019.01370. - DOI - PMC - PubMed

MeSH terms

Substances