. 2024 Apr 10;15(4):e0031924.
doi: 10.1128/mbio.00319-24. Epub 2024 Mar 5.

Integrating high-throughput analysis to create an atlas of replication origins in Trypanosoma cruzi in the context of genome structure and variability

Affiliations

Integrating high-throughput analysis to create an atlas of replication origins in Trypanosoma cruzi in the context of genome structure and variability

Marcela de Oliveira Vitarelli et al. mBio. .

Abstract

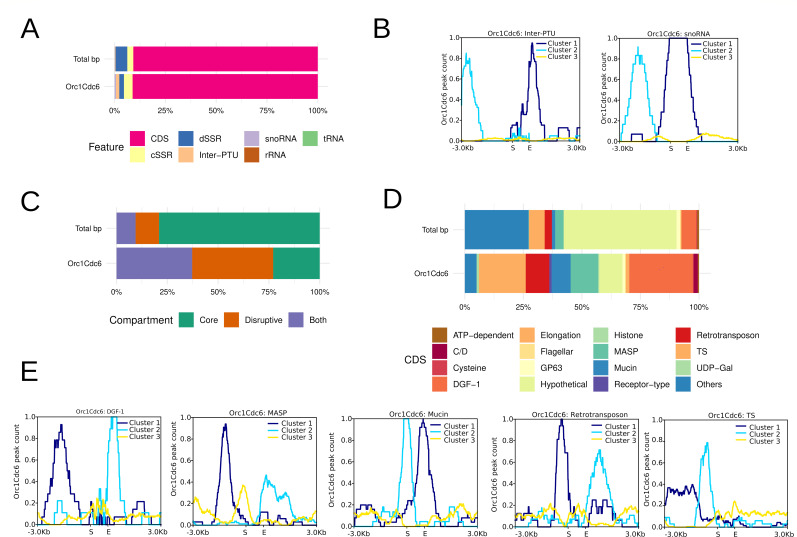
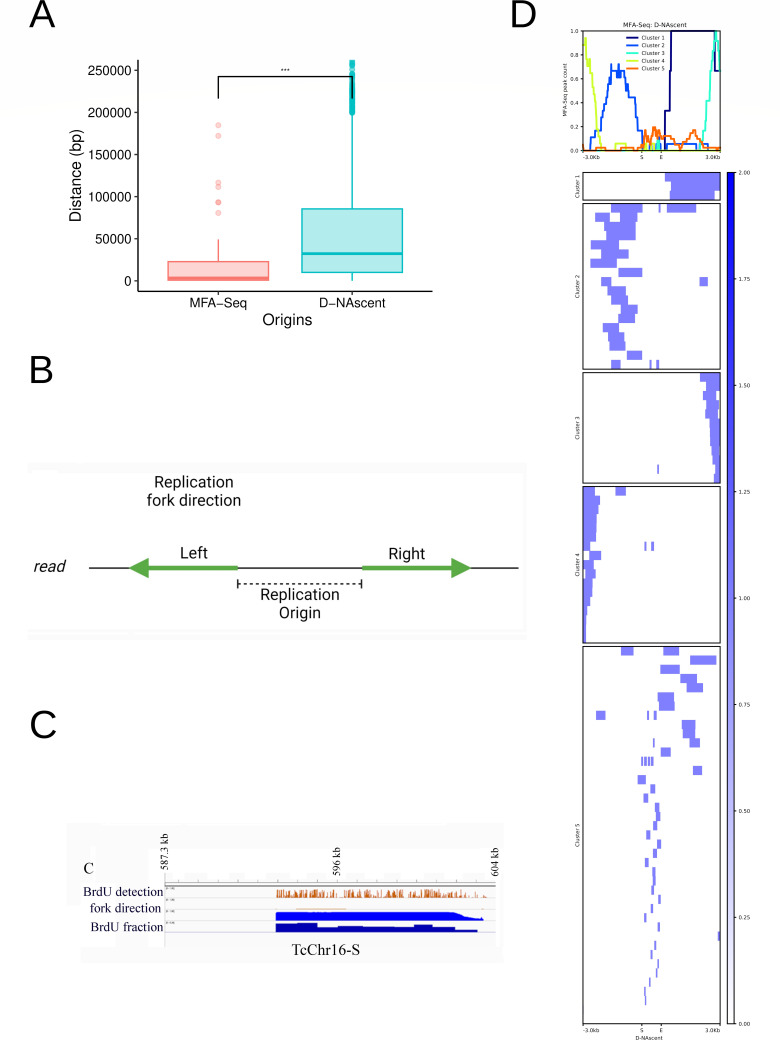
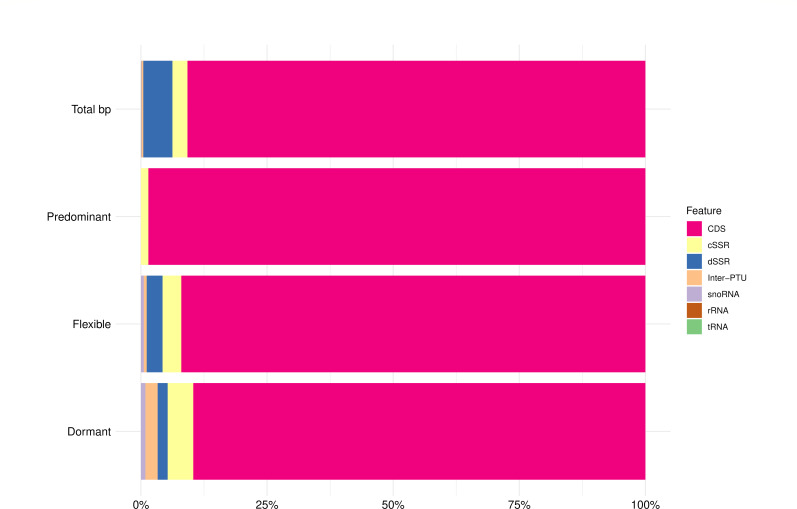
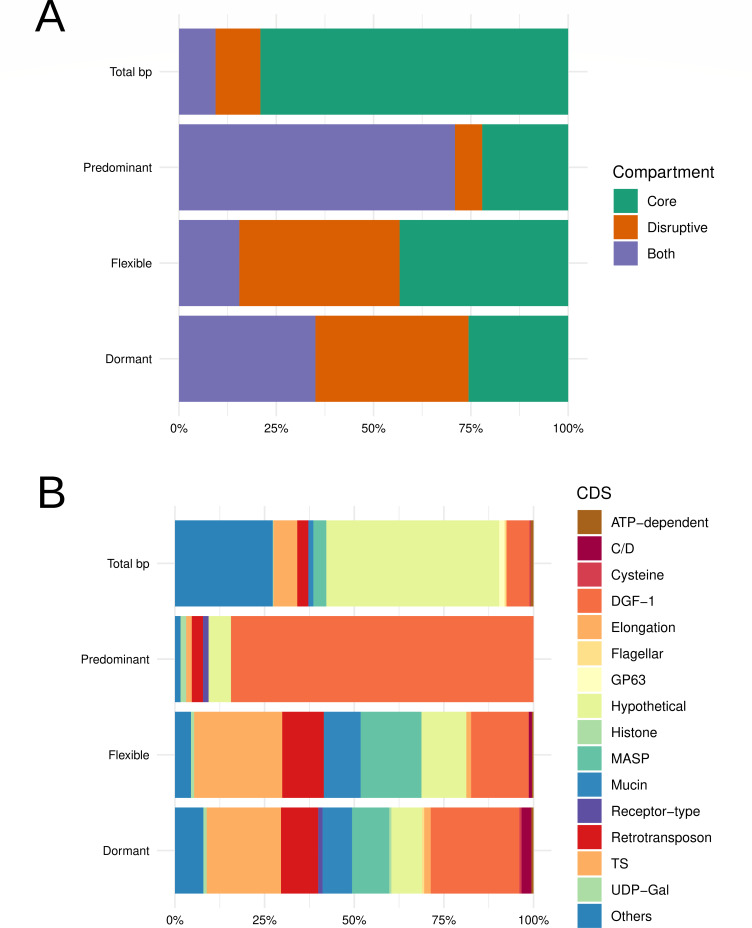
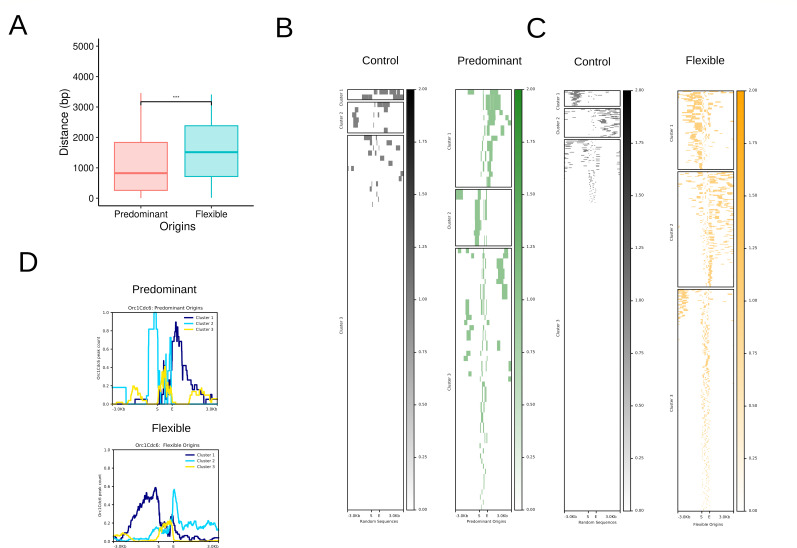
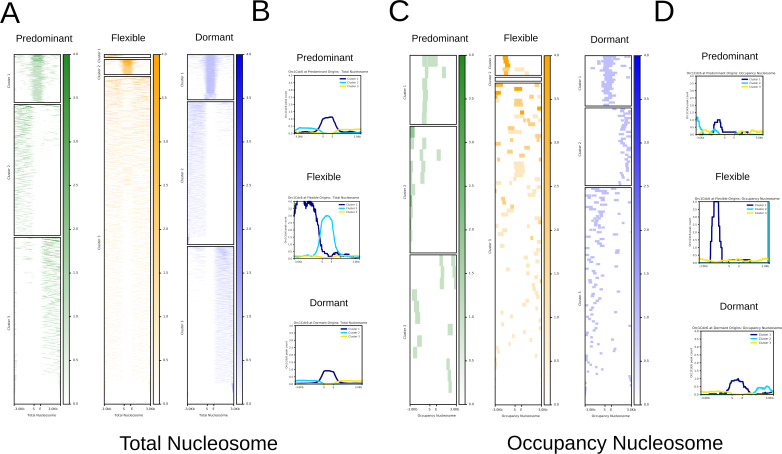
Trypanosoma cruzi is the etiologic agent of the most prevalent human parasitic disease in Latin America, Chagas disease. Its genome is rich in multigenic families that code for virulent antigens and are present in the rapidly evolving genomic compartment named Disruptive. DNA replication is a meticulous biological process in which flaws can generate mutations and changes in chromosomal and gene copy numbers. Here, integrating high-throughput and single-molecule analyses, we were able to identify Predominant, Flexible, and Dormant Orc1Cdc6-dependent origins as well as Orc1Cdc6-independent origins. Orc1Cdc6-dependent origins were found in multigenic family loci, while independent origins were found in the Core compartment that contains conserved and hypothetical protein-coding genes, in addition to multigenic families. In addition, we found that Orc1Cdc6 density is related to the firing of origins and that Orc1Cdc6-binding sites within fired origins are depleted of a specific class of nucleosomes that we previously categorized as dynamic. Together, these data suggest that Orc1Cdc6-dependent origins may contribute to the rapid evolution of the Disruptive compartment and, therefore, to the success of T. cruzi infection and that the local epigenome landscape is also involved in this process.IMPORTANCETrypanosoma cruzi, responsible for Chagas disease, affects millions globally, particularly in Latin America. Lack of vaccine or treatment underscores the need for research. Parasite's genome, with virulent antigen-coding multigenic families, resides in the rapidly evolving Disruptive compartment. Study sheds light on the parasite's dynamic DNA replication, discussing the evolution of the Disruptive compartment. Therefore, the findings represent a significant stride in comprehending T. cruzi's biology and the molecular bases that contribute to the success of infection caused by this parasite.

Keywords: DNA replication; Trypanosoma cruzi; prereplication complex; replication origins.


Conflict of interest statement

The authors declare no conflict of interest.

Figures

Fig 1
Fig 1
Genome-wide localization of Orc1Cdc6 peaks. (A) Distribution of Orc1Cdc6 peaks at different genome features. The chi-square goodness-of-fit test was used to perform statistical significance tests for the standard frequencies 2.97% cSSR, 5.78% dSSR, 0.33% inter-PTU, 90.78% CDS, 0.02% rRNA, 0.10% snoRNA, and 0.02% tRNA for given probabilities with simulated P value (based on 1,000 replicates) and post hoc test Cramer’s V. The values P = 0.000999, X2(NA) = 97.823, and V-Cramer = 0.004499216 were obtained. (B) Hierarchical clusters for Orc1Cdc6 peak count mean concerning inter-PTU and snoRNA region considering a ±3-kb window. (C) Orc1Cdc6 peaks in genome compartments. Statistical significance tests were performed with the chi-square goodness-of-fit test using frequencies 83.04% Core, 13.10% Disruptive, and 3.86% Both as a reference. The values P = 2.2 × 10⁻¹⁶, X2(2) = 2,378, and V-Cramer = 0.3940162 were obtained. (D) Distribution of Orc1Cdc6 peaks at CDS genes. The chi-square goodness-of-fit test was used to perform statistical significance tests for the standard frequencies 0.78% ATP dependent, 0.06% C/D, 0.31% Cysteine, 6.30% DGF-1, 0.20% Elongation, 0.37% Flagellar, 1.49% GP63, 48.13% Hypothetical, 0.13% Histone, 3.56% MASP, 1.29% Mucin, 0.14% Receptor type, 3.06% Retrotransposon, 6.65% TS, 0.18% UDP, and 27.27% others, for given probabilities with simulated P value (based on 1,000 replicates) and post hoc test Cramer’s V. The values P = 0.000999, X2(NA)= 1720.8 , and V-Cramer = 0.04098598 were obtained. (E) Summary plots of k-mean clusters for Orc1Cdc6 peaks concerning genes for multigenic family proteins (DGF-1, MASP, Mucin, Retrotransposon, and TS).
Fig 2
Fig 2
Characterization of D-NAscent-detected origins. (A) Distance distribution between the MFA-seq or D-NAscent origins and ChIP-seq-detected Orc1Cdc6 peaks. The center of each coordinate was used in this analysis. *** Statistical significance tests were performed with the Wilcoxon-Mann-Whitney test with P value = 0.0005348. (B) Scheme exemplifying the method used for the analyses of D-NAscent software products to pinpoint the origins of replication. The distance between two divergent sense replication forks in the same read was used to define origins of replication. Image created with BioRender.com. (C) Graphical representation of BrdU decay in a sequenced read. (D) Hierarchical clusters (five in total) and heatmap for MFA-seq origin peaks mean concerning D-NAscent origins considering a ±3-kb window.
Fig 3
Fig 3
Distribution of Predominant, Flexible, and Dormant origins at different genomic features. The chi-square goodness-of-fit test was used to perform statistical significance tests for the standard frequencies 2.97% cSSR, 5.78% dSSR, 0.33% inter-PTU, 90.78% CDS, 0.02% rRNA, 0.10% snoRNA, and 0.02% tRNA for given probabilities with simulated P value (based on 1,000 replicates) and post hoc test Cramer’s V. The values P = 0.2278, X2(6)=5.2118, and V-Cramer = 0.003714641 to Predominant; P = 0.1429, X2(6)=13.779, and V-Cramer = 0.002662303 to Flexible; P = 0.000999, X2(NA) = 107.32, and V-Cramer = 0.006530673 to Dormant were obtained.
Fig 4
Fig 4
Distribution of Predominant, Flexible, and Dormant origins in genome compartments and CDS genes. (A) Distribution of Predominant, Flexible, and Dormant origins at genomic compartments. Statistical significance tests were performed with the chi-square goodness-of-fit test using the standard frequency 83.04% Core, 13.10% Disruptive, and 3.86% Both, and post hoc test Cramer’s V. The values P = 2.2 × 10⁻¹⁶, X2(2)=1137.7, and V-Cramer = 0.7463624 to Predominant; P = 2.2 × 10⁻¹⁶, X2(2)=1304.7, and V-Cramer = 0.2144572 to Flexible; P = 2.2 × 10⁻¹⁶, X2(2)=1094.3, and V-Cramer = 0.3665591 to Dormant were obtained. (B) Distribution of Predominant, Flexible, and Dormant origins at CDS genes. The chi-square goodness-of-fit test was used to perform statistical significance tests for the standard frequencies 0.78% ATP dependent, 0.06% C/D, 0.31% Cysteine, 6.30% DGF-1, 0.20% Elongation, 0.37% Flagellar, 1.49% GP63, 48.13% Hypothetical, 0.13% Histone, 3.56% MASP, 1.29% Mucin, 0.14% Receptor type, 3.06% Retrotransposon, 6.65% TS, 0.18% UDP, and 27.27% others, for given probabilities with simulated P value (based on 1,000 replicates) and post hoc test Cramer’s V. The values P = 0.000999, X2(NA) = 681.91, and V-Cramer = 0.07997963 to Predominant; P = 0.000999, X2(NA) = 597.2, and V-Cramer = 0.04000745 to Flexible; P = 0.000999, X2(NA) = 1113.8, and V-Cramer = 0.04535975 to Dormant were obtained.
Fig 5
Fig 5
Orc1Cdc6 peaks at Predominant and Flexible origins. (A) Distribution of the distances between Predominant and Flexible origins to Orc1Cdc6-ChIP-seq peaks. The center of each coordinate was used in this analysis. Statistical significance tests were performed with the Wilcoxon-Mann-Whitney test with P value=2.2×10¹⁶. (B) Heatmaps for Orc1Cdc6 peak mean relative to Predominant origins (Predominant) or random sequences (Control) considering a ±3-kb window. Random sequences were selected at least three times. (C) Heatmaps for Orc1Cdc6 peak mean concerning Flexible origins (Flexible) or random sequences (Control) considering a ±3-kb window. Random sequences were selected at least three times. (D) Summary plots of the hierarchical clusters (k-means) for Orc1Cdc6 peaks concerning Predominant and Flexible origins considering a ±3-kb window.
Fig 6
Fig 6
Co-localization of Orc1Cdc6 peaks mean at Predominant, Flexible, and Dormant origins in relation to total and occupancy nucleosomes. It was considered a ±3-kb window at all analyses. (A) Heatmaps relative to total nucleosomes. (B) Hierarchical clusters relative to total nucleosomes. (C) Heatmaps relative to occupancy nucleosomes. (D) Hierarchical clusters relative to occupancy nucleosomes.

Similar articles

References

    1. Organización Panamericana de la Salud . 2020. Synthesis of evidence: guidance for the diagnosis and treatment of Chagas diseaseSíntese de evidências: guia de diagnóstico e tratamento da doença de Chagas. Rev Panam Salud Publica 44:e28. doi:10.26633/RPSP.2020.28 - DOI - PMC - PubMed
    1. Bern C. 2015. Chagas’ disease. N Engl J Med 373:456–466. doi:10.1056/NEJMra1410150 - DOI - PubMed
    1. Zingales B, Andrade SG, Briones MRS, Campbell DA, Chiari E, Fernandes O, Guhl F, Lages-Silva E, Macedo AM, Machado CR, Miles MA, Romanha AJ, Sturm NR, Tibayrenc M, Schijman AG, Second Satellite Meeting . 2009. A new consensus for Trypanosoma cruzi intraspecific nomenclature: second revision meeting recommends TcI to TcVI. Mem Inst Oswaldo Cruz 104:1051–1054. doi:10.1590/s0074-02762009000700021 - DOI - PubMed
    1. Souza RT, Lima FM, Barros RM, Cortez DR, Santos MF, Cordero EM, Ruiz JC, Goldenberg S, Teixeira MMG, da Silveira JF. 2011. Genome size, karyotype polymorphism and chromosomal evolution in Trypanosoma cruzi. PLoS One 6:e23042. doi:10.1371/journal.pone.0023042 - DOI - PMC - PubMed
    1. Reis-Cunha JL, Baptista RP, Rodrigues-Luiz GF, Coqueiro-Dos-Santos A, Valdivia HO, de Almeida LV, Cardoso MS, D’Ávila DA, Dias FHC, Fujiwara RT, Galvão LMC, Chiari E, Cerqueira GC, Bartholomeu DC. 2018. Whole genome sequencing of Trypanosoma cruzi field isolates reveals extensive genomic variability and complex aneuploidy patterns within TcII DTU. BMC Genomics 19:816. doi:10.1186/s12864-018-5198-4 - DOI - PMC - PubMed