. 2024 Oct 1;80(4):844-858.
doi: 10.1097/HEP.0000000000000830. Epub 2024 Mar 5.

Antagonistic effects of the cytotoxic molecules granzyme B and TRAIL in the immunopathogenesis of sclerosing cholangitis

Affiliations

Antagonistic effects of the cytotoxic molecules granzyme B and TRAIL in the immunopathogenesis of sclerosing cholangitis

Mareike Kellerer et al. Hepatology. .

Abstract

Background and aims: Primary sclerosing cholangitis (PSC) is a chronic cholestatic liver disease characterized by biliary inflammation and fibrosis. We showed an elevated interferon γ response in patients with primary sclerosing cholangitis and in multidrug resistance protein 2-deficient ( Mdr2-/- ) mice developing sclerosing cholangitis. Interferon γ induced expression of the cytotoxic molecules granzyme B (GzmB) and TRAIL in hepatic lymphocytes and mediated liver fibrosis in sclerosing cholangitis.

Approach and results: In patient samples and Mdr2-/- mice, we identified lymphocyte clusters with a cytotoxic gene expression profile using single-cell RNA-seq and cellular indexing of transcriptomes and epitopes by sequencing analyses combined with multi-parameter flow cytometry. CD8 + T cells and NK cells showed increased expression of GzmB and TRAIL in sclerosing cholangitis. Depletion of CD8 + T cells ameliorated disease severity in Mdr2-/- mice. By using Mdr2-/- × Gzmb-/- and Mdr2-/- × Tnfsf10-/- mice, we investigated the significance of GzmB and TRAIL for disease progression in sclerosing cholangitis. Interestingly, the lack of GzmB resulted in reduced cholangiocyte apoptosis, liver injury, and fibrosis. In contrast, sclerosing cholangitis was aggravated in the absence of TRAIL. This correlated with elevated GzmB and interferon γ expression by CD8 + T cells and NK cells enhanced T-cell survival, and increased apoptosis and expansion of cholangiocytes.

Conclusions: GzmB induces apoptosis and fibrosis in sclerosing cholangitis, whereas TRAIL regulates inflammatory and cytotoxic immune responses, subsequently leading to reduced liver injury and fibrosis.


Conflict of interest statement

Christoph Schramm consults for Agomab and Chemomab. He advises Pliant. He received grants from Falk and Roche. The remaining authors have no conflicts to report.

Figures

None
Graphical abstract
FIGURE 1
FIGURE 1
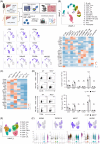
Cytotoxic lymphocyte subsets in PSC. (A) Schematic overview of the study design. (B) UMAP plot shows clustering of CD45+ leukocytes in sclerosing cholangitis. UMAP plots and heat maps show subset defining protein and gene expression. (C) Heat map of genes defining effector cell function. (D) Expression of TRAIL and GzmB by hepatic T-cell subsets and NK cells was analyzed in 12-week-old Mdr2 −/− and WT mice. (E) UMAP plot shows clustering of CD3+ T-cell subsets from patients with PSC. (F) UMAP and violin plots depict the expression of genes associated with cytotoxicity within the different T-cell subsets. Mean ± SEM of 1 out of 2 experiments are shown. *p ≤ 0.05, ***p ≤ 0.001, ****p ≤ 0.0001, ns: not significant. Abbreviations: GzmB, granzyme B; Mdr2, multidrug resistance protein 2; MOs/MPs, monocytes/monocyte-derived macrophages; PSC, primary sclerosing cholangitis; UMAP, Uniform Manifold Approximation and Projection; WT, wild-type.
FIGURE 2
FIGURE 2
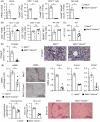
CD8+ T cells aggravate sclerosing cholangitis. (A) Six-weeks old Mdr2 −/− mice were treated with an anti-CD8α antibody or isotype control twice a week for 2 weeks. Numbers of hepatic CD8+ and CD4+ T cells and NK cells were analyzed. (B) The phenotype of hepatic NK cells and (C) CD4+ T cells was analyzed. (D) Plasma ALT levels were determined. (E) CCasp3 was stained in liver sections, and CCasp3-expressing cholangiocytes were counted. Arrows mark CCasp3+ cholangiocytes. Bars represent 50 μm. (F) αSMA staining was quantified in liver sections. Expression of Timp1, Col1a1, and Col3a1 was determined in antibody-treated mice and normalized to the isotype control. Hydroxyproline levels were assessed in liver tissue, and Sirius red staining was quantified in liver sections. Mean ± SEM of 1 out of 2 experiments are shown. *p ≤ 0.05, **p ≤ 0.01, ns: not significant. Abbreviations: CCasp3, cleaved caspase-3; Col1a1, collagen type I alpha 1 chain; Col3a1, collagen type 3 alpha 1 chain; αSMA, α-smooth muscle actin.
FIGURE 3
FIGURE 3
GzmB aggravates sclerosing cholangitis. (A) Hepatic Gzmb mRNA expression and GzmB expression in hepatic T cells and NK cells in 12-week-old Mdr2 −/− × Gzmb −/− and Mdr2 −/− mice are shown. (B) Frequencies of hepatic CD4+ and CD8+ T cells and NK cells were analyzed. (C) Plasma ALT levels were determined. (D) CCasp3 was stained in liver sections, and CCasp3-expressing cholangiocytes were counted. Arrows mark CCasp3+ cholangiocytes. Bars represent 50 μm. (E) αSMA staining was quantified in liver sections. Hepatic expression of Timp1, Col1a1, and Col3a1 was determined in Mdr2 −/− × Gzmb −/− mice and normalized to Mdr2 −/− mice. Hydroxyproline levels were assessed in liver tissue, and Sirius red staining was quantified in liver sections. Mean ± SEM of 1 out of 3 experiments are shown. *p ≤ 0.05, **p ≤ 0.01, ns: not significant. Abbreviations: CCasp3, cleaved caspase-3; Col1a1, collagen type I alpha 1 chain; Col3a1, collagen type 3 alpha 1 chain; GzmB, granzyme B; Mdr2, multidrug resistance protein 2; αSMA, α-smooth muscle actin.
FIGURE 4
FIGURE 4
TRAIL regulates cytotoxic and inflammatory lymphocytes in sclerosing cholangitis. (A) Tnfsf10 mRNA expression in liver tissue and TRAIL expression in hepatic T cells and NK cells in 12 weeks old Mdr2 −/− × Tnfsf10 −/− and Mdr2 −/− mice are shown. (B) Frequencies of hepatic CD4+ and CD8+ T cells and NK cells were analyzed. (C) Volcano plots depict the most upregulated genes in lymphocyte subsets in Mdr2 −/− × Tnfsf10 −/− compared to Mdr2 −/− mice. (D) The phenotype of hepatic CD8+ T cells, CD4+ T cells, and NK cells is shown. (E) Expression of IFNγ in hepatic lymphocytes was analyzed. Hepatic mRNA expression was determined in Mdr2 −/− × Tnfsf10 −/− mice and normalized to Mdr2 −/− mice. The frequency of hepatic MHC-II+ DCs is shown. (F) Expression of pZAP-70 and pPLCγ1 was analyzed in hepatic CD8+ T cells and CD4+ T cells. Mean ± SEM of 1 out of 3 experiments are shown. *p ≤ 0.05, **p ≤ 0.01, ns: not significant. Abbreviations: Mdr2, multidrug resistance protein 2; PLCγ1, phospholipase Cy1; pZAP, phosphorylated; Tnfsf10, tumor necrosis factor superfamily member 10; ZAP-70, zeta chain-associated protein kinase 70.
FIGURE 5
FIGURE 5
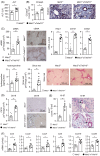
TRAIL controls cholangiocyte apoptosis and proliferation in sclerosing cholangitis. (A) Plasma ALT levels were determined in 12-week-old Mdr2 −/− × Tnfsf10 −/− and Mdr2 −/− mice. (B) CCasp3 was stained in liver sections, and CCasp3-expressing cholangiocytes were counted. Arrows mark CCasp3+ cholangiocytes. Bars represent 50 μm. (C) αSMA staining was quantified in liver sections. Hepatic expression of Timp1, Col1a1, and Col3a1 was determined in Mdr2 −/− × Tnfsf10 −/− mice and normalized to Mdr2 −/− mice. Hydroxyproline levels were assessed in liver tissue, and Sirius red and (D) CK19 staining was quantified in liver sections. (E) Ki-67 was stained in liver sections, and Ki-67-expressing cholangiocytes were counted. Arrows mark Ki-67+ cholangiocytes. Bars represent 50 μm. (F) Liver mRNA expression was analyzed in Mdr2 −/− × Tnfsf10 −/− mice and normalized to Mdr2 −/− mice. Mean ± SEM of 1 out of 3 experiments are shown. *p ≤ 0.05, **p ≤ 0.01, ns: not significant. Abbreviations: CCasp3, cleaved caspase-3; Col1a1, collagen type I alpha 1 chain; Col3a1, collagen type 3 alpha 1 chain; Mdr2, multidrug resistance protein 2; Tnfsf10, tumor necrosis factor superfamily member 10; αSMA, α-smooth muscle actin.
FIGURE 6
FIGURE 6
Regulation of inflammatory lymphocytes by CD8+ T-cell-derived TRAIL. (A) CD8+ T cells from Tnfsf10 −/− and WT mice were transferred into 10-week-old Mdr2 −/− × Rag1 −/− mice, that were analyzed 8 days later. The phenotype of transferred CD8+ T cells and (B) endogenous NK cells was analyzed. (C) Plasma ALT levels were determined. (D) CCasp3 was stained in liver sections, and CCasp3-expressing cholangiocytes were counted. Arrows mark CCasp3+ cholangiocytes. Bars represent 50 μm. (E) Liver sections were stained with Ki-67, and Ki-67-expressing cholangiocytes were counted. Arrows mark Ki-67+ cholangiocytes. Bars represent 50 μm. (F) Hydroxyproline levels were assessed in liver tissue. Hepatic mRNA expression was analyzed after the transfer of Tnfsf10 −/− CD8+ T cells and normalized to WT CD8+ T cells. Sirius red staining was quantified in liver sections. Mean ± SEM of 1 out of 3 experiments are shown. *p ≤ 0.05, **p ≤ 0.01, ns: not significant. Abbreviations: CCasp3, cleaved caspase-3; Mdr2, multidrug resistance protein 2; WT, wild-type.

Comment in

References

    1. Lazaridis KN, LaRusso NF. Primary sclerosing cholangitis. N Engl J Med. 2016;375:1161–1170. - PMC - PubMed
    1. Liu JZ, Hov JR, Folseraas T, Ellinghaus E, Rushbrook SM, Doncheva NT, et al. . Dense genotyping of immune-related disease regions identifies nine new risk loci for primary sclerosing cholangitis. Nat Genet. 2013;45:670–675. - PMC - PubMed
    1. Karlsen TH, Boberg KM, Olsson M, Sun JY, Senitzer D, Bergquist A, et al. . Particular genetic variants of ligands for natural killer cell receptors may contribute to the HLA associated risk of primary sclerosing cholangitis. J Hepatol. 2007;46:899–906. - PubMed
    1. Liaskou E, Jeffery LE, Trivedi PJ, Reynolds GM, Suresh S, Bruns T, et al. . Loss of CD28 expression by liver-infiltrating T cells contributes to pathogenesis of primary sclerosing cholangitis. Gastroenterology. 2014;147:221–232.e7. - PMC - PubMed
    1. Kunzmann LK, Schoknecht T, Poch T, Henze L, Stein S, Kriz M, et al. . Monocytes as potential mediators of pathogen-induced T-helper 17 differentiation in patients with primary sclerosing cholangitis (PSC). Hepatology. 2020;72:1310–1326. - PubMed

Publication types

MeSH terms

Substances