. 2024 Mar 26;43(3):113896.
doi: 10.1016/j.celrep.2024.113896. Epub 2024 Mar 4.

Regulation of transcription patterns, poly(ADP-ribose), and RNA-DNA hybrids by the ATM protein kinase

Affiliations

Regulation of transcription patterns, poly(ADP-ribose), and RNA-DNA hybrids by the ATM protein kinase

Phillip R Woolley et al. Cell Rep. .

Abstract

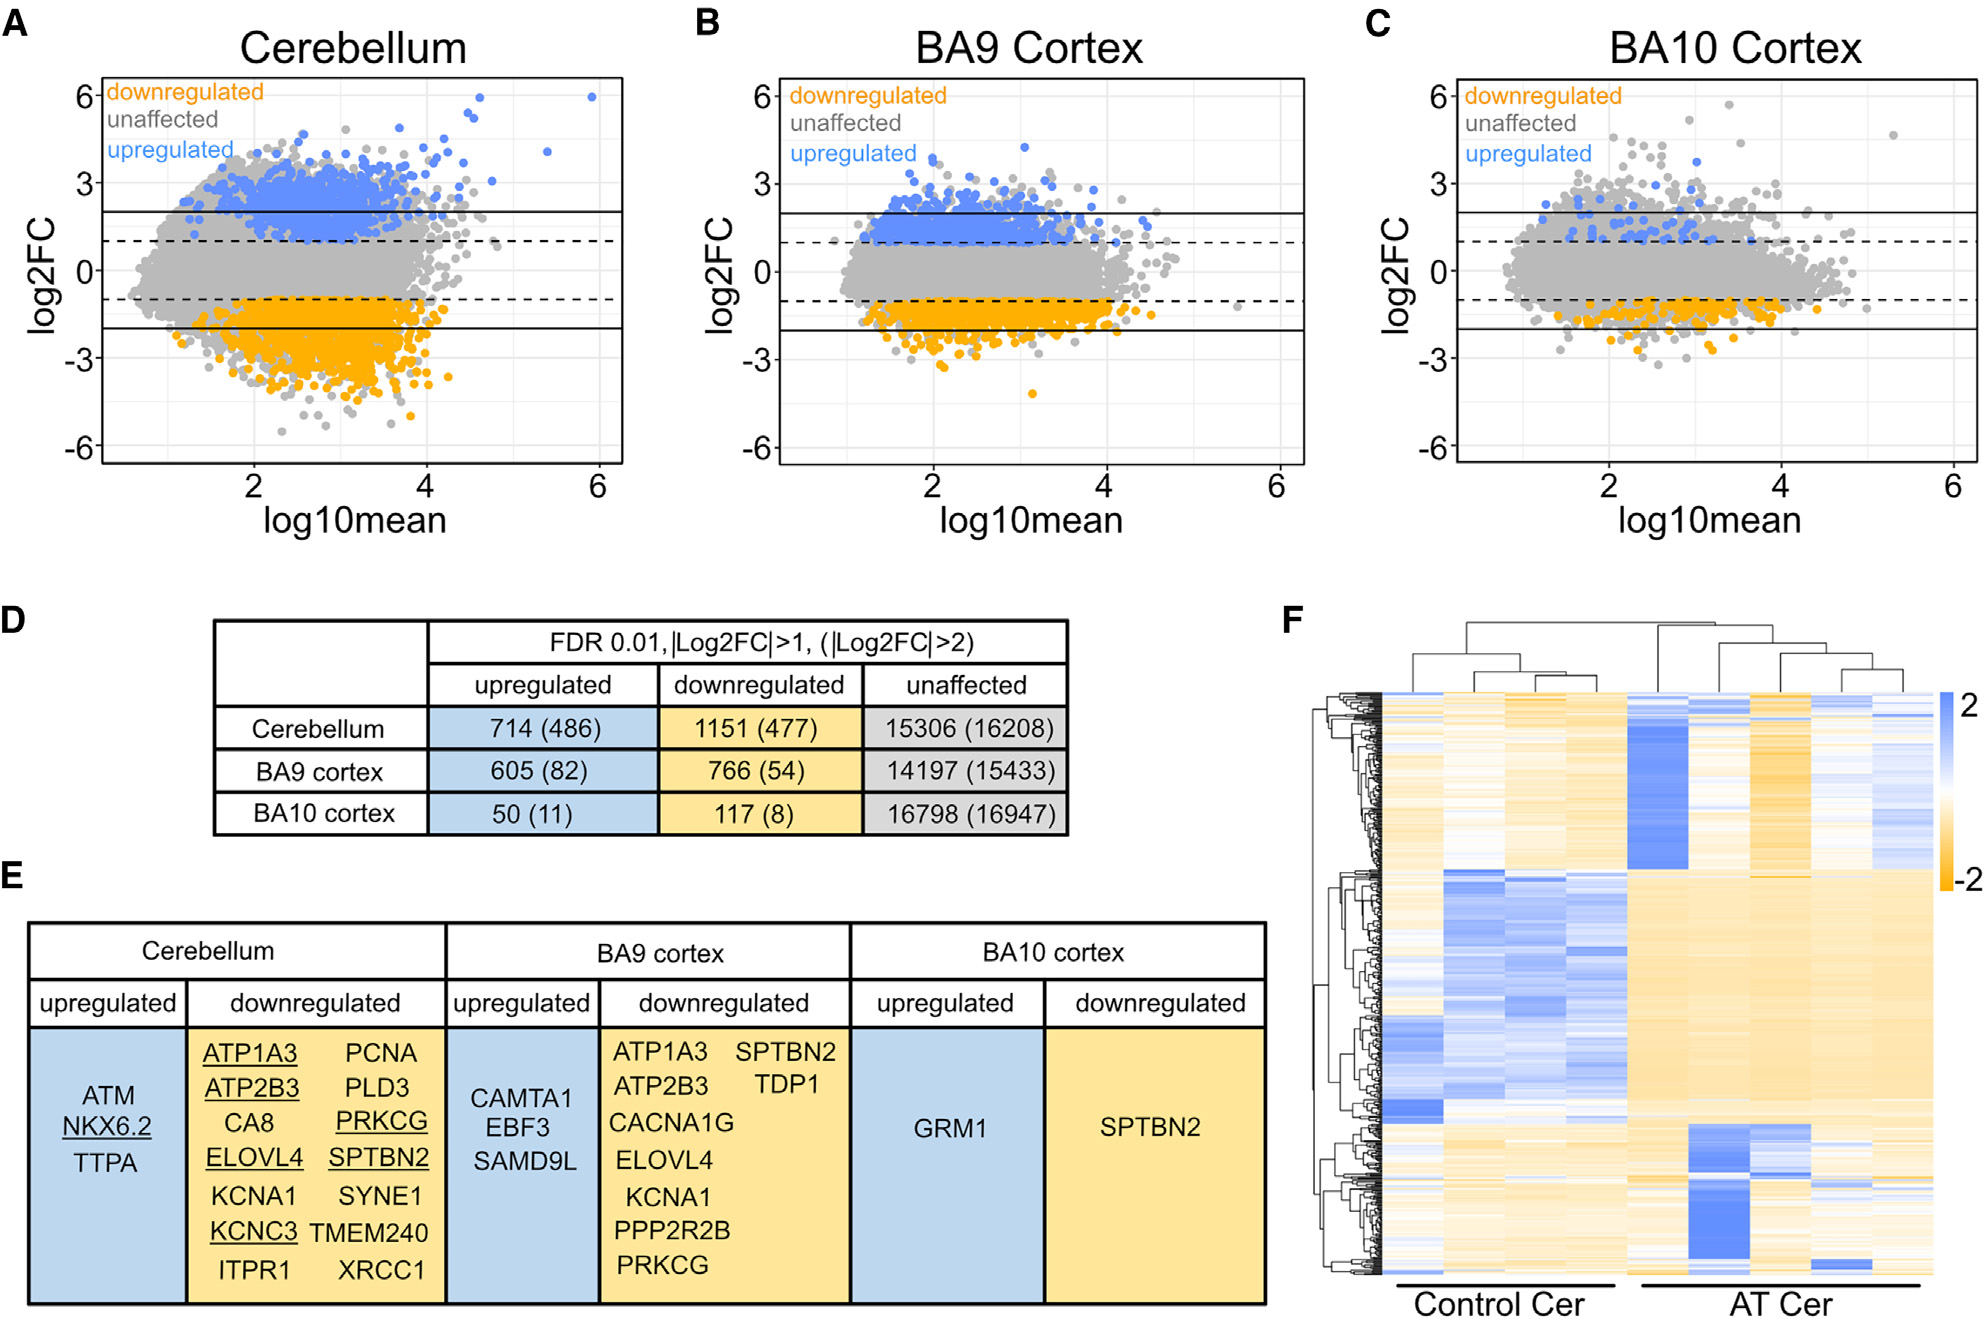
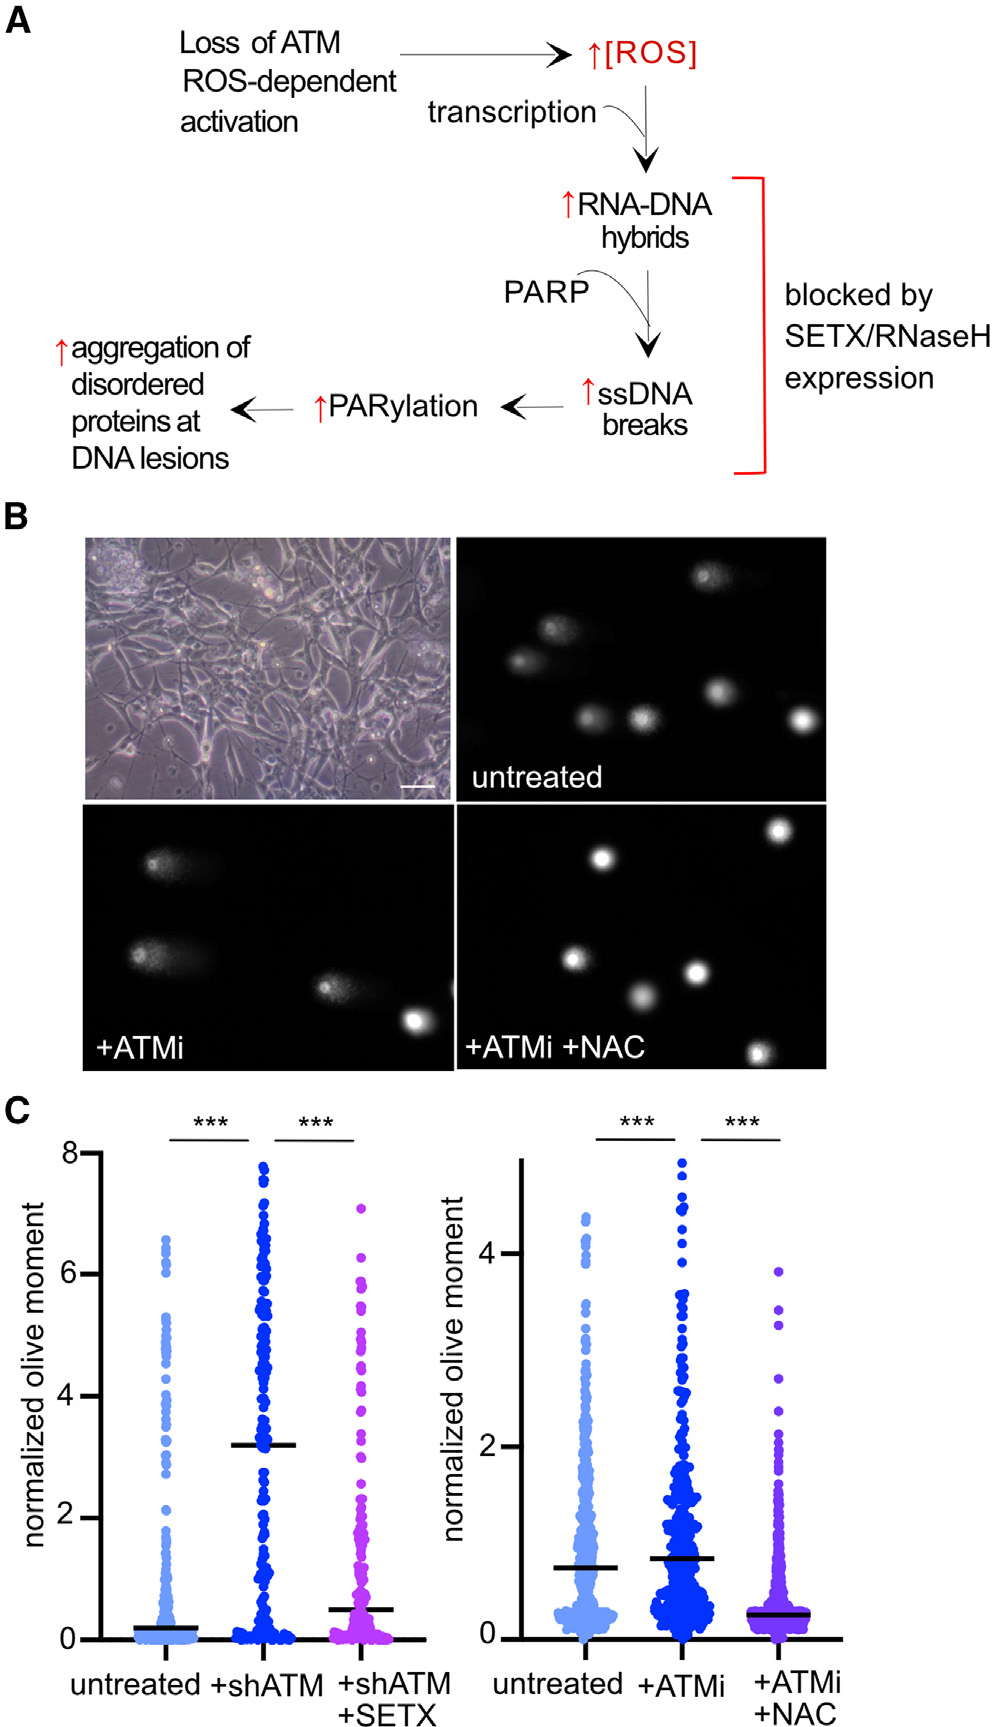
The ataxia telangiectasia mutated (ATM) protein kinase is a master regulator of the DNA damage response and also an important sensor of oxidative stress. Analysis of gene expression in ataxia-telangiectasia (A-T) patient brain tissue shows that large-scale transcriptional changes occur in patient cerebellum that correlate with the expression level and guanine-cytosine (GC) content of transcribed genes. In human neuron-like cells in culture, we map locations of poly(ADP-ribose) and RNA-DNA hybrid accumulation genome-wide with ATM inhibition and find that these marks also coincide with high transcription levels, active transcription histone marks, and high GC content. Antioxidant treatment reverses the accumulation of R-loops in transcribed regions, consistent with the central role of reactive oxygen species in promoting these lesions. Based on these results, we postulate that transcription-associated lesions accumulate in ATM-deficient cells and that the single-strand breaks and PARylation at these sites ultimately generate changes in transcription that compromise cerebellum function and lead to neurodegeneration over time in A-T patients.

Keywords: ATM; CP: Molecular biology; DNA repair; R-loops; cerebellar ataxia; poly-ADP-ribosylation; transcription.


Conflict of interest statement

Declaration of interests The authors declare no competing interests.

Figures

Figure 1.
Figure 1.. The A-T patient transcriptome shows dramatic differences from controls.
(A) MA plot comparing cerebellar A-T patient transcriptome (5 patients) to control transcriptome (4 patients). Dashed lines correspond to |Log2FC| > 1, solid lines correspond to |Log2FC| > 2. Orange corresponds to Log2FC < −1 with q < 0.01 (downregulated gene set) and blue corresponds to Log2FC > 1, with q < 0.01 (upregulated gene set). FC, fold change. (B) MA plot comparing BA9 cortex A-T patient transcriptome to control patient transcriptome. (C) MA plot comparing BA10 cortex A-T patient transcriptome to control patient transcriptome. (D) Numbers of genes in upregulated (|Log2FC| > 1), downregulated (Log2FC < −1), and unaffected gene sets in each tissue type. Gene sets in parentheses indicate numbers of differentially transcribed genes with at least 4-fold change from wild type (|Log2FC| > 2). FDR, false discovery rate. (E) Human cerebellar ataxia-linked genes that fall within upregulated and downregulated gene sets for each tissue type. Underlined genes are in the |Log2FC| > 2 subset. (F) Heatmap for the 500 genes with the most extreme |Log2FC| values in the cerebellum. Columns are patients and rows are genes.
Figure 2.
Figure 2.. Differentially expressed genes in A-T patients align with patterns of transcript abundance and GC content.
(A) Transcript change vs. expression rank plots for cerebellum genes with q < 0.01. Expression rank is defined as the set of all genes with q < 0.01 sorted by mean control patient transcript abundance. The higher the expression rank, the higher expressed the gene is in controls. Cohort includes 5 A-T patients and 4 controls (see Table S1). (B) Expression quantile histograms for cerebellum downregulated gene set. As in (A), but without a q value requirement, all of the genes were sorted by mean control patient transcript abundance before being divided into 100 equally sized, nonoverlapping bins. The rightmost bin contains the 1% highest expressed genes in control patients, and the leftmost bin contains the 1% lowest expressed genes in control patients. The number of downregulated genes in each bin are plotted on the histogram. Light orange: genes with Log2FC < 1 in A-T patients relative to controls; dark orange: genes with Log2FC < 2. (C) Expression quantile histograms for cerebellum upregulated gene set. Light blue: genes with Log2FC > 1 in A-T patients relative to controls; dark blue: genes with Log2FC > 2. (D) As in (A), but for the BA9 cortex. (E) As in (B), but for the BA9 cortex. (F) As in (C), but for the BA9 cortex. (G) Density plots for gene GC content for cerebellar upregulated, downregulated, and unaffected gene sets from Figure 1A. (H) Density plots for gene GC content for BA9 upregulated, downregulated, and unaffected gene sets from Figure 1B. (I) Density plots for gene GC content for BA10 upregulated, downregulated, and unaffected gene sets from Figure 1C. (J) Density plots for the maximum 100-nt GC content per gene for cerebellar upregulated, downregulated, and unaffected gene sets. (K) Density plots for the maximum 100-nt GC content per gene for BA9 upregulated, downregulated, and unaffected gene sets. (L) Density plots for the maximum 100-nt GC content per gene for BA10 upregulated, downregulated, and unaffected gene sets.
Figure 3.
Figure 3.. ATM inhibition in postmitotic neuronal-like cells generates ROS-dependent single-strand breaks.
(A) Working model for transcription-associated lesions in ATM-deficient cells based on previous observations., Loss of ATM produces high ROS in human cells, which generates R-loops, ssDNA breaks, hyperPARylation, and protein aggregates. (B) Bright-field image of differentiated cells (top left) and examples of alkaline comet assay results from postmitotic human neuron-like cells differentiated from SH-SY5Y neuroblastoma cells comparing untreated, ATMi-treated, and ATMi + NAC conditions. Scale bar: 20 μm. (C) Quantitation of the olive moment in alkaline comet assays measuring >380 cells from each treatment group. Differentiated SH-SY5Y cells were depleted of ATM by short hairpin RNA and complemented with expression of the C-terminal helicase domain of SETX as indicated (left). Differentiated SH-SY5Y cells were treated with ATMi or ATMi with NAC as indicated (right). ***p < 0.0005 by two-sample t test assuming unequal variances.
Figure 4.
Figure 4.. PAR ChIP shows increased signal with loss of ATM activity.
(A) Examples of genome browser views of PAR ChIP in untreated SH-SY5Y differentiated neuron-like cells (“no ATMi”), cells with 2-day treatment with 1 μM AZD1390 (“+ATMi”), and ATAC-seq and H3K27ac data from previously published datasets., (B) Recovery of PAR ChIP products in the presence or absence of ATMi; signal shown is ChIP signal from 2 replicates with input contribution removed and reads normalized by read depth for each sample. (C) Normalized PAR ChIP signal at all promoters (1,000 nt upstream of TSS to 500 nt downstream) and promoters of genes that are transcribed, based on RNA-seq data from SH-SY5Y cells. (D) Pattern of accumulated PAR ChIP signal in the presence of ATMi compared to the pattern of H3K27ac signal at TSSs genome-wide. (E) Normalized PAR ChIP signal at H3K27ac peak locations (57,068). (F) Normalized PAR ChIP signal at H3K27me3 peak locations (176,439). (G) Pattern of accumulated PAR ChIP signal in the presence of ATMi compared to the pattern of ATAC-seq signal at ATAC-seq peak locations (“center”) genome-wide, including 3 kb upstream and downstream. (H) Normalized PAR ChIP signal is shown at subsets of chromosome 1 locations with the indicated levels of GC content. We used 100-nt sequence blocks (14,000 per bin for all bins except for 10–20 [13,181], 70–80 [13,677], and 80–90 [2,523]) for each analysis. The locations of these blocks are shown (“center”), as well as 3-kb windows upstream and downstream. ***p < 0.0005 by two-sample t test assuming unequal variances comparing untreated to ATMi. NS, nonsignificant.
Figure 5.
Figure 5.. R-loops increase with inhibition of ATM and are relieved by antioxidant treatment.
(A) Examples of genome browser views of R-ChIP in untreated SH-SY5Y differentiated neuron-like cells (“R-ChIP no ATMi”), cells with 2-day treatment with 1 μM AZD1390 (“R-ChIP +ATMi”), and cells with NAC treatment only (“R-ChIP +NAC”), and cells with both ATMi and NAC (“R-ChIP +ATMi +NAC”) as indicated in comparison to PAR ChIP signal in the presence of ATMi as in Figure 4. Signal shown is ChIP signal from 2 replicates with input contribution removed and reads normalized by read depth for each sample. (B) Pattern of accumulated R-ChIP signal at TSSs genome-wide as indicated. (C) Normalized R-ChIP signal at transcribed promoters. (D–F) Normalized R-ChIP signal at H3K27ac (D), H3K4me1 (E), and H3K4me3 (F) ChIP locations, respectively. (G) Pattern of accumulated R-ChIP signal at PAR ChIP sites in ATMi-treated cells genome-wide as indicated. (H) Normalized R-ChIP signal at PAR ChIP sites in ATMi-treated cells. (I) Normalized R-ChIP signal at ATAC-seq locations. (J) Pattern of accumulated R-ChIP signal at ATAC-seq sites as indicated. ***p < 0.0005 by two-sample t test assuming unequal variances.
Figure 6.
Figure 6.. PAR and R-ChIP signals correlate with transcript abundance and GC content.
(A) Mean TSS PAR ChIP plotted against ln(transcript abundance). TSS is defined in this figure as the window 1,000 nt upstream to 500 nt downstream of a gene start. Sample space comprises locations where PAR is present within a TSS, with corresponding transcript abundance information from RNA-seq (“active TSS”). Sample space was sorted by transcript abundance value and divided into nonoverlapping bins of 1 million observations. The mean PAR and mean ln(abundance) value for each bin is plotted. Process was performed for no ATMi and +ATMi PAR samples. (B) As in (A), but for no ATMi and +ATMi R-ChIP. (C) As in (B), but for NAC-treated R-ChIP. (D) Mean TSS PAR ChIP plotted against 100-nt rolling mean GC content. Sample space comprises locations where PAR is present within a TSS with corresponding transcript abundance information (“active TSS”). Sample was sorted by GC content and divided into nonoverlapping bins of 250,000 observations. The mean PAR and mean GC content for each bin is plotted. The process was performed for no ATMi and +ATMi PAR samples. (E) As in (D), but for no ATMi and +ATMi R-ChIP. (F) As in (E), but for NAC-treated R-ChIP. (G) Mean PAR ChIP plotted against mean GC content and mean R-ChIP (no ATMi samples only). Sample space comprises locations where PAR and R-ChIP signal are both present. Sample space was first sorted by GC content into nonoverlapping bins of 500,000 observations. Each 500,000 observations bin was then sorted by R-ChIP value before being divided into nonoverlapping bins of 25,000 observations. Each 25,000 observations bin was plotted based on mean PAR signal and mean GC content and colored by ln(R-ChIP). (H) As in (G), but for +ATMi ChIP. (I) Mean ChIP signal per GC bins for various subsets of locations (no ATMi samples only). Subset of locations where PAR and R-ChIP coincide was sorted by GC content and divided into nonoverlapping bins of 250,000 observations. Subset of locations where PAR is present but R-ChIP is not and subset of locations where R-ChIP is present but PAR is not were each sorted by GC content and divided into nonoverlapping bins of 1 million observations. (J) As in (I), but for ATMi-treated cells.

Update of

Similar articles

Cited by

References

    1. Rothblum-Oviatt C, Wright J, Lefton-Greif MA, McGrath-Morrow SA, Crawford TO, and Lederman HM (2016). Ataxia telangiectasia: a review. Orphanet J. Rare Dis. 11, 159. 10.1186/s13023-016-0543-7. - DOI - PMC - PubMed
    1. Shiloh Y, and Ziv Y (2013). The ATM protein kinase: regulating the cellular response to genotoxic stress, and more. Nat. Rev. Mol. Cell Biol. 14, 197–210. 10.1038/nrm3546. - DOI - PubMed
    1. Lee J-H, and Paull TT (2021). Cellular functions of the protein kinase ATM and their relevance to human disease. Nat. Rev. Mol. Cell Biol. 22, 796–814. 10.1038/s41580-021-00394-2. - DOI - PubMed
    1. Guo Z, Kozlov S, Lavin MF, Person MD, and Paull TT (2010). ATM activation by oxidative stress. Science 330, 517–521. 10.1126/science.1192912. - DOI - PubMed
    1. Barzilai A, Rotman G, and Shiloh Y (2002). ATM deficiency and oxidative stress: a new dimension of defective response to DNA damage. DNA Repair 1, 3–25. - PubMed