. 2024 Mar 12;121(11):e2319634121.
doi: 10.1073/pnas.2319634121. Epub 2024 Mar 5.

DNA corona on nanoparticles leads to an enhanced immunostimulatory effect with implications for autoimmune diseases

Affiliations

DNA corona on nanoparticles leads to an enhanced immunostimulatory effect with implications for autoimmune diseases

Faisal Anees et al. Proc Natl Acad Sci U S A. .

Abstract

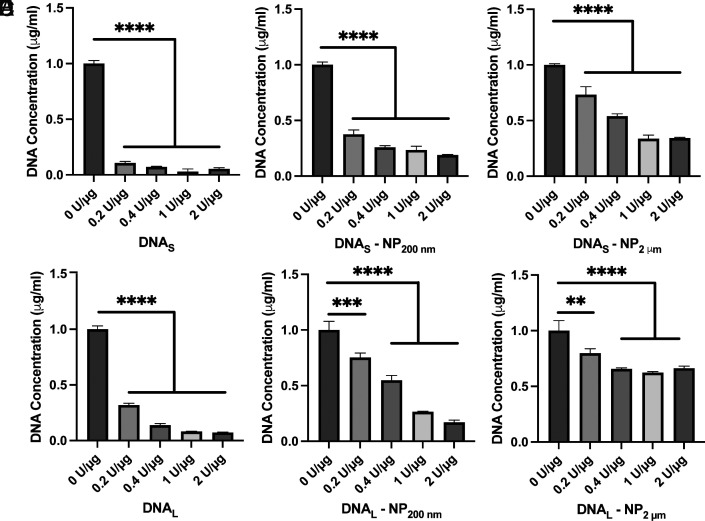
Autoimmune and inflammatory diseases are highly complex, limiting treatment and the development of new therapies. Recent work has shown that cell-free DNA bound to biological microparticles is linked to systemic lupus erythematosus, a prototypic autoimmune disease. However, the heterogeneity and technical challenges associated with the study of biological particles have hindered a mechanistic understanding of their role. Our goal was to develop a well-controlled DNA-particle model system to understand how DNA-particle complexes affect cells. We first characterized the adsorption of DNA on the surface of polystyrene nanoparticles (200 nm and 2 µm) using transmission electron microscopy, dynamic light scattering, and colorimetric DNA concentration assays. We found that DNA adsorbed on the surface of nanoparticles was resistant to degradation by DNase 1. Macrophage cells incubated with the DNA-nanoparticle complexes had increased production of pro-inflammatory cytokines tumor necrosis factor alpha (TNF-α) and interleukin 6 (IL-6). We probed two intracellular DNA sensing pathways, toll-like receptor 9 (TLR9) and cyclic GMP-AMP synthase (cGAS)-stimulator of interferon genes (STING), to determine how cells sense the DNA-nanoparticle complexes. We found that the cGAS-STING pathway is the primary route for the interaction between DNA-nanoparticles and macrophages. These studies provide a molecular and cellular-level understanding of DNA-nanoparticle-macrophage interactions. In addition, this work provides the mechanistic information necessary for future in vivo experiments to elucidate the role of DNA-particle interactions in autoimmune diseases, providing a unique experimental framework to develop novel therapeutic approaches.

Keywords: DNA; autoimmune disease; corona; inflammation; nanoscience.


Conflict of interest statement

Competing interests statement:The authors declare no competing interest.

Figures

Fig. 1.
Fig. 1.
Characterization of NPs and the DNA corona. (A) Preparation of DNA coronas. The structure of the DNA on the NP surface is not known. This schematic is only illustrative. (B) TEM images of NPs with and without DNA coronas comparing short (DNAS, sheared) and long (DNAL, unsheared) DNA. (C) Hydrodynamic diameter (left y axis) and polydispersity index (PDI; right y axis) of NPs with DNAS and DNAL coronas. Significance was determined using one-way ANOVA with Tukey multiple comparison post hoc. (D) Concentration of DNAS and DNAL adsorbed on the surface of NPs. The NP concentration was normalized to 500 pM to allow for comparison between NP diameters. Error bars reflect ±1 SD. Significance was determined using unpaired t tests. ****P < 0.0001, ns = not significant. n = 3 distinct samples.
Fig. 2.
Fig. 2.
Concentration of DNA present following treatment of DNA–NPs with DNase 1 (0.2 U/µg to 2 U/µg; 30 min, 37 °C). (A) DNAS (B) DNAS–NP200 nm (C) DNAS–NP2 µm (D) DNAL (E) DNAL–NP200 nm (F) DNAL–NP2 µm. Error bars reflect ±1 SD. Significance was measured using one-way ANOVA with Tukey’s multiple comparisons post hoc. **P < 0.01, ***P < 0.001, ****P < 0.0001, nonsignificant comparisons are not displayed. n = 3 distinct samples.
Fig. 3.
Fig. 3.
Representative TEM images of macrophages incubated with NPs and DNA–NPs (200 nm and 2 µm; 24 h at 37 °C). (A) Cells incubated with 200 nm NPs (bare) or DNAS and DNAL coronas. (B) Cells incubated with 2 µm NPs (bare) or DNAS and DNAL coronas. (C) i. Representative image of an untreated cell used as a control. ii, 200 nm NPs and iii, 2 µm NPs prepared and stained for TEM using the same embedding, staining, and microtoming method as used for the cells. We also observed internalization of NPs and DNA–NPs using confocal microscopy (SI Appendix, Fig. S4).
Fig. 4.
Fig. 4.
TNF-α and IL-6 release by macrophages incubated with DNA–NPs (24 h at 37 °C). (A) TNF-α release measured after incubation of cells with short (S; sheared) DNA (green filled circles), DNAS–NP200 nm (blue filled squares), and DNAS–NP2 μm (magenta filled triangles), and NPs in the absence of DNA (blue and magenta unfilled squares and triangles). (B) TNF-α release measured after incubation of cells with long (L; unsheared) DNA (green filled circles), DNAL–NP200 nm (blue filled squares), and DNAL–NP2 μm (magenta filled triangles), and NPs in the absence of DNA (blue and magenta unfilled squares and triangles). Similar results were observed with human macrophage-like cells (THP-1; SI Appendix, Fig. S5). (C) IL-6 release measured after incubation of cells with short (S; sheared) DNA (green filled circles), DNAS–NP200 nm (blue filled squares), and DNAS–NP2 μm (magenta filled triangles), and NPs in the absence of DNA (blue and magenta unfilled squares and triangles). (D) IL-6 release measured after incubation of cells with long (L; unsheared) DNA (green filled circles), DNAL–NP200 nm (blue filled squares), and DNAL–NP2 μm (magenta filled triangles), and NPs in the absence of DNA (blue and magenta unfilled squares and triangles). Error bars reflect ±1 SEM. Significance was measured using a two-way ANOVA with Tukey’s multiple comparisons post hoc. ****P < 0.0001, nonsignificant comparisons are not displayed. n = 3 distinct samples.
Fig. 5.
Fig. 5.
TNF-α and IL-6 release by macrophages incubated (24 h at 37 °C) with NPs and DNA added separately (DNA + NPs) to cells. (A) TNF-α release measured after incubation of cells with short (S; sheared) DNAS (green filled circles), DNAS + NP200 nm (blue filled squares), and DNAS + NP2 µm (magenta filled triangles). (B) TNF-α release measured after incubation of cells with long (L; unsheared) DNAL (green filled circles), DNAL + NP200 nm (blue filled squares) and DNAL + NP2 µm (magenta filled triangles). (C) IL-6 release measured after incubation of cells with DNAS (green filled circles), DNAS + NP200 nm (blue filled squares), and DNAS + NP2 µm (magenta filled triangles). (D) IL-6 release measured after incubation of cells with DNAL (green filled circles), DNAL + NP200 nm (blue filled squares), and DNAL + NP2 µm (magenta filled triangles). Error bars reflect ±1 SEM. Significance was measured using a two-way ANOVA with Tukey’s multiple comparisons post hoc. ****P < 0.0001, nonsignificant comparisons are not displayed. n = 3 distinct samples.
Fig. 6.
Fig. 6.
Comparison of TNF-α release by cells treated with DNA + NPs (3 µg/mL DNA) separately, DNA–NPs (3 µg/mL DNA), and DNA (3 µg/mL). Data is a repeat of Figs. 4 and 5. Error bars reflect ±1 SEM. Significance was measured using two-way ANOVA with Tukey’s multiple comparisons post hoc. **P < 0.01, ***P < 0.001, ****P < 0.0001, ns = not significant. n = 3 distinct samples.
Fig. 7.
Fig. 7.
TNF-α release by macrophages in response to DNA and DNA–NPs treated with DNase 1 (0 to 5 U/µg) (24 h at 37 °C). (A) DNAS and DNAS–NPs (1 µg/mL). (B) DNAL and DNAL–NPs (1 µg/mL). Error bars reflect ±1 SEM. Significance was measured using one-way ANOVA with Sidak’s multiple comparisons post hoc. **P < 0.01, ***P < 0.001, ns = not significant. n = 3 distinct samples.
Fig. 8.
Fig. 8.
TNF-α release by macrophages incubated with free DNA (1 µg/mL) and DNA–NPs (1 µg/mL) in the presence of ODN 2088 (0.1 µM), a TLR9 inhibitor. (A) DNAS and DNAS–NPs. (B) DNAL and DNAL–NPs. Error bars reflect ±1 SEM. Significance was measured using two-way ANOVA with Sidak’s multiple comparisons post hoc. **P < 0.01, nonsignificant comparisons are not displayed. n = 3 distinct samples.
Fig. 9.
Fig. 9.
TNF-α release by macrophages incubated with free DNA (1 µg/mL) and DNA–NPs (1 µg/mL) (24 h at 37 °C) in the presence of cGAS-STING inhibitors [RU.521 (10 µg/mL) and H-151 (5 µM)]. The inhibitors were added to cells 24 h prior to the DNA or DNA–NPs and remained present during experiments. (A) DNAS and DNAS–NPs with RU.521. (B) DNAL and DNAL–NPs with RU.521. (C) DNAS and DNAS–NPs with H-151. (D) DNAL and DNAL–NPs with H-151. Error bars reflect ±1 SEM. Significance was measured using two-way ANOVA with Sidak’s multiple comparisons post hoc. ***P < 0.001, ****P < 0.0001. n = 3 distinct samples.
Fig. 10.
Fig. 10.
Schematic representation of DNA and DNA–NPs stimulating cells via the cGAS-STING and TLR9 pathways. DNA can be internalized into endosomes and stimulate immune cells through a TLR9-dependent process or enter the cytosol and interact through a cGAS-STING-dependent pathway. Our data suggests that DNA–NPs, stimulate cells though a cGAS-STING-dependent pathway. The stimulation of cells results in the release of cytokines such as TNF-α and IL-6.

Similar articles

Cited by

References

    1. Kustanovich A., Schwartz R., Peretz T., Grinshpun A., Life and death of circulating cell-free DNA. Cancer Biol. Ther. 20, 1057–1067 (2019). - PMC - PubMed
    1. Pisetsky D. S., The origin and properties of extracellular DNA: From PAMP to DAMP. Clin. Immunol. 144, 32–40 (2012). - PMC - PubMed
    1. Aucamp J., Bronkhorst A. J., Badenhorst C. P. S., Pretorius P. J., The diverse origins of circulating cell-free DNA in the human body: A critical re-evaluation of the literature. Biol. Rev. 93, 1649–1683 (2018). - PubMed
    1. Mondelo-Macía P., Castro-Santos P., Castillo-García A., Muinelo-Romay L., Diaz-Peña R., Circulating free DNA and its emerging role in autoimmune diseases. J. Pers. Med. 11, 151 (2021). - PMC - PubMed
    1. Murao A., Aziz M., Wang H., Brenner M., Wang P., Release mechanisms of major DAMPs. Apoptosis 26, 152–162 (2021). - PMC - PubMed