. 2024 Apr 1;221(4):e20230774.
doi: 10.1084/jem.20230774. Epub 2024 Mar 5.

NADPH oxidase exerts a B cell-intrinsic contribution to lupus risk by modulating endosomal TLR signals

Affiliations

NADPH oxidase exerts a B cell-intrinsic contribution to lupus risk by modulating endosomal TLR signals

Shuozhi Liu et al. J Exp Med. .

Abstract

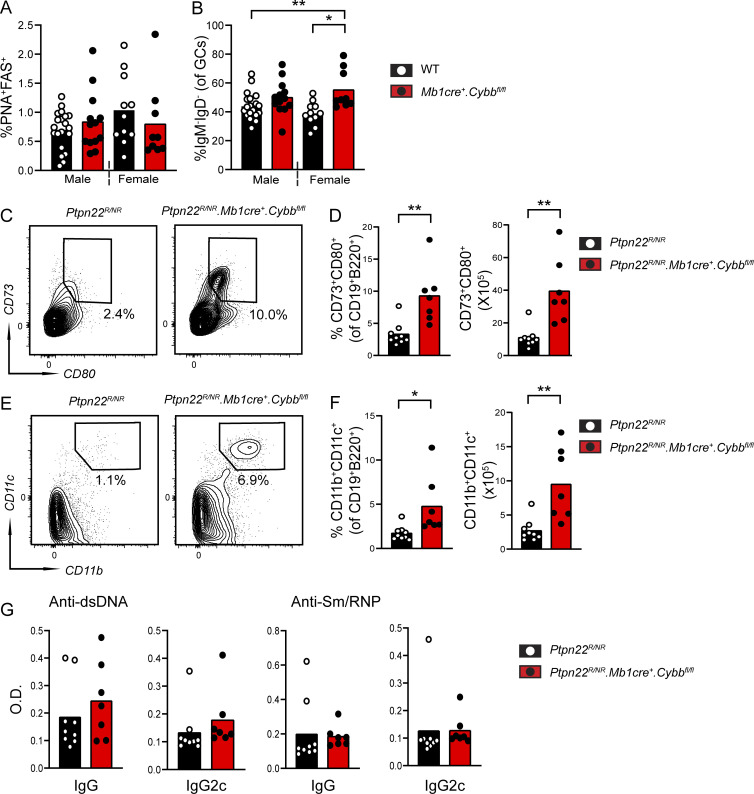
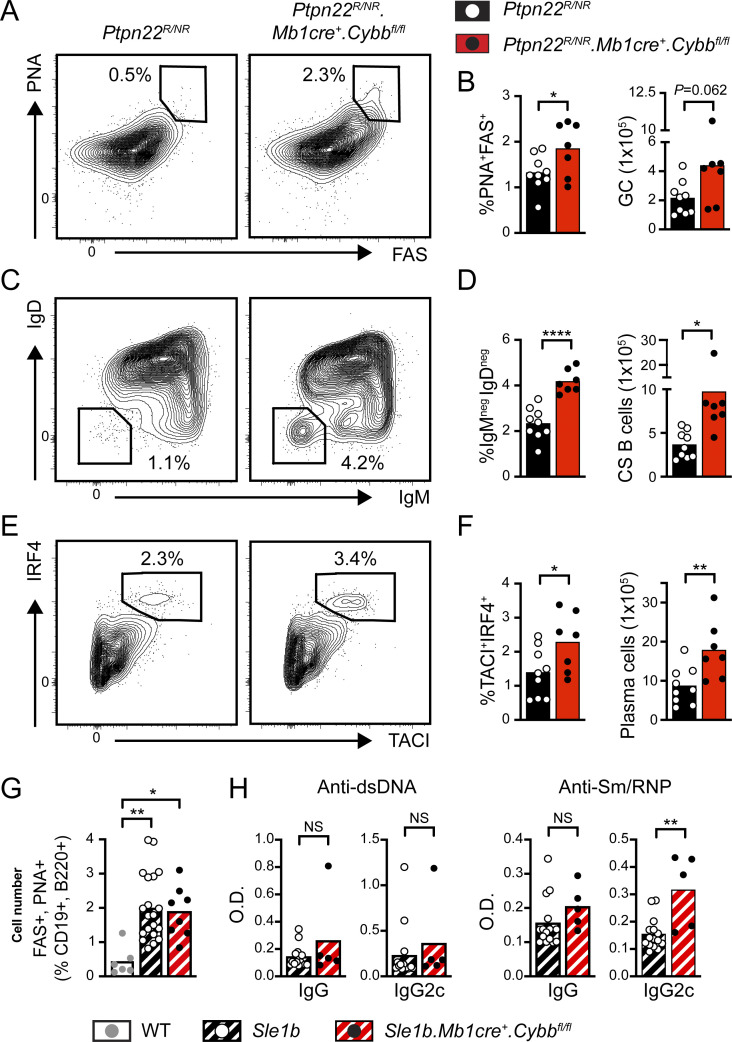
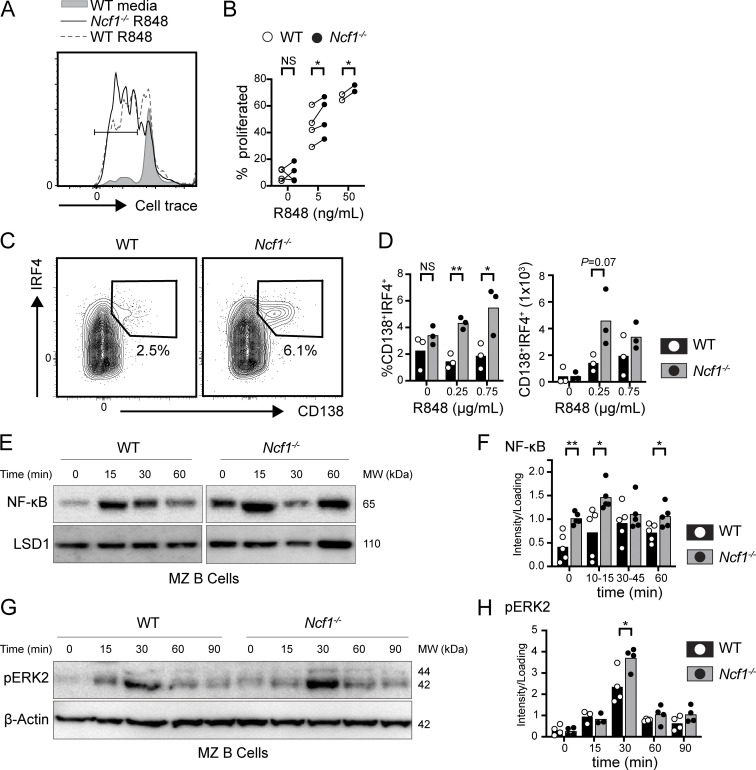
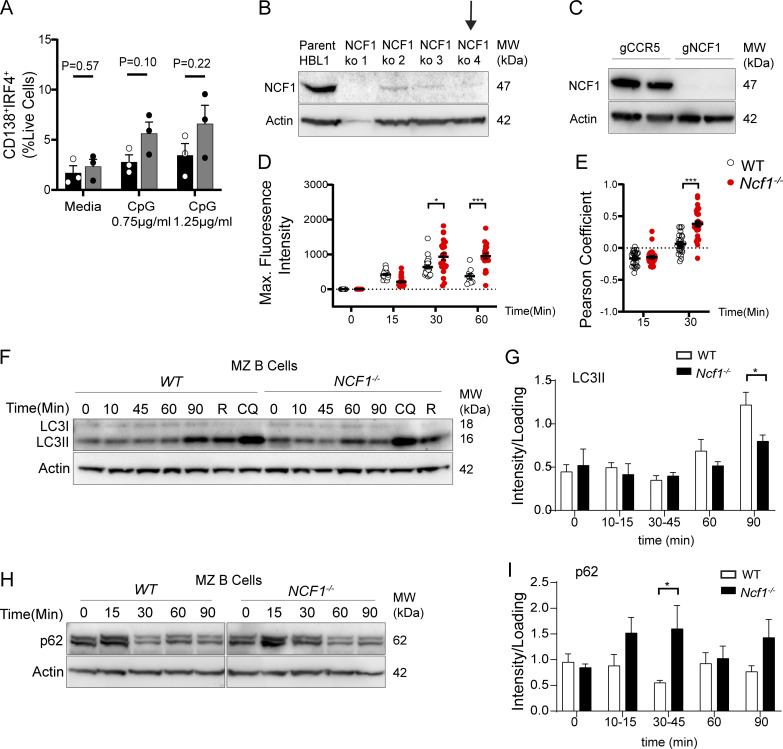
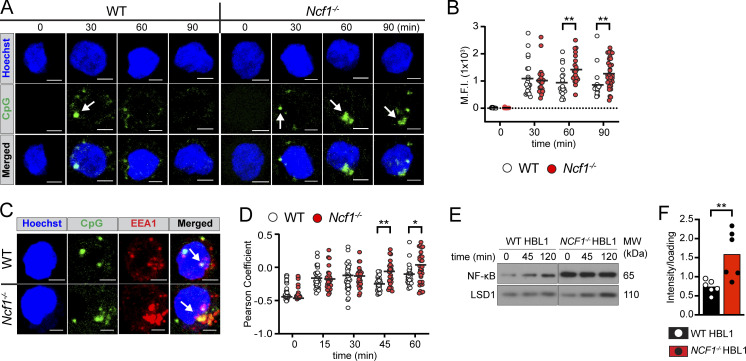
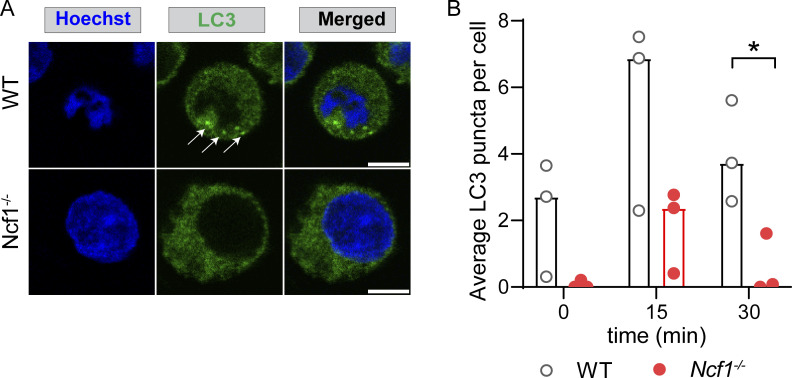
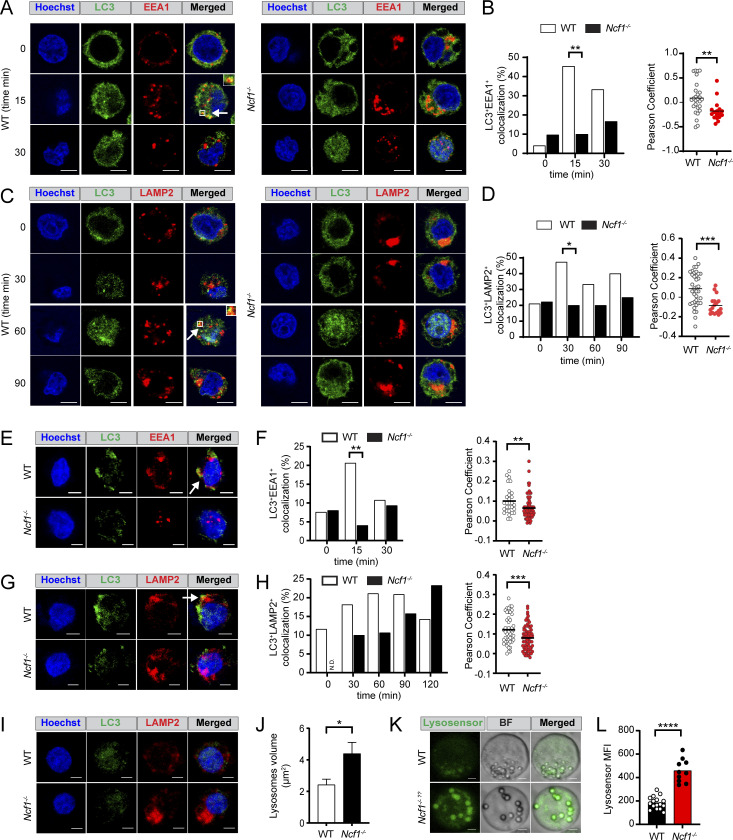
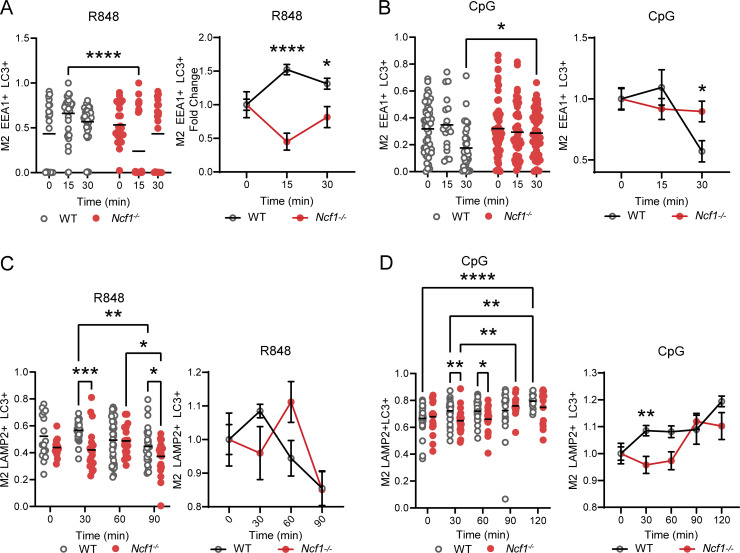
Genome-wide association studies in systemic lupus erythematosus (SLE) have linked loss-of-function mutations in phagocytic NADPH oxidase complex (NOX2) genes, including NCF1 and NCF2, to disease pathogenesis. The prevailing model holds that reduced NOX2 activity promotes SLE via defective efferocytosis, the immunologically silent clearance of apoptotic cells. Here, we describe a parallel B cell-intrinsic mechanism contributing to breaks in tolerance. In keeping with an important role for B cell Toll-like receptor (TLR) pathways in lupus pathogenesis, NOX2-deficient B cells exhibit enhanced signaling downstream of endosomal TLRs, increased humoral responses to nucleic acid-containing antigens, and the propensity toward humoral autoimmunity. Mechanistically, TLR-dependent NOX2 activation promotes LC3-mediated maturation of TLR-containing endosomes, resulting in signal termination. CRISPR-mediated disruption of NCF1 confirmed a direct role for NOX2 in regulating endosomal TLR signaling in primary human B cells. Together, these data highlight a new B cell-specific mechanism contributing to autoimmune risk in NCF1 and NCF2 variant carriers.


Conflict of interest statement

Disclosures: S.W. Jackson reported personal fees from Bristol-Myers Squib during the conduct of the study; and personal fees from ChemoCentryx, Inc. and Variant Bio outside the submitted work. No other disclosures were reported.

Figures

Figure S1.
Figure S1.
Validation and gating strategies for Qβ-VLP immunization models. (A) Splenic VLP-specific GC B cell counts in WT and Tlr7−/− mice. (B) ELISA dilution curves showing anti-VLP IgG2c titers in WT (solid circles) and Tlr7−/− (open circles) mice. Each line indicates an individual animal. 20 = 1:100 dilution. (C) Anti-VLP IgG (left) and IgG2c (right) titers (by endpoint titer) in WT and Tlr7−/− mice. (A–C) Data were generated using two independent immunization experiments, with representative data from one experiment (A and B) and combined data (C) shown. **, P < 0.01; ***, P < 0.001, by one-way ANOVA, followed by Tukey’s multiple comparison test (A) and two-tailed Mann–Whitney test (C). Animals were immunized with 20 μg Qβ-VLP and analyzed at 12 days after immunization. (D) Gating strategy to identify CD45.1+ versus CD45.2+ VLP-specific GC B cells. (E) Left: Gating strategy to identify murine plasma cells gated as CD19B220TACI+IRF4+. Right: Histogram confirming expression of known plasma cell markers (CD38, CD138, BCMA, and CXCR4) on TACI+IRF4+ population (black, solid) versus TACIIRF4 cells (gray, dotted).
Figure 1.
Figure 1.
B cell–intrinsic NADPH oxidase complex deletion promotes TLR-dependent humoral responses. (A) Representative FACs plots showing NP-specific GC B cells in WT and Ncf1−/− animals 14 days after immunization with NP-CGG in alum. Frequencies indicate %FAS+CD38 GC B cells as a percentage of NP+B220+ B cells. (B) Percentage of NP+FAS+CD38 GC B cells of total splenic B cells. (C) Anti-NP30 IgM and IgG titers (normalized to the mean of male WT animals for each experiment). (D) Representative FACs plots showing VLP-specific GC B cells in WT and Ncf1−/− animals 14 days after immunization with Qβ-VLP. Frequencies indicate %FAS+CD38 GC B cells as a percentage of VLP-specific B cells. (E) Percentage of VLP-specific GC B cells of total splenic B cells. (F) Anti-VLP IgG and IgG2c titers in indicated genotypes. (G) Representative FACS plots showing VLP-specific GC B cells in WT:WT and WT:Ncf1−/− animals 14 days after immunization with Qβ-VLP. Cells gated on CD45.2+ B cells from each respective chimera. The number indicates the percentage within the gate. (H) Percentage of VLP-specific FAS+CD38 GC B cells as a proportion of CD45.2+ WT or Ncf1−/− B cells in respective WT:WT and WT:Ncf1−/− chimeras. (I) Selection of VLP-specific CD45.1+ versus CD45.2+ B cells into GC compartment in control (CD45.1+ WT versus CD45.2+ WT) versus NCF1-deficient (CD45.1+ WT versus CD45.2+ Ncf1−/−) competitive chimeras following Qβ-VLP immunization (data normalized to mean WT:WT ratio for each of two independent experiments). (J) Anti-VLP IgG and IgG2c titers from control versus Mb1cre.Cybbfl/fl mice at 14 days after immunization (data normalized to mean titers in male WT animals). (K) Anti-VLP IgG titers at >180 days after immunization (normalized to male WT animals). (L) Representative ELISPOT images of VLP-specific IgG (left) and IgG2c (right) production by BM cells from male and female control and Mb1cre.Cybbfl/fl mice. Data generated at >300 days after Qβ-VLP immunization. (M) ELISPOT spot number per 2 × 10⁶ BM cells from male and female control and Mb1cre.Cybbfl/fl mice. (A–K) Data showed one representative experiment (F, n = 3–10/group), or combined from two (A–E, n = 2–23/group; G–I, n = 4–6/group; K, n = 6–11/group; M, n = 4–10/group) and three (J, n = 11–16/group) independent experiments. Each point represents an individual experimental animal and bars indicate the mean. *, P < 0.05; **, P < 0.01; ***, P < 0.001; and ****, P < 0.0001 by one-way ANOVA, followed by Tukey’s multiple comparison test (B, C, E, F, H, J, K, and M) or by two-tailed Student’s t test (I).
Figure 2.
Figure 2.
Spontaneous humoral autoimmunity in aged Ncf1-deficient mice. (A) Representative FACs plots (gated on CD19+ B cells) showing spontaneous splenic GCs in 1-year-old WT and Ncf1−/− mice. Number: percentage of PNA+FAS+ GC B cells. (B) Percentage and total number of splenic GC B cells in 1-year-old WT and Ncf1−/− mice. (C) Representative FACS plots (gated on B220CD19 splenocytes) showing the expansion of TACI+IRF4+ plasma cells in Ncf1−/− animals. (D) Percentage and total number of splenic TACI+IRF4+ plasma cells in 1-year-old WT and Ncf1−/− mice. (E) Representative splenic sections stained with B220 (red), PNA (green), and CD3 (blue) showing spontaneous GC formation in Ncf1−/− mice. Scale bars, 100 µm. (F) Hep-2 ANA IgG and IgG2c staining in representative female WT and Ncf1−/− mice. Scale bars, 100 µm. (G) Quantification of Hep-2 ANA IgG and IgG2c staining intensity in female WT and Ncf1−/− mice. ANA staining intensity (range 0–4) was scored by three independent observers blinded to genotype and subsequently averaged. (H) Anti-dsDNA and anti-Sm/RNP IgG titers in 1-year-old female WT and Ncf1−/− mice. (A–H) Data combined from of two (D, n = 9–13/group; H, n = 5–8/group), or three (B, n = 13–16/group; G, n = 11–18/group) independent experimental cohorts. Each point represents an individual experimental animal. *, P < 0.05; **, P < 0.01; ***, P < 0.001; and ****, P < 0.0001 by one-way ANOVA, followed by Tukey’s multiple comparison test (B and D) or by two-tailed Student’s t test (G and H).
Figure 3.
Figure 3.
Spontaneous B cell activation in B cell–intrinsic Ncf1-deficient chimeras. (A–H) Flow cytometry analysis of NCF1-deficient chimeras at 24 wk after BM transplant. (A and B) Representative FACS plots (gated on B220+CD19+ splenic B cells) showing spontaneous GCs (A; number: %FAS+CD38 GC B cells in gate), and (B) percentage and total number of splenic GC B cells in indicated chimeras. (C and D) Representative FACS plots (C, gated on B220+CD19+ splenic B cells), and (D) percentage and total number of splenic CD11b+CD11c+ ABCs. (E and F) Representative FACS plots (E, gated on total splenocytes), and (F) percentage and total number of splenic TACI+IRF4+ cells showing the expansion of splenic plasma cells in female B cell–intrinsic Ncf1−/− chimeras. (G and H) Representative FACS plots (gated on B220+CD19+ splenic B cells) showing class-switched B cells (G; number: percentage in IgMIgD gate), and (H) percentage and total number of splenic IgMIgD class-switched B cells in indicated chimeras. (I) Anti-dsDNA and anti-sm/RNP IgG2c titers at 24-wk after chimera reconstitution. (A–I) Data are combined from three independent chimera cohorts. Each point represents an individual experimental animal sacrificed 24 wk after BM transfer. *, P < 0.05; **, P < 0.01; ***, P < 0.001; and ****, P < 0.0001 by one-way ANOVA, followed by Tukey’s multiple comparison test.
Figure S2.
Figure S2.
B cell–intrinsic Cybb deletion promotes B cell activation in low-penetrance autoimmune strains. (A and B) Percentage of splenic GC B cells (A) and percentage of class-switched B cells (%IgMIgD within GC B cell gate) in 10-mo-old WT and Mb1cre.Cybbfl/fl mice. (C) Representative FACS plots showing CD80+CD73+ memory B cells (gated on B220+CD19+ B cells) in Ptpn22R/NR controls and Ptpn22R/NR.Mb1cre.Cybbfl/fl mice. (D) Percentage and total number of CD80+CD73+ memory B cells in indicated strains. (E) Representative FACS plots showing expansion of CD11b+CD11c+ ABCs (gated on B220+CD19+ B cells) in Ptpn22R/NR.Mb1cre.Cybbfl/fl mice relative to Ptpn22R/NR controls. (F) Percentage and total number of CD11b+CD11c+ ABCs in indicated strains. (G) Anti-dsDNA and anti-Sm/RNP IgG and IgG2c titers in 10-mo-old female Ptpn22R/NR controls and Ptpn22R/NR.Mb1cre.Cybbfl/fl mice. (A–G) Data from more than three independent experimental cohorts. Each point represents an individual experimental animal. *, P < 0.05; **, P < 0.01 by one-way ANOVA, followed by Tukey’s multiple comparison test (A and B) or by two-tailed Student’s t test (D, F, and G).
Figure 4.
Figure 4.
B cell–intrinsic Cybb deletion facilitates breaks in B cell tolerance on low-penetrance autoimmune backgrounds. (A, C, and E) Representative FACs plots showing expansion of PNA+FAS+ GC B cells (A), IgMIgD class-switched B cells (C), and TACI+IRF4+ plasma cells (E) in female Ptpn22R/NR controls and Ptpn22R/NR.Mb1cre.Cybbfl/fl mice. Number equals percentage within the gate. (B, D, and F) Percentage (left) and total number (right) of splenic PNA+FAS+ GC B cells (B), IgMIgD class-switched B cells (D), and TACI+IRF4+ plasma cells (F) in female Ptpn22R/NR controls (black) and Ptpn22R/NR.Mb1cre.Cybbfl/fl (red) mice. (G) Percentage of PNA+FAS+ GC B cells in 4-mo-old female WT (gray), Sle1b+/+ (black hashed), and Sle1b+/+.Mb1cre.Cybbfl/fl (red hashed) mice. (H) Anti-dsDNA and anti-Sm/RNP IgG and IgG2c titers from 4-mo-old female Sle1b+/+ (black hashed), and Sle1b+/+.Mb1cre.Cybbfl/fl (red hashed) mice. (A–H) Data are combined from two (H) or three (A–G) independent experimental cohorts. Each point represents an individual experimental animal. *, P < 0.05; **, P < 0.01; and ****, P < 0.0001, by one-way ANOVA, followed by Tukey’s multiple comparison test (G) or by two-tailed Student’s t test (B, D, F, and H).
Figure 5.
Figure 5.
Increased endosomal TLR signaling in NCF1-deficient mouse B cells. (A and B) Sorted MZ B cells from female WT and Ncf1−/− mice were stimulated with TLR7 agonist, R848. (A) Histogram depicting CellTrace Violet dilution in WT (R848 0 ng/ml; gray filled), WT (R848 5 ng/ml; gray line), and Ncf1−/− (R848 5 ng/ml; black line) MZ B cells. Gate: percentage proliferated. (B) Proliferation of sorted WT versus Ncf1−/− MZ B cells 48 h after stimulation with indicated R848 dose. Each paired data point represents an independent experiment. (C and D) Splenic B cells cultured for 4 days on CD40L/BAFF-expressing feeder cells plus 10 ng/ml IL-21, and the indicated dose of R848. (C) Representatives FACS plots (gated on live cells) showing in vitro generation of CD138+IRF4+ plasma cells (number equals percentage in gate). (D) Percentage and total number of CD138+IRF4+ plasma cells following stimulation with indicated R848 dose. Each point represents an individual experimental animal. (E) Nuclear translocation of NFκB by western blot in sorted female WT and Ncf1−/− MZ B cells after CpG stimulation at indicated times. Western blot of nuclear LSD1 was used as a protein loading control. MW, molecular weight. (F) Quantification of nuclear NF-κB by densitometry, corrected for loading control. MW, molecular weight. (G and H) Representative western blot of cytosolic pERK2 (G) and pERK2 quantification (H) in sorted female WT and Ncf1−/− MZ B cells after CpG stimulation for indicated times. Actin was used to normalize protein loading. Each point represents an independent experiment. (A–H) Bars indicate mean. Data are combined from two (D), four (B and H), and five (F) independent experiments. *, P < 0.05; and **, P < 0.01 by paired (B) or unpaired Student’s t test (D, F, and H). Source data are available for this figure: SourceData F5.
Figure S3.
Figure S3.
Independent replicates of B cell in vitro stimulation, confirmation of CRISPR-mediated NCF1 deletion, and impact of NCF1 deletion on p62 accumulation. (A) Splenic B cells cultured for 4 days on CD40L/BAFF-expressing feeder cells plus 10 ng/ml IL-21 and indicated dose of CpG. Percentage of CD138+IRF4+ shown. Each point represents the mean of technical replicates for each individual experimental animal. Bars, mean ± SEM. (B) Efficient CRISPR-mediated deletion of NCF1 in HBL1 cells by western blot. Also shown is a western blot for actin to normalized protein loading. Black arrow indicates the clone used for experiments. MW, molecular weight. (C) Western blot showing successful NCF1 deletion in primary human B cells. Actin staining was used to normalize protein loading. MW, molecular weight. (D) Fluorescent CpG maximum signal intensity in control and NCF1−/− HBL1 cells. Each point represents a single cell (n = 9–26 per condition). Independent replicate of data show in Fig. 6 B. (E) Pearson’s coefficient of EEA1 and CpG signal colocalization (above Costes threshold), masked by EEA1 staining after CpG stimulation for 15 and 30 min. Each point represents a single cell (n = 24–37/condition). Independent replicate of data show in Fig. 6 B. (F) Western blot of LC3-II in cytosolic fraction after CpG stimulation for 0–90 min, or after stimulation with rapamycin (R) and chloroquine (CQ) for 90 min to induce autophagy. Actin was used to normalize protein loading. MW, molecular weight. (G) Quantification of cytosolic LC3-II by densitometry (corrected for loading control). (H) Western blot of p62 in cytosolic fraction after stimulation with CpG for 0–90 min. Actin was used to normalize protein loading. MW, molecular weight. (I) Quantification of cytosolic p62 levels by densitometry (corrected for loading control). (B, D, G, and I) Bars show mean ± SEM of each individual experiment. Data were generated from two (A), four (G), five (I) independent experiments. (A, D, F, and H) *, P < 0.05; ***, P < 0.001 by two-tailed Student’s t test. Source data are available for this figure: SourceData FS3.
Figure 6.
Figure 6.
NCF1 deletion alters CpG trafficking and degradation in HBL1 cell line. (A) Confocal microscopy showing intracellular trafficking of fluorescence CpG in control versus NCF1-deficient HBL1 cells. Hoechst staining indicates the location of the nucleus. White arrows indicate CpG aggregates. Scale bars, 3 µm. (B) Maximum fluorescence intensity of CpG signal. Z stacks were compressed to a single plane to sum analysis. Each data point represents a single cell (n = 9–32 per condition). Graph shows representative data from one of two independent experiments yielding similar findings. (C) Colocalization of fluorescent CpG and EEA1 at 45 min after CpG stimulation. Hoechst staining indicates the location of the nucleus. White arrows highlight CpG and EEA1 colocalization. (D) Pearson’s coefficient of EEA1 and CpG signal colocalization (above Costes threshold), masked by EEA1 staining after CpG stimulation for 0–60 min. Z stacks were not compressed for this analysis. Each point represents a single cell (n = 25–52/condition). Graph shows representative data from one of two independent experiments yielding similar findings. (E) Nuclear translocation of NF-κB by western blot in control versus NCF1−/− HBL1 cells after CpG stimulation for 0, 45, and 120 min. Nuclear LSD1 was used to normalize protein loading. MW, molecular weight. (F) Quantification of nuclear NF-κB by densitometry at baseline, corrected for loading control. Data are combined from six independent experiments. Each data point represents a single experiment. (B, D, and F) Bars/lines indicate the mean. *, P < 0.05; and **, P < 0.01 by unpaired two-tailed Student’s t test. Source data are available for this figure: SourceData F6.
Figure S4.
Figure S4.
NCF1 deletion reduces LC3 lipidation in response to R848 stimulation. (A) Confocal microscopy showing LC3 in control and NCF1-deficient HBL1 cells at 15 min after R848 stimulation. Arrows show LC3 puncta in control cells. Scale bar: 5 µm. (B) Quantification of average LC3 puncta per cell in unstimulated control and NCF1-deficient HBL1 cells through 3D analysis. Every dot represents the average puncta per cell for each individual experiment (n = 3 independent experiments). *, P < 0.05 by two-tailed, paired Student’s t test.
Figure 7.
Figure 7.
NADPH oxidase activation promotes LC3-dependent endolysosomal trafficking in TLR-stimulated HBL1 cells. (A) Confocal microscopy showing LC3 and EEA1 colocalization (arrows/insets) in control and NCF1-deficient HBL1 cells at resting conditions (0) and after 15 and 30 min after R848 stimulation. Scale bar, 5 μm. (B) Left: Percentage of control and NCF1-deficient HBL1 cells exhibiting LC3/EEA1 colocalization at 0–30 min after R848 stimulation. Data are combined from two independent experiments yielding similar findings with n = 38–85 cells/condition. Right: Pearson’s coefficient of LC3 and EEA1 signal colocalization (with Costes threshold) at 15 min after R848 stimulation. Each point represents a single cell (n = 17–27 per condition). Graph shows representative data from one of two independent experiments yielding similar findings. (C) Confocal microscopy showing LC3 and LAMP2 colocalization (arrows/insets) in control and NCF1-deficient HBL1 cells at resting condition (0) and 30, 60, 90 min after R848 stimulation. (D) Left: Percentage of control and NCF1-deficient HBL1 cells exhibiting LC3/LAMP2 colocalization at 0–120 min after R848 stimulation. Data are combined from two independent experiments with n = 69–95 cells/condition. Right: Pearson’s coefficient of LC3 and LAMP2 signal colocalization (with Costes threshold) at 60 min after R848 stimulation. Each point represents a single cell (n = 18–37 per condition). Graph shows representative data from one of two independent experiments yielding similar findings. (E) Confocal microscopy showing LC3 and EEA1 colocalization (white arrows) in control and NCF1-deficient HBL1 cells at 15 min after CpG stimulation. Scale bar, 3 μm. (F) Left: Percentage of control and NCF1-deficient HBL1 cells exhibiting LC3/EEA1 colocalization at 0–30 min after CpG stimulation. Data are combined from two independent experiments yielding similar findings with n = 65–123 cells/condition. Right: Pearson’s coefficient of LC3 and EEA1 signal colocalization (no Costes threshold) at 15 min after CpG stimulation. Each point represents a single cell (n = 29–80 per condition). Graph shows representative data from one of two independent experiments yielding similar findings. (G) Confocal microscopy showing LC3 and LAMP2 colocalization (white arrows) in control and NCF1-deficient HBL1 cells at 60 min after CpG stimulation. (H) Left: Percentage of control and NCF1-deficient HBL1 cells exhibiting LC3/LAMP2 colocalization at 0–120 min after CpG stimulation. Data are combined from two independent experiments with n = 20–114 cells/condition. N.D. = not detected. Right: Pearson’s coefficient of LC3 and LAMP2 signal colocalization (no Costes threshold) at 60 min after CpG stimulation. Each point represents a single cell (n = 48–80 per condition). Graph shows representative data from one of two independent experiments yielding similar findings. (I) Representative confocal microscopy images showing control and NCF1-deficient HBL1 cells at baseline without stimulation. (J) Quantification of individual LAMP2+ lysosome volume in unstimulated control and NCF1-deficient HBL1 cells. Bars indicate mean ± SEM. Graph shows representative data from one of three independent experiments yielding similar findings. (K) Representative confocal microscopy images showing Lysosensor staining of control and NCF1-deficient HBL1 cells. (L) Lysosensor mean fluorescence intensity (MFI). (B, D, F, H, J, and L) Each point represents data from an individual control (white) or NCF1-deficient (red) HBL1 cell analyzed. *, P < 0.05; **, P < 0.01; ***, P < 0.001; and ****, P < 0.0001 by two-tailed Fisher's exact test (B, left; D, left; F, left) and unpaired two-tailed Student’s t test (B, right; D, right; F, right; H, right; J; L).
Figure S5.
Figure S5.
NCF1 deletion reduces the rate of LC3 colocalization in early and late endosomes in response to TLR7 and TLR9 ligands. (A) Left: Manders’ coefficient of fraction of early endosomes overlapping with LC3 in resting (0 min) and after 15 and 30 min of R848 stimulation. Graph shows representative data from one of two independent experiments yielding similar findings. Each point represents a cell, 74–89 cells per condition. Right: Graph showing values of the left panel normalized per the average value at time 0 of every condition, graphing the fold change of Manders’ coefficient at every time point. (B) Left: Manders’ coefficient of fraction of early endosomes overlapping with LC3 in resting (0 min) and after 15 and 30 min of CpG stimulation. Graph shows representative data from one of two independent experiments yielding similar findings. Each point represents a cell, 102–149 cells per condition. Right: Graph showing values of the left panel normalized per the average value at time 0 of every condition, graphing the fold change of Manders’ coefficient at every time point. (C) Left: Manders’ coefficient of fraction of lysosomes overlapping with LC3 in resting (0 min) and after 30, 60, and 90 min of R848 stimulation. Graph shows representative data from one of two independent experiments yielding similar findings. Each point represents a cell, 75–119 cells per condition. Right: gGraph showing values of the left panel normalized per the average value at time 0 of every condition, graphing the fold change of Manders’ coefficient at every time point. (D) Left: Manders’ coefficient of fraction of lysosomes overlapping with LC3 in resting (0 min) and after 30, 60, 90, and 120 min of CpG stimulation. Graph shows representative data from one of two independent experiments yielding similar findings. Each point represents a cell, 85–144 cells per condition. Right: Graph showing values of the left panel normalized per the average value at time 0 of every condition, graphing the fold change of Manders’ coefficient at every time point. Bars/lines indicate the mean or mean with SEM. *, P < 0.05; **, P < 0.01; ***, P < 0.001; and ****, P < 0.0001 by two-way ANOVA, followed by Tukey’s multiple comparison test.
Figure 8.
Figure 8.
Increased TLR responses in NCF1-deficient primary human B cells. (A) Heatmaps of marker expression overlaid on composite t-SNE projection from composite in vitro stimulated primary human B cells. (B) t-SNE projection of human B cell clusters identified using FlowSOM. (C) Heatmap of marker MFI in indicated FlowSOM clusters. (D) Percentage of B cells in each FlowSOM cluster in CCR5−/− control (black circles) and NCF1−/− (open circles) human B cells after day 5 and day 7 in vitro stimulation. (E) Representatives FACS plot showing CD27+CD38+ ASCs on day 7. Number indicates percentage in gate. (F) Percentage of naïve and CD27+CD38+ ASCs in CCR5−/− control (black circles) and NCF1−/− (open circles) human B cells after stimulation for 5 and 7 days. (G) Total IgM and IgG producing ASCs by ELISPOT (spots per 1,600 cells plated). (A–G) Data were generated using two independent primary human B cell CRISPR-editing and in vitro stimulation experiments. Each paired data point was generated using a separate PBMC donor. Graphs show combined data (F and G) or representative data from one of two independent experiments (D and H). *, P < 0.05; **, P < 0.01; by two-tailed ratio paired t test.

References

    1. Acharya, M., Raso F., Sagadiev S., Gilbertson E., Kadavy L., Li Q.Z., Yan M., Stuart L.M., Hamerman J.A., and Lacy-Hulbert A.. 2020. B cell αv integrins regulate TLR-driven autoimmunity. J. Immunol. 205:1810–1818. 10.4049/jimmunol.1901056 - DOI - PMC - PubMed
    1. Acharya, M., Sokolovska A., Tam J.M., Conway K.L., Stefani C., Raso F., Mukhopadhyay S., Feliu M., Paul E., Savill J., et al. . 2016. αv Integrins combine with LC3 and atg5 to regulate Toll-like receptor signalling in B cells. Nat. Commun. 7:10917. 10.1038/ncomms10917 - DOI - PMC - PubMed
    1. Alarcón-Riquelme, M.E., Ziegler J.T., Molineros J., Howard T.D., Moreno-Estrada A., Sánchez-Rodríguez E., Ainsworth H.C., Ortiz-Tello P., Comeau M.E., Rasmussen A., et al. . 2016. Genome-wide association study in an amerindian ancestry population reveals novel systemic lupus erythematosus risk loci and the role of European admixture. Arthritis Rheumatol. 68:932–943. 10.1002/art.39504 - DOI - PMC - PubMed
    1. Amur, S., Parekh A., and Mummaneni P.. 2012. Sex differences and genomics in autoimmune diseases. J. Autoimmun. 38:J254–J265. 10.1016/j.jaut.2011.12.001 - DOI - PubMed
    1. Arkatkar, T., Du S.W., Jacobs H.M., Dam E.M., Hou B., Buckner J.H., Rawlings D.J., and Jackson S.W.. 2017. B cell-derived IL-6 initiates spontaneous germinal center formation during systemic autoimmunity. J. Exp. Med. 214:3207–3217. 10.1084/jem.20170580 - DOI - PMC - PubMed