. 2024 Apr 1;221(4):e20221983.
doi: 10.1084/jem.20221983. Epub 2024 Mar 5.

VEGF-C prophylaxis favors lymphatic drainage and modulates neuroinflammation in a stroke model

Affiliations

VEGF-C prophylaxis favors lymphatic drainage and modulates neuroinflammation in a stroke model

Ligia Simoes Braga Boisserand et al. J Exp Med. .

Abstract

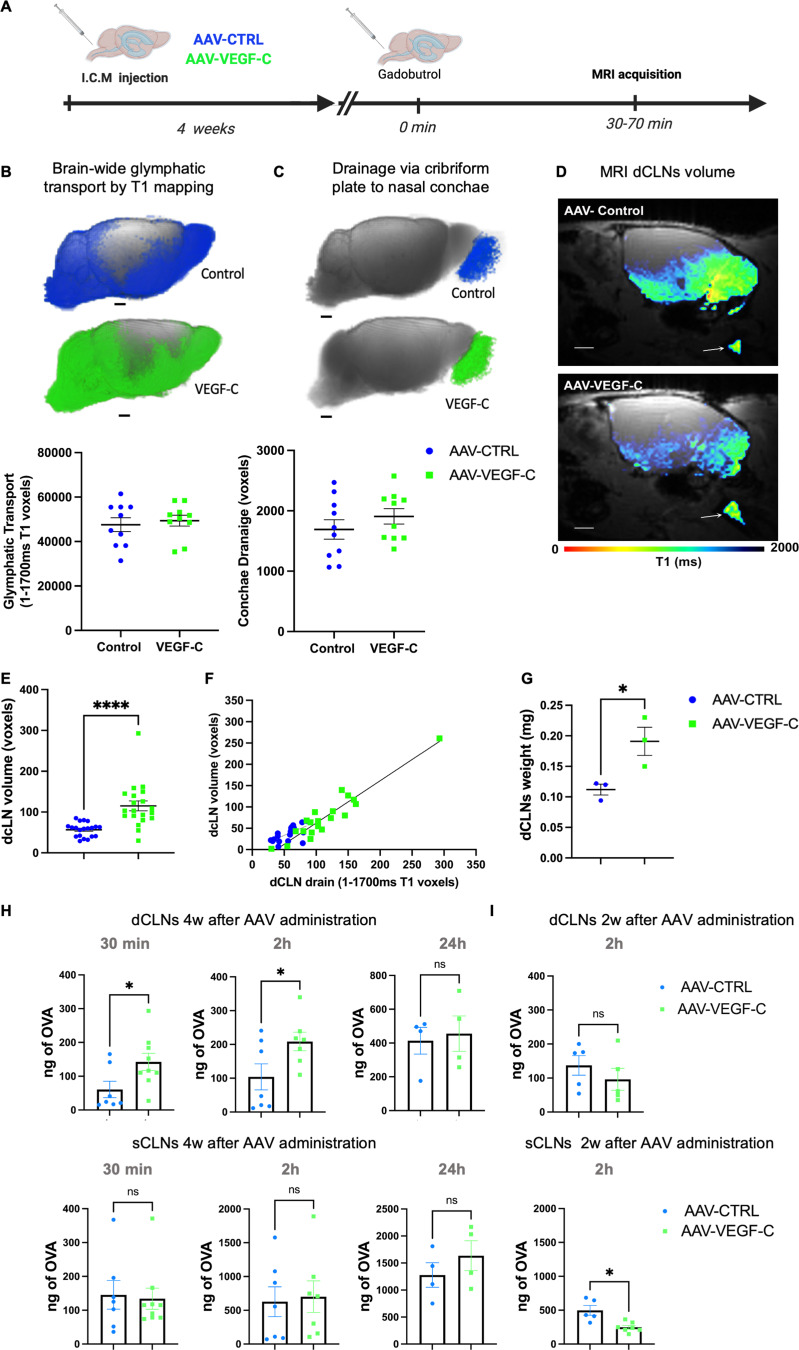
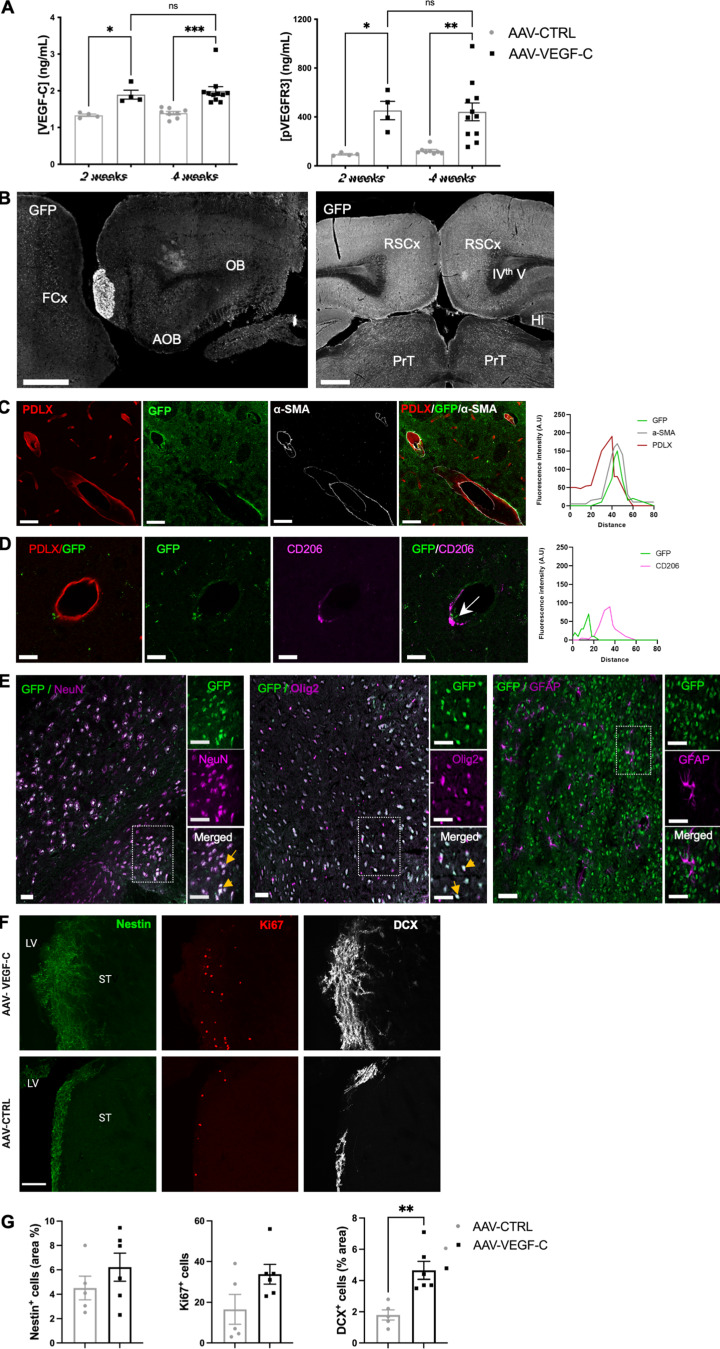
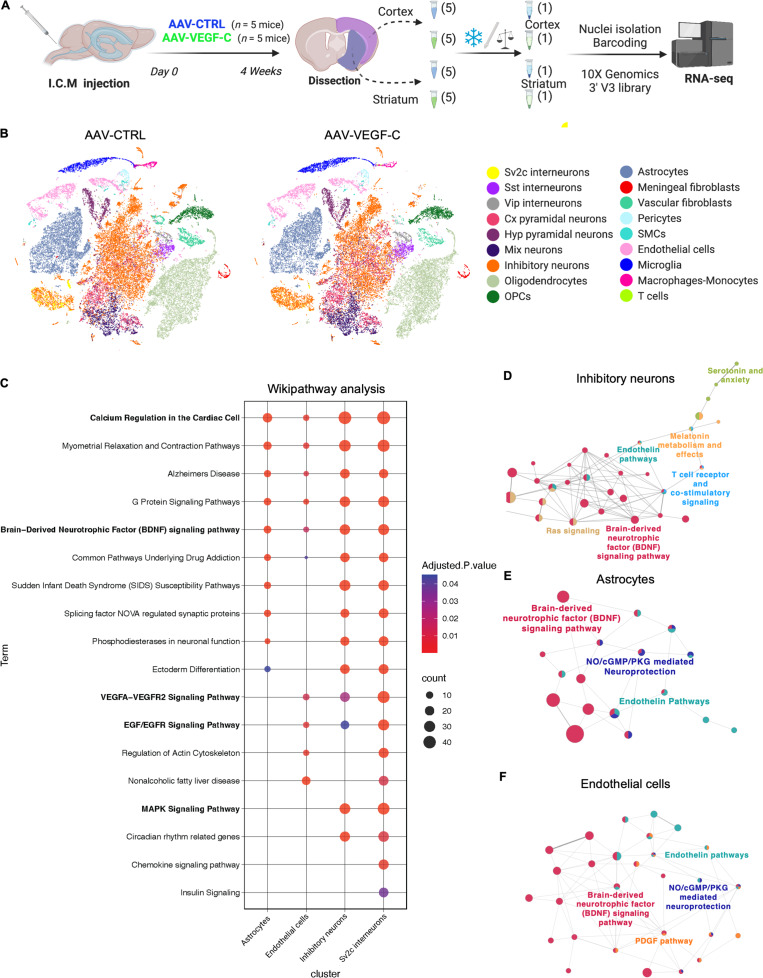
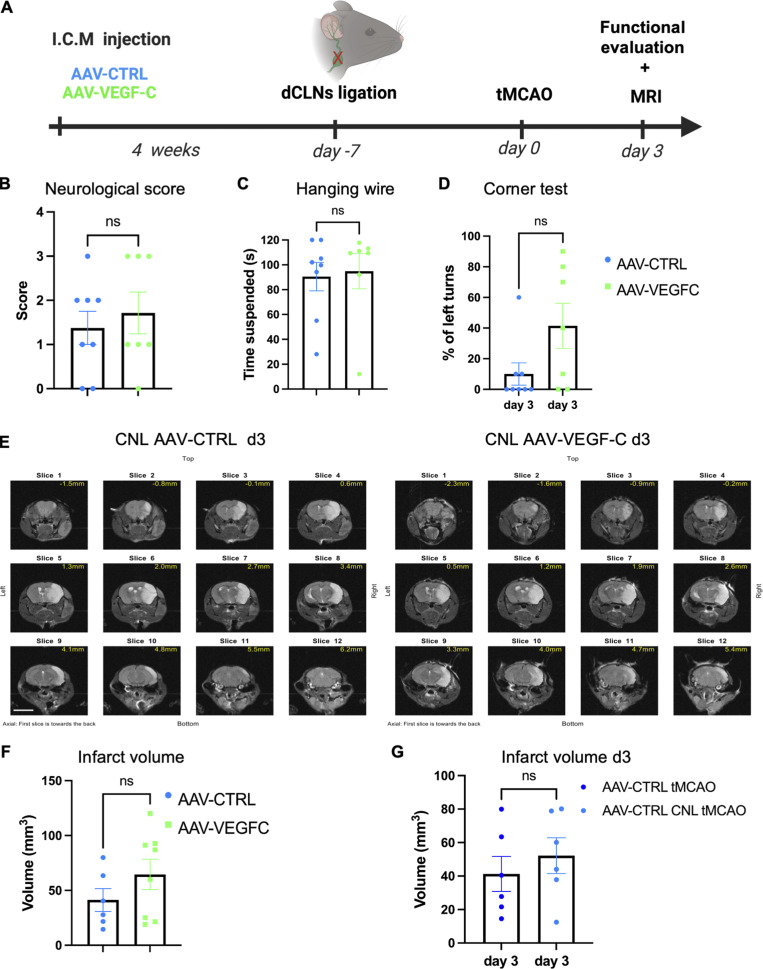
Meningeal lymphatic vessels (MLVs) promote tissue clearance and immune surveillance in the central nervous system (CNS). Vascular endothelial growth factor-C (VEGF-C) regulates MLV development and maintenance and has therapeutic potential for treating neurological disorders. Herein, we investigated the effects of VEGF-C overexpression on brain fluid drainage and ischemic stroke outcomes in mice. Intracerebrospinal administration of an adeno-associated virus expressing mouse full-length VEGF-C (AAV-mVEGF-C) increased CSF drainage to the deep cervical lymph nodes (dCLNs) by enhancing lymphatic growth and upregulated neuroprotective signaling pathways identified by single nuclei RNA sequencing of brain cells. In a mouse model of ischemic stroke, AAV-mVEGF-C pretreatment reduced stroke injury and ameliorated motor performances in the subacute stage, associated with mitigated microglia-mediated inflammation and increased BDNF signaling in brain cells. Neuroprotective effects of VEGF-C were lost upon cauterization of the dCLN afferent lymphatics and not mimicked by acute post-stroke VEGF-C injection. We conclude that VEGF-C prophylaxis promotes multiple vascular, immune, and neural responses that culminate in a protection against neurological damage in acute ischemic stroke.


Conflict of interest statement

Disclosures: H. Benveniste reported grants from National Center for Complementary and Integrative Health 1R01AT011419 outside the submitted work. F. Hyder reported being the founder and having an equity interest in of InnovaCyclics LLC, which is a biotechnology company creating next-gen MRI contrast agents that has licensed several IPs in biocompatible smart MRI probes comprised of transition metals that are biomarkers of H+/Na+ imbalances within tumor microenvironment, which are linked to proliferative and invasive phenotypes, and thereby, bypass the need for invasive biopsies. J.-L. Thomas reported grants from the French National Research Agency during the conduct of the study and personal fees from Springer-Nature outside the submitted work; in addition, J.-L. Thomas had a patent to Increasing lymphatics for brain tumor therapy with royalties paid. No other disclosures were reported.

Figures

None
Graphical abstract
Figure 1.
Figure 1.
AAV-mVEGF-C promotes drainage of CSF-injected Gd-DOTA into dCLNs. (A) Outline of the experimental procedure. 8-wk-old mice were analyzed by DCE-MRI after a prior ICM injection of either AAV-mVEGF-C or AAV-CTRL at 4 wk old (n = 10/group). (B) T1 mapping (1–1,700 ms range) was performed 1 h after intra-CSF Gd-DOTA administration. Each dot represents one mouse. Note the comparable voxel number between the two groups of mice (P = 0.65, Unpaired t test; P = 0.853, Mann–Whitney U test). (C) T1 mapping of extracranial Gd-DOTA efflux in the cribriform plate–olfactory epithelium area. Each dot represents one mouse (P = 0.30, Unpaired t test; P = 0.280, Mann–Whitney U test). (D) Plane sagittal view of the brain at the level of the dCLNs showing the T1 signal mapped to the node (white arrows) and an enlarged dCLN in the AAV-mVEGF-C mouse compared with CTRL. Note that the nodal volume and the intra-nodal content of Gd-DOTA were both increased in VEGF-C preconditioned mice compared with controls. (E) Measurement of dCLN volume through anatomical MRIs (AAV-mVEGF-C: 115.2 ± 12.1 voxels and AAV-CTRL: 56.5 ± 3.7 voxels, n = 20 CLNs/group, ****P < 0.0001, Mann–Whitney test). (F) Linear regression analysis of data in E (AAV-mVEGF-C: R2 = 0.89 P < 0.0001; AAV-control: R2 = 0.39 P < 0.004, linear regression model. (G) Postmortem analysis of dCLN weight (AAV-mVEGF-C [mg]: 0.19 ± 0.02 and AAV-CTRL [mg]: 0.11 ± 0.01, *P < 0.03, Unpaired t test, n = 9 dCLNs/group). (H and I) Quantification of ICM-injected fluorescent OVA-A647 in dCLNs and sCLNs at indicated timepoints 4 wk (H) and 2 wk (I) after AAV administration (n = 4–9/group, *P < 0.05, Mann–Whitney test). Data are represented as mean ± SEM. Scale bar: 1.5 mm (B–D). w, week.
Figure 2.
Figure 2.
VEGF-C effects in CSF-draining lymphatics. (A) VEGF-C protein expression measured by ELISA of the CSF (n = 4–6 mice/group, **P < 0.01, Mann–Whitney test). (B and C) MLV immunolabeling. (B) Confocal imaging of MLVs labeled with the indicated antibody in the confluence of sinuses (COS) and quantification of MLV surface and diameter (n = 5 mice/group, *P < 0.05, Mann–Whitney test). (C) LSFM imaging of mice treated as indicated for 4 wk, injected with OVA-A647 30 min before sacrifice, then stained with anti-LYVE-1 antibody (n = 3 mice/group). Posterior cavernous sinus (pCAV), ophthalmic emissary vein (ophev), olfactory emissary vein (olfev), rostral cavernous sinus (rCAV), and cribriform plate (CrPl). Insets show higher magnifications of OVA-A647 uptake into the rCAV (white). (D) dCLN immunolabeling of LYVE-1+ and KI67+ cells in mice treated for 4 wk with either AAV-mVEGF-C or -CTRL. Quantification of KI67+LYVE-1+/LYVE-1+ pixel area. Scale bar: 100 μm (left panel) and 20 μm (right panels). (E–G) Bulk RNA-seq analysis of FACS-sorted dural LECs. Volcano plot of DEGs between CTRL and VEGF-C–treated mice in mRNA extracted from dural LECs. Downregulated genes (blue) and upregulated genes (red). (F) HALLMARK GSEA dot-plot depicting the most upregulated and downregulated pathways in the AAV-mVEGF-C group compared to control. N = number of DEGs/pathway. NES, normalized enrichment score. (G) qPCR analysis of dura mater mRNAs. Expression of indicated genes in the AAV-mVEGF-C group compared with controls (n = 3 mice/group, **P < 0.01, ***P < 0.005 Mann–Whitney test). (H) Volcano plot of DEGs between CTRL- and VEGF-C–treated mice in mRNA from FACS-isolated dural CD45+ leukocytes. Downregulated genes (blue) and upregulated genes (red). (I) GSEA dot plot based on the GO biological process (GOBP) illustrating the most upregulated and downregulated pathways in the AAV-mVEGF-C group compared with control. Scale bar: 600 μm (A); 1,000 μm (C); 100 μm (D, left panel); 20 μm (D, right panels).
Figure S1.
Figure S1.
Effects of VEGF-C prophylaxis on the dural vasculature and CLN. (A and B) Confocal imaging (A and B) quantification of fibrinogen labeling in the dura mater superior sagittal sinus (SSS) and in the neighboring dura mater (boxed areas in A) (n = 5–6 mice/group). (C–F) LSFM imaging of LYVE-1+ cells in the meninges (C–E) and CLN (F). LYVE-1+ MLV located along the olfactory nerve (ON, white arrow) and the cavernous sinus at the level of the ophthalmic emissary vein (ophev) (C) and close to the cribriform plate (white arrow) (D). OB: olfactory bulb; OE: olfactory epithelium. Note the expansion of MLV coverage upon VEGF-C prophylaxis. (E) Pial and brain perivascular OVA-A647+/LYVE-1+ phagocytic cells (white arrow) were observed in the cerebellar region of VEGF-C–treated mice 30 min after ICM injection of OVA-A647. (F) LYVE1 expression in sCLNs and dCLNs (see also Fig. 1 D). (G) Quantification of confocal images of LYVE-1+ lymphatics in the lower region of the olfactory mucosa. *P < 0.05. (H and I) Representative images (H) and quantification (I) of LYVE-1+ immunostaining in the ear skin (n = 4 mice/group). (J) Quantification of KI67+ immune cells among leukocytes (CD45+), B lymphocytes (B220+), and T lymphocytes (CD3e+) in the dCLNs (n = 6 mice/group). Scale bar: 600 μm (A); 1,000 μm (C–F); 50 μm (H).
Figure S2.
Figure S2.
Isolation and bulk RNA-seq analysis of dural LECs and immune cells. (A) Flow cytometry gating strategy for isolating LYVE-1+/PDPN+/CD31+/CD45 LECs from the dorsal dura mater of AAV-CTRL– and AAV-VEGF-C–treated mice (n = 30 mice/group; two groups; three independent experiments). (B and C) Percentage of dural LECs (B) and blood ECs (C) in AAV-VEGF-C and -CTRL mice. (D) Principal component analysis segregation of LEC transcripts from AAV-CTRL and -VEGF-C mice. (E) HALLMARK gene set of the uppermost upregulated signaling pathway by VEGF-C. (F) NABA set of the 18 most expressed genes in the secreted factor signaling pathway, the uppermost upregulated up by VEGF-C. Note expression of osteogenic/osteoclastic factors and chemokine CCL28 (underlined).
Figure S3.
Figure S3.
ICM AAV delivery transduced cells and brain cell responses. (A) Quantification of VEGF-C and p-VEGFR-3 levels in brain sample lysates using ELISA. ***P < 0.001; **P < 0.005; *P < 0.05 n = 4 mice/group at 2 wk n = 8–11/group at 4 wk. (B–E) Phenotype of brain cells transduced after ICM injection of AAV9-GFP. (B) Tile scans of GFP expression on sagittal (left panel) and coronal (right panel) sections of the adult brain. Note the intracerebral GFP expression at the level of the olfactory bulb (OB), accessory olfactory bulb (AOB), frontal cortex (FCx), retrosplenial cortex (RSCx), hippocampus (Hi), and pretectum (PrT). IVth V: fourth ventricle. (C and D) GFP is detected in SMA+ vascular smooth muscle cells (C), but not in PDLX+ endothelial cells and CD206+ perivascular macrophages (D). Right panel in C and D: Representative intensity profile plots for GFP (green), a-SMA (gray), PDLX (red), and CD206 (purple), taken from a cross section (white arrow) of the images shown in C and D. Note the co-localization or exclusion of GFP expression with a-SMA and PDLX/CD206 markers, respectively. (E) Neural GFP expression is detected in subsets of NeuN+ neurons, Olig2+ oligodendroglial cells, and very few GFAP+ astrocytes (E). Scale bar: 500 μm (B); B–D: 50 μm (C–E). (F) Representative images of subventricular zone (SVZ) Nestin+ neural stem/progenitor cells, KI67+ dividing cells and DCX+ neuroblasts. LV: lateral ventricle; ST: striatum. (G) Quantification of Nestin+ cells (% SVZ area: AAV-VEGF-C: 6.2 ± 0.9; AAV-control: 4.5 ± 1.1, P = 0.4), KI67+ cells (number of cells/surface unit: AAV-VEGF-C: 33 ± 4; AAV-control: 16 ± 7, P = 0.07) and DCX+ neuroblasts (% SVZ area: AAV-VEGF-C: 4.6 ± 0.5; AAV-control: 1.7 ± 0.3 **P = 0.004) at 7 days after AAV administration. Data shown as mean ± SEM, n = 5–6 mice/group. Scale bar: 100 μm (F).
Figure 3.
Figure 3.
snRNA-seq reveals VEGF-C induced pathways in forebrain cells. (A) Overview of the experimental procedure. (B) TSNE plots showing cell-type-specific cluster annotation. (C) WikiPathways analysis of signaling pathway alterations induced by VEGF-C among brain cell clusters. Oligodendrocytes, astrocytes, endothelial cells, cortical pyramidal (cx pyram) neurons, inhibitory neurons, Sv2c interneurons, and mix neurons show >180 DEGs (Padj < 0.05 and abs(log2FC) > 0.58), with pathways of at least 20 genes and adjusted P values <0.05 in at least one cluster. (D–F) Functionally organized network from ClueGO analysis visualized with Cytoscape in inhibitory neurons (D), astrocytes (E), and endothelial cells (F). Only main pathways are represented. Main terms are represented with color. Dot size represents the number of DEGs in common between pathways. Vip, vasoactive intestinal polypeptide; Hyp, hypothalamus; OPC, oligodendrocyte precursor cell.
Figure S4.
Figure S4.
Single nucleus analysis of brain cell transcriptome in adult AAV-CTRL and AAV-VEGF-C mice. (A) Subclustering of forebrain neuronal cells, endothelial cells, vascular mural cells, and immune cells. Top panel: tSNE representation of the neurons after sub-clustering and isolated mapping. tSNE representation of marker gene expression in the neuronal cells subclusters. Middle panel: tSNE representation of vascular mural cells and endothelial cells clusters and distribution of relevant marker genes in tSNE representations. Endothelial cells (Cldn5+), smooth muscle cells (SMCs) (Myh11+); vascular fibroblast (Col1a1+); Pericytes (Pdgfrβ+ Myh11). Lower panel: tSNE visualization of subclusters of immune cells. Scaled distribution of marker genes of microglia (Tmem119+), monocytes-macrophages (Msr1+, CD68+), and T cells (Cd8b1+). (B) Violin plots representing transcript number in each cluster, between regions (cortex versus striatum, top left). Between conditions (AAV-VEGF-C versus AAV-CTRL, top right) (n = 5 mice/group). Representative histogram of cell numbers in each cluster are shown in the bottom panel. (C and D) Quantification of the levels of BDNF (C) and NGF (D) detected by ELISA in brain sample lysates from 2- to 4-wk-treated mice with AAV-VEGF-C or -CTRL. *P < 0.05, n = 4 mice/group at 2 wk, n = 8–11/group at 4 wk. One-way ANOVA and Tukey’s multiple comparison test. Data are represented as mean ± SEM.
Figure S5.
Figure S5.
Analysis of Vegfc and VEGF-C receptor gene expression. (A) sn-RNAseq analysis. Dot plot representation of transcript expression among the different clusters using Log normalized and zero centered expression in each cluster (AAV-VEGF-C, AAV-CTRL). (B–K) Immunophenotyping of Vegfr3-expressing cells in the brain of Vegfr3::YFP reporter mice. (B) Pial and brain penetrating blood vessels (arrowheads) as well as subsets of neural cells express YFP in the cortex. (C) Colocalization of YFP and PDLX/CD31 in pial vessels (white arrowhead). (D) YFP labeling along large veins expressing Von Willebrand factor (vWF) and exiting the cortex. (E and F) Most small cerebral vessels lack YFP expression (E), although YFP can be detected at branching points of VEGFR2+ capillaries (F). (G–K) Other types of brain parenchymal cells express YFP, including astrocytes and their end-feet (GFAP+; white arrowheads in G and H) and subsets of neurons (NeuN+; white arrowheads in I). Microglial cells do not express YFP (J), in contrast with VEGFR-2+ choroid plexus blood vessels (K).
Figure 4.
Figure 4.
MLV response to stroke without or with AAV-VEGF-C prophylaxis. (A–D) Characterization of tMCAO mice. (A) Images of LYVE-1+ MLVs at the COS in sham mice and mice at 1 d-, 3 d-, and 7 d-pso. (B and C) Quantification of the surface (B) and diameter (C) of MLVs at the different time points after stroke compared to the sham group (n = 4–8 mice/group, **P < 0.005, *P < 0.05 Mann-Whitney test). (D) Quantification by qPCR of Vegfc expression on the right hemisphere (forebrain) (n = 3–5 mice/group, *P < 0.05 Mann–Whitney test). (E–G) AAV-VEGF-C– or AAV-CTRL–treated tMCAO mice. (E) Confocal imaging of MLVs labeled with the indicated antibody in the COS. (F and G) Quantification of LYVE-1+ area (G) and diameter (H) at 7 d-pso (n = 6–8 mice/group, *P < 0.05, **P < 0.005; Mann–Whitney). Scale bar: 170 μm (A and E).
Figure 5.
Figure 5.
AAV-mVEGF-C promotes functional recovery in response to stroke. (A) Overview of the experimental procedure: mice received an ICM injection of AAV-VEGF-C or AAV-CTRL and underwent tMCAO 4 wk afterward. Animals were evaluated using MRI and behavioral tests at 3 d- and 7 d-pso. (B–D) Functional analysis of tMCAO mice injected with AAV-VEGF-C and AAV-CTRL. Quantification was performed at the indicated time points. Quantifications of the neurological score (B) and corner test evaluation (C) at 3 d- and 7 d-pso. No difference (% percentage) of left turns (impaired side) between AAV-VEGF-C (day 3: 36 ± 8; day 7: 37 ± 8) and AAV-CTRL (day 3: 19 ± 8; day 7: 17 ± 9. n = 10–13 mice/group; P = 0.21). Hanging wire test (D) (n = 10–13 mice/group; *P < 0.05; two-way ANOVA followed by Bonferroni’s multiple comparisons). (E–G) MRI scans. (E) Representative images of MRI anatomical T2 weighted scans showing the infarct lesion induced by tMCAO in AAV-CTRL and AAV-mVEGF-C mice. (F) Quantification of the lesion volume at 3 d- and 7 d-pso. (*P < 0.05; Wilcoxon test). (G) Volumetric quantification of the ipsilateral and contralateral cerebral hemispheres. (n = 6–7 animals/group; Wilcoxon test). MRI scale bar: 400 µm.
Figure 6.
Figure 6.
Post-stroke outcomes after cauterization of dCLN afferent lymphatics. (A) Mice received an ICM injection of AAV-VEGF-C or AAV-CTRL and 3 wk after underwent CLN ligation; 1 wk later mice were subject to a tMCAO. Animals were evaluated using MRI and behavioral tests at day 3 after stroke. (B–D) Functional analysis of tMCAO mice injected with AAV-VEGF-C and AAV-CTRL after CLN ligation. Quantification of the neurological score (B) and hanging wire test (C) and corner test (D) at 3 d-pso (n = 7–8 mice/group, ns = no significant difference Mann-Whitney test). (E) Representative images of MRI anatomical T2 weighted scans showing the infarct lesion induced by tMCAO in CNL AAV-CTRL and CNL AAV-VEGF-C mice. (F) MRI quantification of the infarct volume (n = 6–8 animals/group; Mann-Whitney test). (G) Comparison between AAV-CTRL mice without and with CLN ligation. Lesion volume measured using MRI at 3 d-pso. Two independent experiments, n = 6 mice/group. Scale bar: 500 µm.
Figure 7.
Figure 7.
VEGF-C prophylaxis prevents microglia expansion after ischemic stroke. (A–D) Representative images and quantification of GFAP+ astrocytes (A), NeuN+ neurons (B), PDLX+ blood vessels (C), and Iba1+ immune cells (D) in the ipsilateral (Ipsi) and contralateral (Contra) hemispheres of AAV-CTRL and AAV-VEGF-C mice at 7 d-pso. **P < 0.01, ***P < 0.001, ****P < 0.0001; one-way ANOVA and Bonferroni’s post hoc test. Data are represented as mean ± SEM, n = 5–7 mice in each experimental group. (E–G) Bulk transcriptomic analysis of CD11b+ cells harvested from the brains of mice treated with AAV-mVEGF-C or AAV-CTRL at 7 d-pso or in healthy adults. (E) Volcano plot of DEGs between VEGF-C– and CTRL-treated adult mice. (F) Volcano plot of DEGs between VEGF-C– and CTRL-treated mice at day 7 after stroke. (G) HALLMARK GSEA dot plot showing the most upregulated and downregulated pathways in the AAV-mVEGF-C group compared to AAV-CTRL at 7 d-pso. Scale bar: 35 µm (A–D).
Figure 8.
Figure 8.
VEGF-C prophylaxis mitigates microglia activation and stimulates neurotrophin signaling. (A–D) qPCR analysis of forebrain homogenates (ipsilateral hemisphere) in AAV-VEGF-C and AAV-CTRL mice at 3 d- and 7 d-pso, measuring mRNA expression of the indicated genes. **P < 0.001; *P < 0.05. Two-way ANOVA and Sidak’s multiple comparison test. Data are represented as mean ± SEM, n = 3–5 mice in each experimental group. (E) Western blot and quantification of CXCL9 protein levels in brain protein extracts from AAV-CTRL– and AAV-VEGF-C–injected mice. *P < 0.05; n = 4 animals/group; Mann-Whitney test. (F) qPCR analysis of forebrain homogenates described in A–D for measuring mRNA expression of Bdnf and Ngf. *P < 0.05, **P < 0.01. (G) ELISA on brain tissue extracts to measure the expression of BDNF and NGF in tMCAO mouse brains at 3 d-pso (*P < 0.05, n = 4–5 animals/group; Mann–Whitney test). (H) Immunoprecipitation of TrkB, followed by western blot detection of phosphorylated tyrosine, and quantification of pTrK phosphorylation. Each lane corresponds to one brain hemisphere (*P <0.05; n = 4–5 animals/group; Mann-Whitney test). Source data are available for this figure: SourceData F8.
Figure 9.
Figure 9.
Single-dose VEGF-C treatment does not improve tMCAO outcomes. (A) VEGFR-3 and VEGFR-2 immunoprecipitation (IP) of brain protein extracts followed by western blot detection of phosphorylated tyrosine (pTYR) from mice injected with saline or VEGF-C protein (1 μg) at 1 and 24 h after administration (n = 3/group). (B and C) Quantification of tyrosine phosphorylation levels of VEGFR-3 (B) and VEGFR-2 (C) normalized to immunoprecipitated VEGFR-3 and VEGFR-2 proteins, respectively. *P < 0.05, **P < 0.01. (D) VEGFR-3 and VEGFR-2 IP of brain protein extracts followed by western blot detection of phosphorylated tyrosine from mice injected with either saline or VEGF-C156S protein (1 μg) at 1 and 24 h after administration (n = 5/group). (E and F) Quantification of tyrosine phosphorylation levels of VEGFR-3 (E) and VEGFR-2 (F) normalized to immunoprecipitated VEGFR-3 and VEGFR-2 proteins, respectively. *P < 0.05, **P < 0.01. (G) Experimental setting: mice underwent tMCAO and, after reperfusion, received an ICM injection of either recombinant VEGF-C (VEGF-C156S) or vehicle control (0.25% BSA). (H) Anti-LYVE-1–immunolabeled MLVs in the COS at 7 d-pso, and quantification of MLV coverage and diameter (n = 5 mice/group; Unpaired t test). (I) Neuroscore scale and corner test quantifications at 3 d- and 7 d-pso (n = 7, 5 mice/group; one-way ANOVA test). (J) Representative MRI anatomical T2 weighted scans showing the infarct lesion. Quantification of the lesion volume at 3 d- and 7 d-pso (n = 7–5 mice/group; Kruskal–Wallis test). Scale bar: 170 µm (H). MRI scale bar: 400 µm. Source data are available for this figure: SourceData F9.

Comment in

References

    1. Ahn, J.H., Cho H., Kim J.-H., Kim S.H., Ham J.-S., Park I., Suh S.H., Hong S.P., Song J.H., Hong Y.K., et al. . 2019. Meningeal lymphatic vessels at the skull base drain cerebrospinal fluid. Nature. 572:62–66. 10.1038/s41586-019-1419-5 - DOI - PubMed
    1. Anthony, S., Cabantan D., Monsour M., and Borlongan C.V.. 2022. Neuroinflammation, stem cells, and stroke. Stroke. 53:1460–1472. 10.1161/STROKEAHA.121.036948 - DOI - PMC - PubMed
    1. Antila, S., Karaman S., Nurmi H., Airavaara M., Voutilainen M.H., Mathivet T., Chilov D., Li Z., Koppinen T., Park J.H., et al. . 2017. Development and plasticity of meningeal lymphatic vessels. J. Exp. Med. 214:3645–3667. 10.1084/jem.20170391 - DOI - PMC - PubMed
    1. Aspelund, A., Antila S., Proulx S.T., Karlsen T.V., Karaman S., Detmar M., Wiig H., and Alitalo K.. 2015. A dural lymphatic vascular system that drains brain interstitial fluid and macromolecules. J. Exp. Med. 212:991–999. 10.1084/jem.20142290 - DOI - PMC - PubMed
    1. Aspelund, A., Robciuc M.R., Karaman S., Makinen T., and Alitalo K.. 2016. Lymphatic system in cardiovascular medicine. Circ. Res. 118:515–530. 10.1161/CIRCRESAHA.115.306544 - DOI - PubMed

Substances