. 2024 Sep 3;147(9):3247-3260.
doi: 10.1093/brain/awae066.

Distinctive antibody responses to Mycobacterium tuberculosis in pulmonary and brain infection

Affiliations

Distinctive antibody responses to Mycobacterium tuberculosis in pulmonary and brain infection

Marianna Spatola et al. Brain. .

Abstract

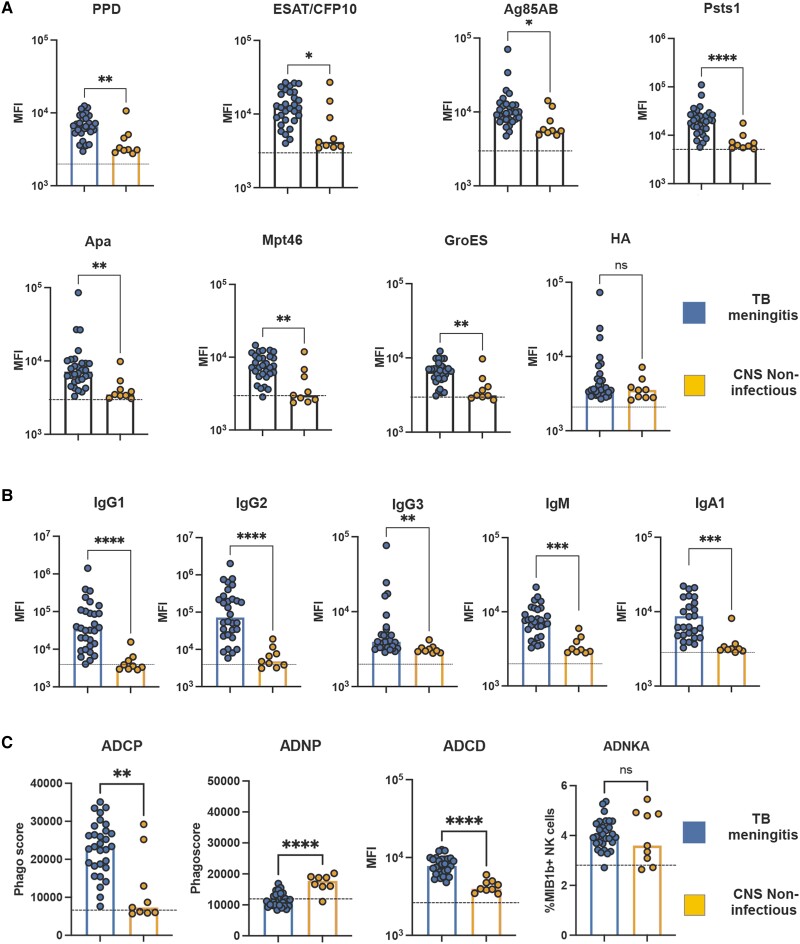
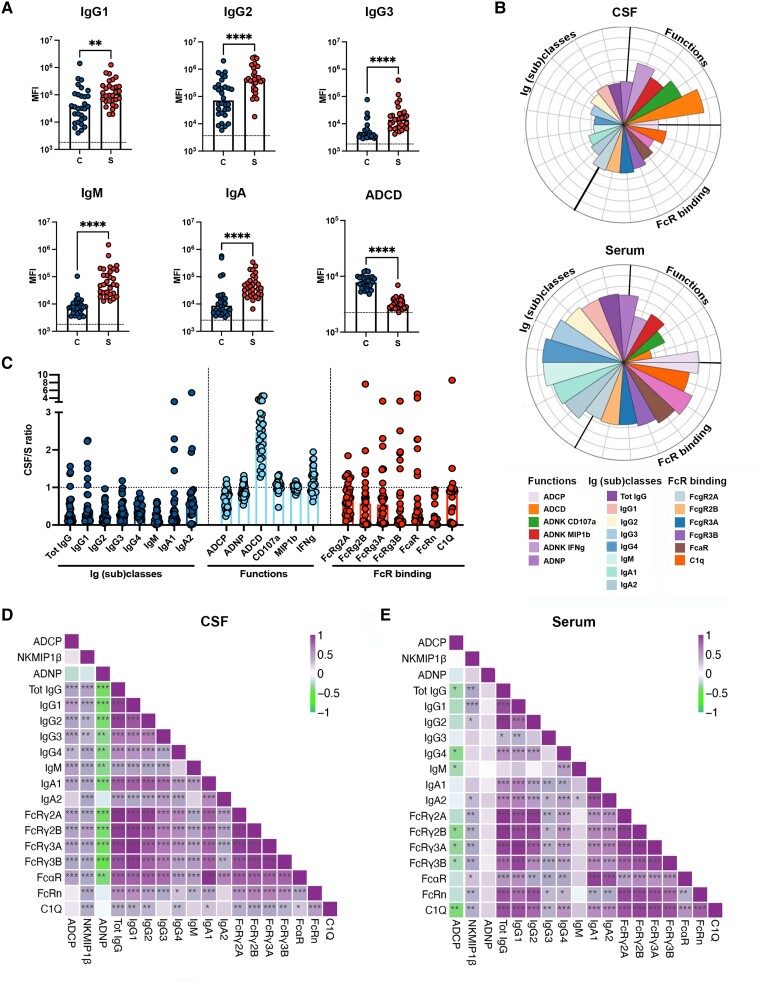
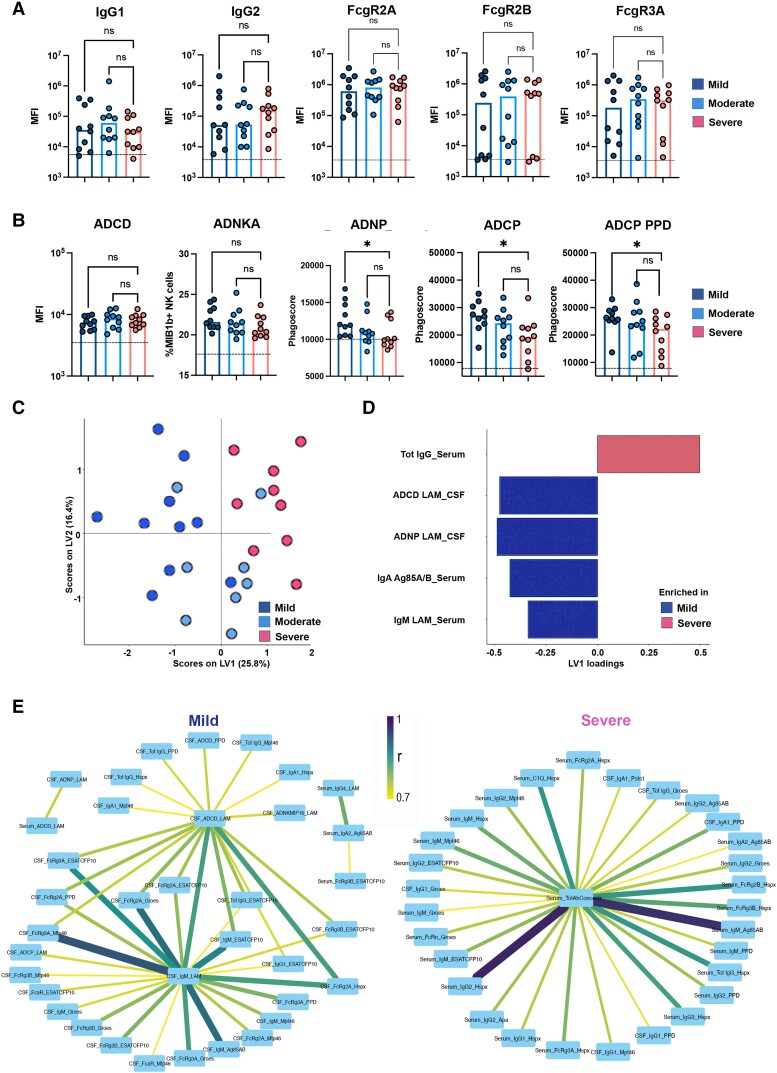
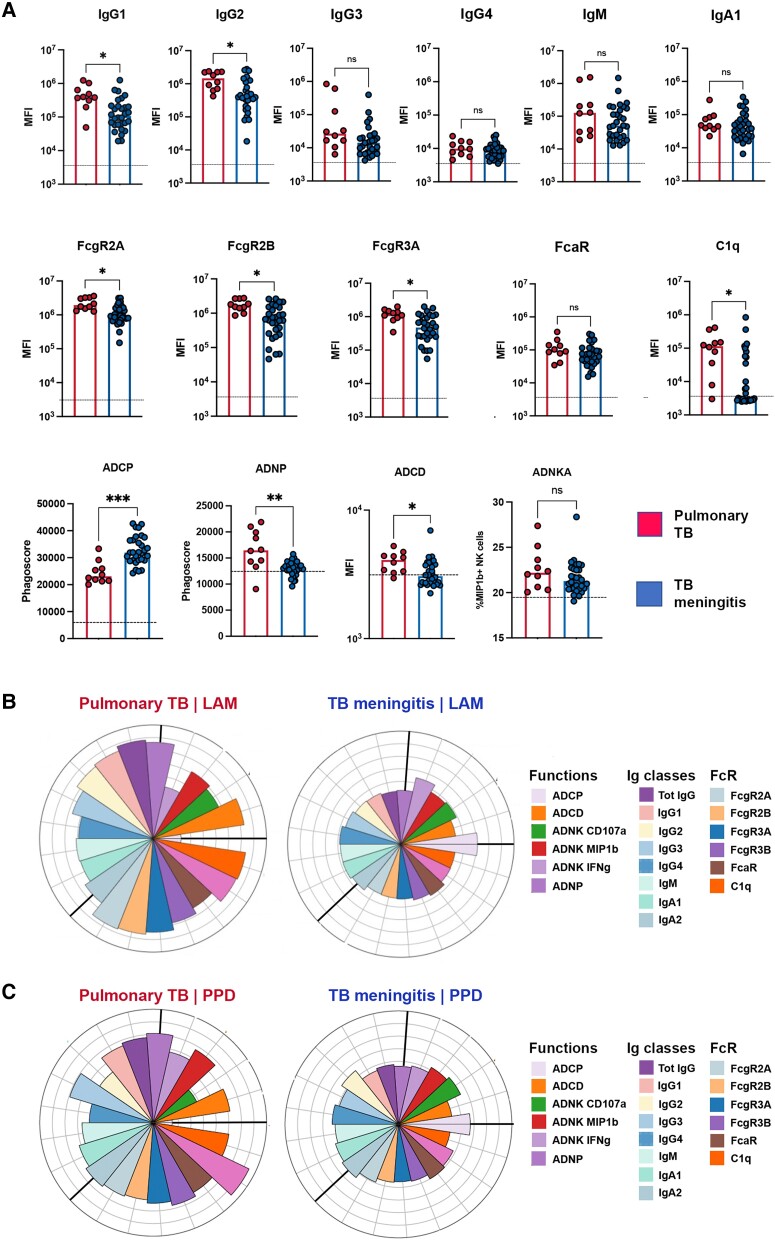
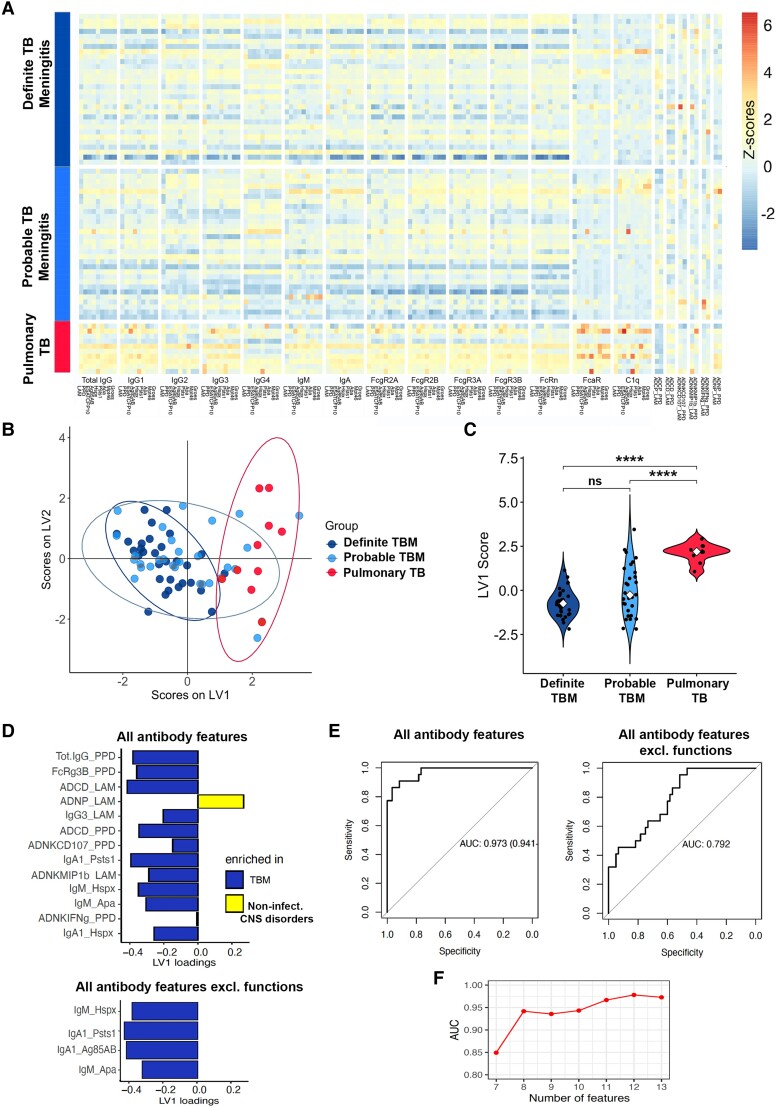
Mycobacterium tuberculosis, the causative agent of tuberculosis (TB), remains a global health burden. While M. tuberculosis is primarily a respiratory pathogen, it can spread to other organs, including the brain and meninges, causing TB meningitis (TBM). However, little is known about the immunological mechanisms that lead to differential disease across organs. Attention has focused on differences in T cell responses in the control of M. tuberculosis in the lungs, but emerging data point to a role for antibodies, as both biomarkers of disease control and as antimicrobial molecules. Given an increasing appreciation for compartmentalized antibody responses across the blood-brain barrier, here we characterized the antibody profiles across the blood and brain compartments in TBM and determined whether M. tuberculosis-specific humoral immune responses differed between M. tuberculosis infection of the lung (pulmonary TB) and TBM. Using a high throughput systems serology approach, we deeply profiled the antibody responses against 10 different M. tuberculosis antigens, including lipoarabinomannan (LAM) and purified protein derivative (PPD), in HIV-negative adults with pulmonary TB (n = 10) versus TBM (n = 60). Antibody studies included analysis of immunoglobulin isotypes (IgG, IgM, IgA) and subclass levels (IgG1-4) and the capacity of M. tuberculosis-specific antibodies to bind to Fc receptors or C1q and to activate innate immune effector functions (complement and natural killer cell activation; monocyte or neutrophil phagocytosis). Machine learning methods were applied to characterize serum and CSF responses in TBM, identify prognostic factors associated with disease severity, and define the key antibody features that distinguish TBM from pulmonary TB. In individuals with TBM, we identified CSF-specific antibody profiles that marked a unique and compartmentalized humoral response against M. tuberculosis, characterized by an enrichment of M. tuberculosis-specific antibodies able to robustly activate complement and drive phagocytosis by monocytes and neutrophils, all of which were associated with milder TBM severity at presentation. Moreover, individuals with TBM exhibited M. tuberculosis-specific antibodies in the serum with an increased capacity to activate phagocytosis by monocytes, compared with individuals with pulmonary TB, despite having lower IgG titres and Fcγ receptor-binding capacity. Collectively, these data point to functionally divergent humoral responses depending on the site of infection (i.e. lungs versus brain) and demonstrate a highly compartmentalized M. tuberculosis-specific antibody response within the CSF in TBM. Moreover, our results suggest that phagocytosis- and complement-mediating antibodies may promote attenuated neuropathology and milder TBM disease.

Keywords: Fc receptors; TB meningitis; antibody-mediated complement deposition; antibody-mediated phagocytosis; neuroinflammation.


Conflict of interest statement

G.A. is an employee of Moderna Therapeutics and holds equity in Leyden Labs and SeromYx Systems. The other authors report no competing interests.

Figures

Figure 1
Figure 1
High levels of functional and Fc-receptor binding Mycobacterium tuberculosis-specific antibodies in CSF from individuals with tuberculosis meningitis. (A) Scatter-dot plot showing high levels of IgG1 antibodies against Mtb antigens [purified protein derivative (PPD), ESAT/CFP10, Ag85 A/B, Psts1, Apa, Mpt46 and GroES] in CSF from individuals with tuberculosis (TB) meningitis (n = 30) compared with non-infectious CNS disorders (n = 10). These differences are not observed in Flu-HA specific antibodies. (B) Scatter-dot plot showing lipoarabinomannan (LAM)-specific Ig classes (IgG, IgM, IgA), subclasses (IgG1–4) in TB meningitis (n = 30) compared with non-infectious CNS disorders (n = 10). LAM-specific antibodies from TB meningitis show higher IgG1, IgG2, IgM and IgA levels, compared with non-infectious CNS disorders. Each dot represents an individual. Bars represent median, dotted line indicates PBS level. Mann–Whitney statistics; **P < 0.01, ***P < 0.001, ****P < 0.0001. ADCD = antibody-dependent complement deposition; ADCP = antibody-dependent cellular phagocytosis; ADNKA = antibody-dependent natural killer cell activation; ADNP = antibody-dependent neutrophil phagocytosis; MFI = median fluorescence intensity.
Figure 2
Figure 2
Compartmentalization and coordination of the humoral response to Mycobacterium tuberculosis in serum and CSF from individuals with tuberculosis meningitis. (A) Scatter-dot plot showing lipoarabinomannan (LAM)-specific antibody classes (IgG, IgM, IgA), subclasses (IgG1, IgG2, IgG3) and capacity to activate complement (ADCD) in the CSF (C = blue) and serum (S = red) from tuberculosis (TB) meningitis (n = 30). Each dot represents an individual. Bars represent median, dotted line indicates PBS level. Mann–Whitney statistics; **P < 0.01, ****P < 0.0001. (B) Flower plots showing LAM-specific IgG subclasses (1–4), IgM, IgA, Fc-receptors (FcRs: FcγR2A, FcγR2B, FcγR3A, FcγR3B and FcαR) and C1q binding, and antibody-mediated functions [antibody-dependent complement deposition (ADCD), antibody-dependent neutrophil phagocytosis (ADNP), THP-1 monocyte phagocytosis (antibody-dependent cellular phagocytosis, ADCP) and antibody-dependent natural killer cell activation (ADNK CD107a, ADNK MIP1β, ADNK IFNγ)] in serum and CSF of TB meningitis (n = 30). Each flower plot summarizes the data from the respective compartment and the length of each petal represents the average of the z-scored value for the indicated feature. (C) Scatter-dot plot showing CSF:serum ratios of LAM-specific IgG subclasses (1–4), IgM, IgA, binding to FcRs (FcγR2A, FcγR2B, FcγR3A, FcγR3B, FcαR) and C1q, and antibody-mediated functions [ADCD, ADNP, THP-1 monocyte phagocytosis (ADCP) and ADNK (ADNK CD107, IFNγ, MIP1β)], showing an enrichment in highly functional (and in particular ADCD-mediating) antibodies in CSF of TB meningitis (n = 30). Each dot represents an individual. Bars represent median. (D and E) Correlation matrix between LAM-specific antibody features [Ig classes (IgG, IgM, IgA), Ig subclasses (IgG1, IgG2, IgG3, IgG4, IgA), functions (ADCD, ADCP, ADNP, NK MIP1β) and binding to C1q and FcRs (FcγR2A, FcγR2B, FcγR3A, FcγR3B, FcαR)] showing higher humoral response coordination in CSF compared with serum of TB meningitis (n = 30). Correlation strength is proportional to colour intensity [ρ: from −1 = negative correlation (green) to 1 = positive correlation (purple)]. (Spearman’s correlation, Benjamini–Hochberg correction for multiple comparisons; *P < 0.05, **P < 0.01, ***P < 0.001).
Figure 3
Figure 3
Mtb-antibody responses are associated with disease severity of tuberculosis meningitis. (A and B) Scatter-dot plot showing lipoarabinomannan (LAM)-specific IgG1 and IgG2, binding to FcγR2A, FcγR2B, FcγR3A, antibody-mediated functions [THP-1 monocyte phagocytosis (antibody-dependent cellular phagocytosis, ADCP), antibody-dependent neutrophil phagocytosis (ADNP), antibody-dependent complement deposition (ADCD) and antibody-dependent natural killer cell activation (ADNKA)] and purified protein derivative (PPD)-specific ADCP in tuberculosis meningitis (TBM; n = 30) according to severity (mild = dark blue; moderate = light blue; severe = pink). Milder TBM disease showed higher levels of antibodies mediating ADCP (LAM- and PPD-specific) and ADNP (LAM-specific), despite having similar levels of IgG and FcγR binding. Each dot represents an individual. Bars represent median, dotted line indicates PBS level. Kruskal–Wallis statistics; **P < 0.01, ***P < 0.001, ****P < 0.0001. (C) Orthogonalized partial least squares regression (OPLSR) on least absolute shrinkage selection operator (LASSO)-selected features showing separation between antibody signatures depending on severity of TBM (mild = dark blue; moderate = light blue; severe = pink). Dots represent individual samples (n = 30) across all tested Mtb antigens (LAM, PPD, Ag85 A/B, ESAT/CFP10, PstS1, Hspx, Apa, Mtp46 and GroES). The performance of the algorithm was evaluated with R2 and Q2 metrics. R2 = 0.69 indicating a high predictive accuracy and Q2 = 0.55 indicating a good performance on test data in the cross-validation setting. (D) Bar graph shows LASSO-selected antibody features across Mtb antigens (LAM, PPD, Ag85 A/B, ESAT/CFP10, PstS1, Hspx, Apa, Mtp46, GroES) in TBM individuals (n = 30) according to severity of the disease (mild = blue; severe = pink), ranked by their variable importance in projection (VIP). Bars represent antibody features enriched in mild (blue) versus severe (pink). (E) Correlation network between LASSO-selected antibody features enriched in severe (Total IgG_Serum) or mild disease (ADCD_LAM_CSF; ADNP_LAM_CSF; IgA_Ag85_A/B Serum; IgM_LAM_Serum) and the remainder of features, including Ig classes and subclasses (Total IgG, IgG1, IgG2, IgG3, IgG4, IgM, IgA), Fc receptor (FcγR2A, FcγR2B, FcγR3A, FcγR3B, FcαR) and C1q binding, and functions (ADCD, ADCP, ADNP, NK CD107, NK IFNγ, NK MIP1β). Edge colour and size are proportional to the strength of correlation as shown in the colour bar. Only correlations with Spearman’s ρ > 0.7 and P < 0.01 are shown. Statistics: Z-scores, Spearman’s correlation, Benjamini–Hochberg correction for multiple comparisons.
Figure 4
Figure 4
Functional differences of lipoarabinomannan (LAM)-specific serum antibodies between tuberculosis (TB) meningitis and pulmonary TB. (A) Scatter-dot plot showing LAM-specific Ig classes (IgG, IgM, IgA), subclasses (IgG1-4), Fc receptor (FcR; FcγR2A, FcγR2B, FcγR3A, FcγR3B, FcαR) and C1q binding, and antibody-mediated functions [complement deposition (antibody-dependent complement deposition, ADCD), neutrophil phagocytosis (antibody-dependent neutrophil phagocytosis, ADNP), THP-1 monocyte phagocytosis (antibody-dependent cell phagocytosis, ADCP) and natural killer (NK) cell activation (antibody-dependent NK activation, ADNKA)] in the serum of TB meningitis (blue, n = 30) compared pulmonary TB (red, n = 10). Compared with pulmonary TB (red), LAM-specific antibodies from TB meningitis (blue) show overall lower titres and FcR binding capacity but mediate higher ADCP. Each dot represents an individual. Bars represent median, dotted line indicates PBS level. Mann–Whitney statistics; **P < 0.01, ***P < 0.001, ****P < 0.0001. MFI = median fluorescence intensity. (B and C) Flower plots showing LAM- and purified protein derivative (PPD)-specific Ig classes (IgG, IgM, IgA), subclasses (IgG1–4), FcR (FcγR2A, FcγR2B, FcγR3A, FcγR3B, FcαR) and C1q binding, and antibody-mediated functions [ADCD, ADNP, THP-1 monocyte phagocytosis (ADCP) and ADNK (ADNK CD107a, ADNK MIP1β, ADNK IFNγ)] in serum from TB meningitis (n = 30) and pulmonary TB (n = 10). Each flower plot summarizes the data from the respective group and the length of each petal represents the average of the z-scored value for the indicated feature.
Figure 5
Figure 5
Similar serum antibody signatures between definite and probable tuberculosis meningitis (TBM) and performance of a potential diagnostic test using CSF antibody signatures that distinguish TBM from non-infectious CNS disorders. (A) Heatmap of Ig classes (IgG, IgM, IgA), binding to Fc receptors (FcRs; FcγR2A, FcγR2B, FcγR3A, FcγR3B, FcαR) and C1q, and antibody-mediated functions [complement deposition (antibody-dependent complement deposition, ADCD), neutrophil phagocytosis (antibody-dependent neutrophil phagocytosis, ADNP), THP-1 monocyte phagocytosis (antibody-dependent cell phagocytosis, ADCP) and natural killer (NK) cell activation (antibody-dependent NK activation, ADNKA; ADNK CD107, IFNg, MIP1b)], across all tested Mtb antigens [lipoarabinomannan (LAM), purified protein derivative (PPD), Ag85 A/B, Hspx, ESAT/CFP10, Psts1, Apa, Mtp46 and GroES] in definite (n = 30) and probable (n = 25) TBM, compared with pulmonary TB (n = 10). Z-scored values, colour-coded from dark blue (negative z-scores) to yellow and red (positive z-scores). (B) Partial least square discriminant analysis (PLSDA) on least absolute shrinkage selection operator (LASSO)-selected features showing separation between antibody signatures in pulmonary TB (red, n = 10) and probable TBM (light blue, n = 25). The graph has been overlapped with the PLSDA model showing separation between pulmonary TB (red) and definite TBM (dark blue, n = 30), to show the large overlap between probable and definite TBM individuals. Dots represent individual samples across all tested Mtb antigens (LAM, PPD, Ag85 A/B, ESAT/CFP10, Psts1, Hspx, Apa, Mtp46 and GroES). (C) Violin plots show latent variable 1 (LV1) scores from PLSDA model across pulmonary TB (red, n = 10) and definite (dark blue, n = 30) or probable (light blue, n = 25) TBM. Kruskal–Wallis statistics; ****P < 0.0001, ns = not significant. (D) Bar graph shows LASSO-selected antibody features across Mtb antigens (LAM, PPD, Ag85 A/B, ESAT/CFP10, PstS1, Hspx, Apa, Mtp46 and GroES) in TBM individuals (definite and probable) compared with non-infectious CNS disorders, ranked by their Variable Importance in Projection (VIP) scores. Bars represent antibody features enriched in TBM (blue) versus non-infectious CNS disorders (yellow) when considering all antibody features (top, 13 features selected) or all features except functions (bottom, four features selected). (E) Receiver operating characteristic (ROC) curves illustrating the performance, in terms of area under the curve (AUC) for sensitivity and specificity, of a potential diagnostic test discriminating TBM (definite and probable) from non-infectious CNS disorders, using the LASSO-selected features from D as biomarkers. The ROC curve using the 13 LASSO-selected features (from the ‘all antibody features’ model) shows excellent performance (AUC 0.97, left). The ROC curve using the four LASSO-selected features (from the ‘all antibody features except functions’ model) shows good performance (AUC 0.79, right). (F) AUC values of ROC curves from the ‘all antibody features’ model in D using seven antibody classes/subclasses and FcR-binding features, among the 13 LASSO-selected features, and adding the functions one by one in order of their VIP scores. In this model, adding the first function (ADCD_LAM) improves the AUC from 0.85 to 0.95, whereas adding the following five functions (ADNP_LAM; ADCD_PPD; ADNK_CD107a_PPD; ADNK_MIP1b_LAM; and ADNK_IFNg_PPD) results in only a minor change in the AUC (plateau).

Similar articles

Cited by

References

    1. World Health Organization . Global Tuberculosis Report 2020. World Health Organization; 2020.
    1. Chin JH. Tuberculous meningitis: Diagnostic and therapeutic challenges. Neurol Clin Pract. 2014;4:199–205. - PMC - PubMed
    1. Dodd PJ, Osman M, Cresswell F V, et al. . The global burden of tuberculous meningitis in adults: A modelling study. PLOS Glob. Public Heal. 2021;1:e0000069. - PMC - PubMed
    1. Bartzatt R. Tuberculosis infections of the central nervous system. Cent. Nerv. Syst. Agents Med. Chem. 2011;11:321–327. - PubMed
    1. Harausz EP, Garcia-Prats AJ, Law S, et al. . Treatment and outcomes in children with multidrug-resistant tuberculosis: A systematic review and individual patient data meta-analysis. PLoS Med. 2018;15:e1002591. - PMC - PubMed

Substances