. 2024 Mar;21(212):20230525.
doi: 10.1098/rsif.2023.0525. Epub 2024 Mar 6.

A Bayesian approach to identifying the role of hospital structure and staff interactions in nosocomial transmission of SARS-CoV-2

Affiliations

A Bayesian approach to identifying the role of hospital structure and staff interactions in nosocomial transmission of SARS-CoV-2

Jessica R E Bridgen et al. J R Soc Interface. 2024 Mar.

Abstract

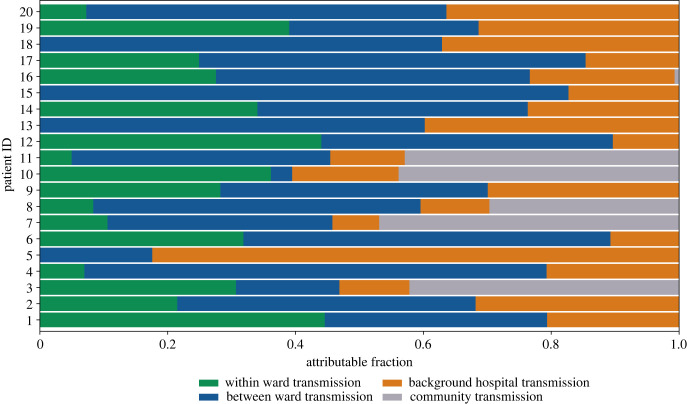
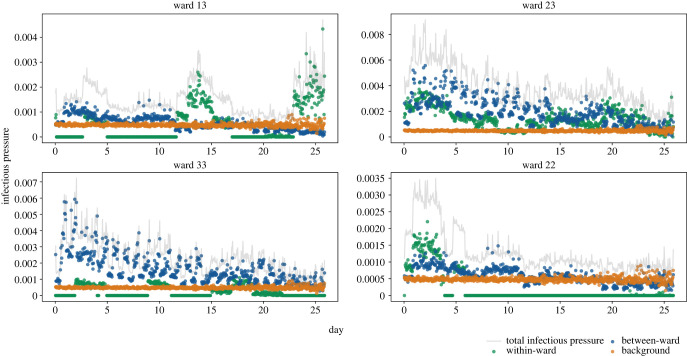
Nosocomial infections threaten patient safety, and were widely reported during the COVID-19 pandemic. Effective hospital infection control requires a detailed understanding of the role of different transmission pathways, yet these are poorly quantified. Using patient and staff data from a large UK hospital, we demonstrate a method to infer unobserved epidemiological event times efficiently and disentangle the infectious pressure dynamics by ward. A stochastic individual-level, continuous-time state-transition model was constructed to model transmission of SARS-CoV-2, incorporating a dynamic staff-patient contact network as time-varying parameters. A Metropolis-Hastings Markov chain Monte Carlo (MCMC) algorithm was used to estimate transmission rate parameters associated with each possible source of infection, and the unobserved infection and recovery times. We found that the total infectious pressure exerted on an individual in a ward varied over time, as did the primary source of transmission. There was marked heterogeneity between wards; each ward experienced unique infectious pressure over time. Hospital infection control should consider the role of between-ward movement of staff as a key infectious source of nosocomial infection for SARS-CoV-2. With further development, this method could be implemented routinely for real-time monitoring of nosocomial transmission and to evaluate interventions.

Keywords: Bayesian inference; SARS-CoV-2; epidemiology; healthcare-associated infections; nosocomial transmission.


Conflict of interest statement

We declare we have no competing interests.

Figures

Figure 1.
Figure 1.
Patient pathway from initial admission to ward allocation, by suspected and confirmed SARS-CoV-2 infection status, during the study period.
Figure 2.
Figure 2.
A schematic illustration of the hospital layout. Each floor of the hospital has two kitchens, one on side A and one on side B. The spatial adjacency tensor W, as defined previously, would consider all wards on the same floor and side of the hospital as connected. The number and size of wards on each floor of the hospital vary.
Figure 3.
Figure 3.
(a) Kernel density estimates for each transmission rate parameter. Dashed lines represent the associated prior distribution. (b) Density estimates of [SE] and [IR] transition times for a random sample of eight observed [EI] events. Distributions for the associated [SE] and [IR] transition times are shown in grey and blue, respectively. The observed [EI] transition time for each randomly selected individual is represented as a green circle positioned between the [SE] and [IR] distributions.
Figure 4.
Figure 4.
Posterior predictive formed from 10 000 stochastic simulations over the joint posterior. Mean simulated number of [EI] transitions in dark green with 95% credible interval as the shaded area. Five individual simulations are displayed in the faint green lines. The observed number of [EI] transitions per day is shown by the dashed line.
Figure 5.
Figure 5.
Mean attributable fraction for each transmission type per infection event for 10 000 posterior samples. Infection events are displayed if they have a mean community transmission attributable fraction less than 0.5.
Figure 6.
Figure 6.
Mean infectious pressure for an individual on the stated ward at each [SE] transition, calculated for 10 000 posterior samples. The wards displayed are those with the highest mean number of nosocomial infections.

Similar articles

References

    1. World Health Organization. 2011. Report on the burden of endemic health care-associated infection worldwide. Technical report.
    1. Read JM, et al. 2021. Hospital-acquired SARS-CoV-2 infection in the UK’s first COVID-19 pandemic wave. Lancet 398, 1037-1038. (10.1016/S0140-6736(21)01786-4) - DOI - PMC - PubMed
    1. Abbas M, Robalo Nunes T, Martischang R, Zingg W, Iten A, Pittet D, Harbarth S. 2021. Nosocomial transmission and outbreaks of coronavirus disease 2019: the need to protect both patients and healthcare workers. Antimicrob. Resist. Infect. Control 10, 7. (10.1186/s13756-020-00875-7) - DOI - PMC - PubMed
    1. Wu Z, McGoogan JM. 2020. Characteristics of and important lessons from the coronavirus disease 2019 (COVID-19) outbreak in China: summary of a report of 72314 cases from the Chinese Center for Disease Control and Prevention. JAMA 23, 1239-1242. (10.1001/jama.2020.2648) - DOI - PubMed
    1. Suárez-García I, Martínez de Aramayona López MJ, Sáez Vicente A, Lobo Abascal P. 2020. SARS-CoV-2 infection among healthcare workers in a hospital in Madrid, Spain. J. Hosp. Infect. 106, 357-363. (10.1016/j.jhin.2020.07.020) - DOI - PMC - PubMed

Publication types