. 2024 Mar;13(3):e12419.
doi: 10.1002/jev2.12419.

Extracellular vesicles as a promising source of lipid biomarkers for breast cancer detection in blood plasma

Affiliations

Extracellular vesicles as a promising source of lipid biomarkers for breast cancer detection in blood plasma

Erika Dorado et al. J Extracell Vesicles. 2024 Mar.

Abstract

Extracellular vesicles (EVs), including exosomes and microvesicles, mediate intercellular communication in cancer, from development to metastasis. EV-based liquid biopsy is a promising strategy for cancer diagnosis as EVs can be found in cancer patients' body fluids. In this study, the lipid composition of breast cancer-derived EVs was studied as well as the potential of blood plasma EVs for the identification of lipid biomarkers for breast cancer detection. Initially, an untargeted lipidomic analysis was carried out for a panel of cancerous and non-cancerous mammary epithelial cells and their secreted EVs. We found that breast cancer-derived EVs are enriched in sphingolipids and glycerophospholipids compared to their parental cells. The initial in vitro study showed that EVs and their parental cells can be correctly classified (100% accuracy) between cancerous and non-cancerous, as well as into their respective breast cancer subtypes, based on their lipid composition. Subsequently, an untargeted lipidomic analysis was carried out for blood plasma EVs from women diagnosed with breast cancer (primary or progressive metastatic breast cancer) as well as healthy women. Correspondingly, when blood plasma EVs were analysed, breast cancer patients and healthy women were correctly classified with an overall accuracy of 93.1%, based on the EVs' lipid composition. Similarly, the analysis of patients with primary breast cancer and healthy women showed an overall accuracy of 95% for their correct classification. Furthermore, primary and metastatic breast cancers were correctly classified with an overall accuracy of 89.5%. This reveals that the blood plasma EVs' lipids may be a promising source of biomarkers for detection of breast cancer. Additionally, this study demonstrates the usefulness of untargeted lipidomics in the study of EV lipid composition and EV-associated biomarker discovery studies. This is a proof-of-concept study and a starting point for further analysis on the identification of EV-based biomarkers for breast cancer.

Keywords: breast cancer; extracellular vesicles; lipidomics; liquid biopsy; mass spectrometry.


Conflict of interest statement

E.D. acknowledges support from Merck KGaA, Darmstadt, Germany, through the STRATiGRAD PhD program at Imperial College London. A.N. and M.M.S. acknowledge support from the GlaxoSmithKline Engineered Medicines Laboratory. M.M.S. acknowledges support from the Rosetrees Trust. These organisations did not play any role in the study design, data collection/analysis, manuscript preparation or publication. This work is the subject of an Imperial College Invention Disclosure application.

Figures
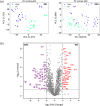
FIGURE 1
FIGURE 1
Lipidomic analysis of EVs and their parental cells. (a) PCA showing the LC‐MS data distribution for both cells (N = 11 cell lines and 3 biological replicates; n = 33) and their secreted EVs (n = 33). This includes both cancerous and non‐cancerous cells and their EVs. The LC‐MS data was acquired in both ESI+ and ESI− modes. (b) Volcano plot showing the lipids significantly (q‐value < 0.05) enriched in breast cancer‐derived EVs (log2 fold change > 2, red stars) when compared to their parental cells (log2 fold change < −2, purple stars). n = total number of observations.
FIGURE 2
FIGURE 2
Classification of EVs and cells into cancerous and non‐cancerous. (a) Box plots for the PE and PC species identified by LR‐RFE analysis that distinguish EVs and cells between cancerous (N = 9 breast cancer cell lines and their respective EVs, 3 biological replicates; n = 54) and non‐cancerous (N = 2 non‐cancerous cell lines and their respective EVs, 3 biological replicates; n = 12). Box plots are based on the fused and auto‐scaled ESI− and ESI+ datasets. (b) Confusion matrix of the leave‐one‐group‐out cross‐validated LR classification model of EVs and cells into cancerous (n = 54) and non‐cancerous (n = 12) with an overall accuracy of 100%. (c) Confusion matrix of the leave‐one‐group‐out cross‐validated LR classification model of EVs into cancerous (EVs obtained from N = 9 breast cancer cell lines, 3 biological replicates; n = 27) and non‐cancerous (EVs obtained from N = 2 non‐cancerous cell lines, 3 biological replicates; n = 6) based on the sphingolipids found enriched in breast cancer‐derived EVs indicated in Figure 1b and Table S1. The overall accuracy of the model is 87.9%. Biological replicates were defined as one group for leave‐one‐group‐out cross‐validated LR classification analysis. As per the scale on the right‐hand side of the confusion matrix the colour is driven by the number of observations (n) rather than the percentages.
FIGURE 3
FIGURE 3
Classification of breast cancer cells and their secreted EVs into their respective breast cancer subtypes. (a) Box plots for the five lipid species identified by the LR‐RFE analysis that classifies breast cancer cells and their EVs into their respective breast cancer subtypes. Nine breast cancer cell lines were studied from different molecular subtypes: ER+/PR+ (N = 2 cell lines and their respective EVs, 3 biological replicates; n = 12), HER2+ (N = 2 cell lines and their respective EVs, 3 biological replicates; n = 12), and TNBC (N = 5 cell lines and their respective EVs, 3 biological replicates; n = 30). Box plots are based on the fused and auto‐scaled ESI− and ESI+ datasets. (b) Confusion matrix of the leave‐one‐group‐out cross‐validated LR classification model of EVs and cells into breast cancer subtypes (100% accuracy). (c) Confusion matrix of the leave‐one‐group‐out cross‐validated LR classification of EVs into their respective breast cancer subtype (overall accuracy of 70.4%) based on the sphingolipids enriched in breast cancer‐derived EVs indicated in Figure 1b and Table S1. Biological replicates were defined as one group for cross‐validation analysis. As per the scale on the right‐hand side of the confusion matrix the colour is driven by the number of observations (n) rather than the percentages.
FIGURE 4
FIGURE 4
Characterisation of EVs isolated from blood plasma by combination of density gradient ultracentrifugation and size exclusion/bind‐elute chromatography. (a) Western blot analysis of EV protein markers (CD9 and CD81) and ApoA1 in a pooled sample of all blood plasma (PL) samples, and a pooled sample of EVs (EV) isolated from the blood plasma samples studied. (b) EVs morphology analysed by TEM. (c) Box plots for the distribution of the EV concentration per mL obtained from the blood plasma samples from healthy volunteers (HV, N = 10), patients with primary breast cancer (Primary, N = 10), and patients with progressive metastatic breast cancer (Metastatic, N = 9). P‐values were obtained by Mann–Whitney U tests for comparisons between the groups studied (HV vs. metastatic, HV vs. primary, and primary vs. metastatic).
FIGURE 5
FIGURE 5
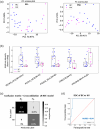
Lipidomic analysis of blood plasma EVs from breast cancer patients and healthy volunteers. (a) PCA showing the LC‐MS data distribution for the breast cancer patients’ samples (BC, N = 19), and healthy volunteers (HV, N = 10), in both ESI+ and ESI− modes. BC samples include primary (N = 10) and progressive metastatic (N = 9) breast cancer samples. (b) Box plots for the five lipid species identified by the statistical model obtained by LR‐RFE analysis which distinguish BC samples from samples from HV. Box plots are based on the fused and auto‐scaled ESI− and ESI+ datasets. (c) Confusion matrix of the leave‐one‐individual‐out cross‐validated LR classification of BC and HV samples showing an overall accuracy of 93.1%. The colour scheme of the confusion matrix is driven by the number of observations rather than the percentages. (d) AUROC for the combination of the five relevant lipid species was equal to 0.94.
FIGURE 6
FIGURE 6
Lipidomic analysis of blood plasma EVs from primary breast cancer patients and healthy volunteers. (a) Box plots for the five lipid species identified by the statistical model obtained by LR‐RFE analysis that distinguish breast cancer patients from healthy volunteers (HV, N = 10), but also primary breast cancer patients (BC‐primary, N = 10) from HV. Box plots are based on the fused and auto‐scaled ESI− and ESI+ datasets. (b) Confusion matrix of the leave‐one‐individual‐out cross‐validated LR classification of primary breast cancer and HV samples showing an overall accuracy of 95%. The colour scheme of the confusion matrix is driven by the number of observations rather than the percentages. (c) AUROC curve for the combination of the five relevant lipid species was equal to 0.97.
FIGURE 7
FIGURE 7
Lipidomic analysis of blood plasma EVs from primary and metastatic breast cancer patients. (a) Box plots for the five lipid species identified by the statistical model obtained by LR‐RFE analysis that distinguishes primary cancers (N = 10) from metastatic cancers (N = 9). Box plots are based on the fused and auto‐scaled ESI− and ESI+ datasets. (b) Confusion matrix of the leave‐one‐individual‐out cross‐validated LR classification of primary breast cancers and metastatic cancers showing an overall accuracy of 89.5%. The colour scheme of the confusion matrix is driven by the number of observations rather than the percentages. (c) AUROC curve for the combination of the five relevant lipid species was equal to 0.97.

References

    1. Alimirzaie, S. , Bagherzadeh, M. , & Akbari, M. R. (2019). Liquid biopsy in breast cancer: A comprehensive review. Clinical Genetics, 95(6), 643–660. - PubMed
    1. Armakolas, A. , Kotsari, M. , & Koskinas, J. (2023). Liquid biopsies, novel approaches and future directions. Cancers, 15(5), 1579. - PMC - PubMed
    1. Arnold, M. , Morgan, E. , Rumgay, H. , Mafra, A. , Singh, D. , Laversanne, M. , Vignat, J. , Gralow, J. R. , Cardoso, F. , Siesling, S. , & Soerjomataram, I. (2022). Current and future burden of breast cancer: Global statistics for 2020 and 2040. Breast (Edinburgh, Scotland), 66, 15–23. - PMC - PubMed
    1. Bell, E. , & Taylor, M. A. (2016). Functional Roles for Exosomal MicroRNAs in the Tumour Microenvironment. Computational and Structural Biotechnology Journal, 15, 8–13. - PMC - PubMed
    1. Benjamin, D. I. , Cozzo, A. , Ji, X. , Roberts, L. S. , Louie, S. M. , Mulvihill, M. M. , Luo, K. , & Nomura, D. K. (2013). Ether lipid generating enzyme AGPS alters the balance of structural and signaling lipids to fuel cancer pathogenicity. PNAS, 110(37), 14912–14917. - PMC - PubMed