. 2024 Mar 5;15(1):1987.
doi: 10.1038/s41467-024-46193-z.

Lactate dehydrogenase A regulates tumor-macrophage symbiosis to promote glioblastoma progression

Affiliations

Lactate dehydrogenase A regulates tumor-macrophage symbiosis to promote glioblastoma progression

Fatima Khan et al. Nat Commun. .

Abstract

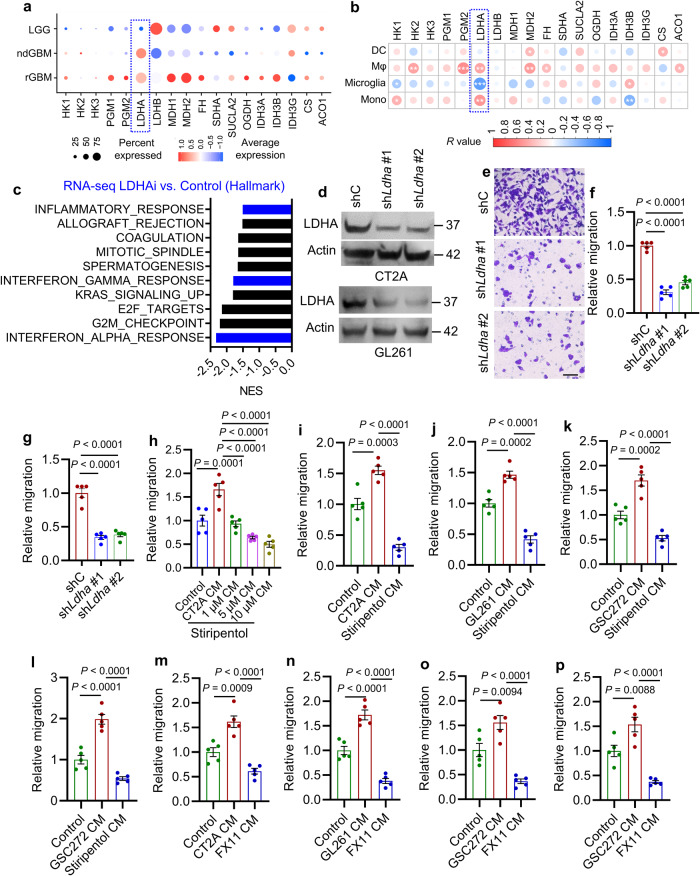
Abundant macrophage infiltration and altered tumor metabolism are two key hallmarks of glioblastoma. By screening a cluster of metabolic small-molecule compounds, we show that inhibiting glioblastoma cell glycolysis impairs macrophage migration and lactate dehydrogenase inhibitor stiripentol emerges as the top hit. Combined profiling and functional studies demonstrate that lactate dehydrogenase A (LDHA)-directed extracellular signal-regulated kinase (ERK) pathway activates yes-associated protein 1 (YAP1)/ signal transducer and activator of transcription 3 (STAT3) transcriptional co-activators in glioblastoma cells to upregulate C-C motif chemokine ligand 2 (CCL2) and CCL7, which recruit macrophages into the tumor microenvironment. Reciprocally, infiltrating macrophages produce LDHA-containing extracellular vesicles to promote glioblastoma cell glycolysis, proliferation, and survival. Genetic and pharmacological inhibition of LDHA-mediated tumor-macrophage symbiosis markedly suppresses tumor progression and macrophage infiltration in glioblastoma mouse models. Analysis of tumor and plasma samples of glioblastoma patients confirms that LDHA and its downstream signals are potential biomarkers correlating positively with macrophage density. Thus, LDHA-mediated tumor-macrophage symbiosis provides therapeutic targets for glioblastoma.


Conflict of interest statement

The authors declare no competing interests.

Figures

Fig. 1
Fig. 1. Glioblastoma cell glycolysis promotes macrophage migration.
a Kaplan-Meier survival curves of GBM patients relative to high (n = 119) and low (n = 119) metabolism signature. b The correlation analysis between metabolism signature and immune score in IDH-WT glioblastoma patient tumors (n = 300). c GSEA analysis for distinct types of immune cells in metabolism signature-high (n = 119) and -low (n = 119) patient tumors from TCGA glioblastoma dataset. Green and blue bars indicate the signatures that are significantly enriched metabolism signature-high patient tumors (FDR < 0.25). d Quantification of relative migration of Raw264.7 macrophages following stimulation with conditioned media (CM) from CT2A cells treated with or without a cluster of 55 brain-penetrant small-molecule compounds with metabolic reprogramming functions at 10 μM (n = 3 biological replicates). n.s., not significant. e Quantification of relative migration of Raw264.7 macrophages following stimulation with CM from CT2A cells treated with or without above identified 24 compounds at 5 μM (n = 3 independent samples). n.s., not significant. f, g UMAP dimensional reduction of single glioma cells f and myeloid cells g from tumors of 18 glioma patients, including 2 low-grade gliomas (LGG) and 16 glioblastoma. h Expression pattern representing single-cell gene expression of glycolysis signature in glioblastoma cells. i The correlation analysis between the glycolysis signature in glioblastoma cells and the abundance of macrophages and monocytes in tumors based on single-cell RNA sequencing data. Each dot represents one glioblastoma patient tumor. j, k Representative images j and quantification k of relative migration of Raw264.7 macrophages from a transwell analysis following stimulation with CM from CT2A cells treated with or without glycolysis inhibitor 2-Deoxy-d-glucose (2-DG) at indicated concentrations (n = 5 independent samples). Scale bar, 100 μm. l, m Quantification of relative migration of Raw264.7 macrophages l and primary mouse bone-marrow-derived macrophages m following stimulation with CM from GL261 and CT2A cells, respectively, treated with or without 2-DG at 10 mM (n = 5 independent samples). n, o Quantification of relative migration of THP-1 macrophages n and primary human bone-marrow-derived macrophages o following stimulation with CM from GSC272 treated with or without 2-DG at 10 mM (n = 5 independent samples). The experiments for e and jo were independently repeated at least two times. Data presented as mean ± SEM. Statistical analyses were determined by log-rank test a, Pearson’s correlation test b, i and one-way ANOVA test d, e, k, l, m, n, o. Source data are provided as a Source Data file.
Fig. 2
Fig. 2. Glioblastoma cell LDHA promotes macrophage migration.
a Expression of key glycolysis and TCA cycle enzymes in glioma cells of low-grade gliomas (LGG), newly diagnosed glioblastoma (ndGBM), and recurrent glioblastoma (rGBM) based on single-cell RNA sequencing data. The percent and average expressions are shown. b The correlation between key glycolysis and TCA cycle enzymes in glioblastoma cells and myeloid cells, including dendritic cells (DCs), macrophages (Mφ), microglia, and monocytes (Mono) from glioblastoma patient tumors. Red signal indicates positive correlation and blue signal denotes a negative correlation. *P < 0.05, ** P < 0.01, ***P < 0.001. c RNA-seq experiments and GSEA analysis in LDHA inhibitor FX11-treated and control CT2A cells. Top ten FX11-downregulated hallmark pathways are shown. Blue bars indicate the signatures relating to immune response. d Immunoblots of LDHA in cell lysates of CT2A and GL261 cells expressing shRNA control (shC) and Ldha shRNAs (shLdha). The experiments were independently repeated at least three times. e, f Representative images e and quantification f of relative migration of Raw264.7 macrophages from a transwell analysis following stimulation with CM from CT2A cells expressing shC and shLdha. Scale bar, 100 μm. n = 5 independent samples. g Quantification of relative migration of Raw264.7 macrophages following stimulation with CM from shC and shLdha GL261 cells. n = 5 independent samples. h Quantification of relative migration of Raw264.7 macrophages following stimulation with CM from CT2A cells treated with or without stiripentol. n = 5 independent samples. i, j Quantification of relative migration of primary mouse bone-marrow-derived macrophages (BMDMs, i and Raw264.7 macrophages j following stimulation with CM from CT2A and GL261 cells, respectively, treated with or without stiripentol (10 μM). n = 5 independent samples. k, l Quantification of relative migration of THP-1 macrophages k and primary human BMDMs l following stimulation with CM from GSC272 treated with or without stiripentol (10 μM). n = 5 independent samples. m, n Quantification of relative migration of Raw264.7 macrophages following stimulation with CM from CT2A m or GL261 n cells treated with or without FX11 (8 μM). n = 5 independent samples. o, p Quantification of relative migration of THP-1 macrophages (o) and primary human BMDMs (p) following stimulation with CM from GSC272 treated with or without FX11 (8 μM). n = 5 independent samples. The experiments for (ep) were independently repeated at least two times. Data presented as mean ± SEM. Statistical analyses were determined by Pearson’s correlation test (b) and one-way ANOVA test (fp). Source data are provided as a Source Data file.
Fig. 3
Fig. 3. LDHA promotes macrophage migration via upregulating CCL2 and CCL7.
a RNA-seq experiments and GSEA analysis in control and LDHA inhibitor FX11-treated CT2A cells. Top ten FX11-downregulated KEGG pathways are shown. Blue bars indicate the signatures relating to cytokine and chemokine pathways. b Identification of 11 genes encoding secreted proteins that are downregulated by FX11 treatment in CT2A cells and upregulated in LDHA-high glioblastoma patient tumors. c Heat map representation of the 11 downregulated genes in FX11-treated CT2A cells. Red and blue signal indicates high and low expression, respectively. d RT-qPCR for indicated genes in control and FX11-treated CT2A cells. The values were expressed as the fold change. n = 6 independent samples. e, f RT-qPCR for indicated genes in CT2A cells treated with or without stiripentol e or expressing shRNA control (shC) and Ldha shRNAs (shLdha) f. The values were expressed as the fold change. n = 6 independent samples. g, h Representative images (g) and quantification (h) of relative migration of Raw264.7 macrophages following stimulation with indicated recombinant proteins (10 ng/ml). Scale bar, 100 μm. n = 5 independent samples. i RT-qPCR for CCL2 in GSC272 treated with or without stiripentol (10 μM). The values were expressed as the fold change. n = 6 independent samples. j Immunoblots of CCL7 in GSC272 treated with or without stiripentol (10 μM). k, l ELISA for CCL2 k, and CCL7 l in the conditioned media (CM) from number-matched GSC272 treated with or without stiripentol (10 μM). n = 3 independent samples. m Quantification of relative migration of human THP-1 macrophages following stimulation with recombinant CCL2 and CCL7 proteins (10 ng/ml). n = 5 independent samples. n, o Quantification of relative migration of Raw264.7 macrophages following stimulation with CM from CT2A (n) or GL261 (o) cells expressing shC and shCcl2. n = 5 independent samples. p, q Quantification of relative migration of Raw264.7 macrophages following stimulation with CM from CT2A (p) or GL261 (q) cells expressing shC and shCcl7. n = 5 independent samples. r, s Quantification of relative migration of THP-1 macrophages r and primary human BMDMs s following stimulation with CM from shC and shCCL2 GSC272. n = 5 independent samples. t, u Quantification of relative migration of THP-1 macrophages (t) and primary human BMDMs (u) following stimulation with CM from shC and shCCL7 GSC272 expressing. n = 5 independent samples. The experiments for (dj and mu) were independently repeated at least two times. Data presented as mean ± SEM and analysed by two-tailed Student’s t-test (d, e, i, k, l) and one-way ANOVA test (f, h, mo, pu). Source data are provided as a Source Data file.
Fig. 4
Fig. 4. LDHA-induced CCL2 and CCL7 expression is regulated by YAP1 and STAT3 transcriptional co-activators.
a Identification of oncogenic pathways (using GSEA), including transcription factors (TFs), signaling pathways, epigenetic factors, tumor suppressor genes (TSG), oncogenes, and others that are downregulated by FX11 treatment in CT2A cells and enriched in LDHA-high glioblastoma patient tumors. b Heat map representation of above-identified factors in control and FX11-treated CT2A cells. The red signal indicates higher expression and the blue signal denotes lower expression. N/A indicates the gene that does not present in this dataset. The downregulated genes upon FX11 treatment are highlighted. c, d RT-qPCR for Hoxa9, Yap1, Eed, and Ezh2 in CT2A cells treated with or without FX11 c or stiripentol d. The values were expressed as the fold change. n = 6 independent samples. e, f RT-qPCR for indicated genes in CT2A e and GL261 f cells expressing shRNA control (shC) and Ldha shRNAs (shLdha). The values were expressed as the fold change. n = 6 independent samples. g, h Immunoblots of P-ERK, ERK, YAP1, P-STAT3, and STAT3 in CT2A cells expressing shC and shLdha (g) or treated with or without FX11 (8 μM) (h). i Immunoblots of P-ERK, ERK, YAP1, P-STAT3, and STAT3 in CT2A cells and GSC272 treated with or without stiripentol (10 μM). j Immunoblots of P-STAT3 and STAT3 in CT2A cells and GSC272 treated with or without YAP-TEAD interaction inhibitor (YAP1i) verteporfin (1 μM); or immunoblots of YAP1 in CT2A cells and GSC272 treated with or without STAT3 inhibitor (STAT3i) WP1066 (10 μM). k RT-qPCR for Yap1 in CT2A and GL261 cells treated with or without YAP1i (1 μM) or STAT3i (10 μM). The values were expressed as the fold change. n = 6 independent samples. l, m Quantification of YAP1 and STAT3 ChIP-PCR in the Ccl2 l or Ccl7 m promoter of CT2A cells expressing shC and shLdha. n = 4 independent samples. n, o RT-qPCR for Ccl2 and Ccl7 in CT2A (n) and GL261 (o) cells treated with or without YAP1i or STAT3i. The values were expressed as the fold change. n = 6 independent samples. The experiments for (cm) and (n and o) were independently repeated at least three and two times, respectively. Data presented as mean ± SEM and analysed by two-tailed Student’s t-test (c, d) and one-way ANOVA test (e, f, k, l, m, n, o). Source data are provided as a Source Data file.
Fig. 5
Fig. 5. TAM-derived LDHA-containing EVs promote glioblastoma cell growth and glycolysis, and activate the ERK-YAP1/STAT3-CCL2/CCL7 signaling.
a Immunoblots of LDHA in CT2A and GL261 cells treated with conditioned media (CM) from CT2A/GL261 CM-educated Raw264.7 macrophages (EMφ) expressing shRNA control (shC) or Ldha shRNAs (shLdha). b Immunoblots of LDHA in CT2A and GL261 cells treated with CM from EMφ in the presence or absence of FX11 (10 μM). c Immunoblots of LDHA in CT2A cells (control) and treated with CM from CT2A EMφ in the presence or absence of GW4869 at 1, 5, and 10 μM. d Immunoblots of LDHA in GL261 cells treated with or without CM from GL261 EMφ in the presence or absence of GW4869 at 10 μM. e Immunoblots of LDHA, CD63, ALIX, and calnexin in Raw264.7 macrophage lysate and in EVs isolated from Raw264.7 Mφ, CT2A EMφ and GL261 EMφ expressing shC and shLdha. f, g Representative images (f) and quantification (g) of immunofluorescence for LDHA in CT2A cells incubated with (500 ng) isolated from Raw264.7 Mφ and CT2A EMφ expressing shC and shLdha for 24 hrs. Scale bar, 200 μm. n = 3 independent samples. h Representative images of cell cycle analysis of CT2A cells treated with EVs (500 ng) isolated from Raw264.7 Mφ and CT2A EMφ, as well as with stiripentol (10 μM) in the presence or absence of EVs isolated from CT2A EMφ expressing shC and shLdha. A representative example of three replicates. i Quantification of flow cytometry apoptosis analysis in CT2A cells treated with EVs (500 ng) isolated from Raw264.7 Mφ and CT2A EMφ, as well as with stiripentol (10 μM) in the presence or absence of EVs isolated from CT2A EMφ expressing shC and shLdha. n = 3 independent samples. j Extracellular acidification rate (ECAR) of CT2A cells expressing shC and shLdha and treated with or without EVs (500 ng) isolated from CT2A EMφ and shLdha EMφ. n = 6 independent samples. k Immunoblots of P-ERK, ERK, YAP1, P-STAT3, STAT3, and Actin in LDHA-depleted CT2A cells treated with or without EVs (500 ng) isolated from CT2A EMφ and shLdha EMφ. l, m RT-qPCR for Ccl2 l and Ccl7 m in LDHA-depleted CT2A cells treated with or without EVs (500 ng) isolated from CT2A EMφ and shLdha EMφ. n = 6 independent samples. The experiments for (am) were independently repeated at least three times. Data presented as mean ± SEM and analysed by one-way ANOVA test (g, i, l, m). Source data are provided as a Source Data file.
Fig. 6
Fig. 6. Inhibition of LDHA-mediated tumor-macrophage symbiosis reduces macrophage infiltration and glioblastoma growth in vivo.
a, b Survival curves of C57BL/6 mice implanted with 2×10⁴ CT2A cells a expressing shRNA control (shC, n = 10 mice) and Ldha shRNAs (n = 15 and 5 mice for shLdha #1 and shLdha #2 group, respectively) or GL261 cells b expressing shC (n = 6 mice) and shLdha (n = 7 mice). ce Survival curves of C57BL/6 mice implanted with CT2A c and GL261 cells d, or 1 × 10⁵ 005 GSCs e. Mice were treated with stiripentol (150 mg/kg, i.p., every other day for 6 doses) beginning at day 8 c, d, n = 5 and 7 mice for control and stiripentol group, respectively) or 11 e, n = 7 mice per group) post-orthotopic injection. f Survival curves of nude mice implanted with 2×10⁵ GSC272 and treated with stiripentol (150 mg/kg, i.p., every other day, 8 doses) beginning at day 15 post-orthotopic injection. n = 10 mice per group. gi Representative g and quantification h of flow cytometry analysis for the percentage of CD68+ macrophages out of CD45highCD11b+ cells in GL261 g, h or CT2A i tumors treated with or without stiripentol. n = 3 independent samples. jm Immunofluorescence and quantification of nuclear STAT3 j, k or YAP1 l, m positive cells in CT2A tumors treated with or without stiripentol. Scale bar, 20 μm. n = 3 independent samples. n, o The plasma level CCL2 and CCL7 in GL261 tumor-bearing mice treated with or without stiripentol n, o or in CT2A tumor-bearing mice treated with or without STAT6 inhibitor WP1066 (60 mg/kg, oral gavage, every other day for 6 doses; p, q. n = 3 independent samples. r Quantification of flow cytometry analysis for the percentage of CD68+ macrophages out of CD45highCD11b+ cells in CT2A tumors treated with or without WP1066. n = 3 independent samples. s Survival curves of C57BL/6 mice implanted with CT2A cells expressing shC, shCcl2 or shCcl7. n = 10 mice per group. t Quantification of flow cytometry analysis for the percentage of CD68+ macrophages out of CD45highCD11b+ cells in shC, shCcl2 and shCcl7 CT2A tumors. n = 3. u Survival curves of C57BL/6 mice implanted with CT2A cells expressing shC and shLdha. Mice were treated with or without stiripentol and extracellular vesicles (EVs, 5 μg/mouse, i.v., every other day for five doses) isolated from CT2A CM-treated Raw264.7 macrophages (EMφ EVs) beginning at day 8 post-orthotopic injection. n = 7 mice per group except for the groups of shLdha #1 + MΦ EVs or shLdha #2 + MΦ EVs where n = 10 mice per group. v Survival curves of WT and LDHA-mKO mice implanted with CT2A cells and treated with or without stiripentol beginning at day 8 post-orthotopic injection. n = 7 mice per group except for the groups of control and stiripentol where n = 5 mice per group. The experiments for (jm) were independently repeated at least three times. Data presented as mean ± SEM. Statistical analyses were determined by log-rank test (af, s, u, v), two-tailed Student’s t-test (h, i, k, mr), and one-way ANOVA test (t). Source data are provided as a Source Data file.
Fig. 7
Fig. 7. The LDHA–YAP1/STAT3–CCL2/CCL7 axis tracks with macrophages in glioblastoma patients and is increased in patient plasma EVs.
a The correlation of glioblastoma cell LDHA, YAP1, STAT3, CCL2, and CCL7 with macrophage abundance in glioblastoma patient tumors based on single-cell RNA sequencing data (n = 37). R and P values are shown. b The correlation of LDHA, YAP1, STAT3, CCL2, and CCL7 with the abundance of macrophages and monocytes in glioblastoma patient tumors based on TCGA dataset (n = 478). Red signal indicates positive correlation and blue signal denotes negative correlation. ***P < 0.0001. c, d Representative images c and correlation quantification analysis d between LDHA and Mac-2 expression in glioblastoma patient tumors (n = 30). Scale bar, 50 μm. R and P values are shown. eg ELISA for LDHA e, CCL2 f, and CCL7 g in the plasma from healthy controls (n = 10), meningioma (n = 15), and glioblastoma (n = 54) patients. h Correlation analysis between plasma LDHA level and plasma CCL2 level in meningioma (n = 15), and glioblastoma (n = 54) patients. R and P values are shown. i Correlation analysis between plasma LDHA level and plasma CCL7 level in meningioma (n = 15), and glioblastoma (n = 54) patients. R and P values are shown. j Correlation analysis between plasma LDHA level and intratumoral macrophage density (Mac-2+ cells) in glioblastoma patients (n = 30). R and P values are shown. k Kaplan-Meier survival curves of glioblastoma patients relative to high (top 25%, n = 9) and low (bottom 25%, n = 9) serum LDHA level. The median survival time of each group is indicated. Log-rank test. l Transmission electron microscopy analysis of extracellular vesicles (EVs) isolated from the plasma of healthy control and glioblastoma patients (n = 5). Scale bar, 100 nm. m, n Representative images (m) and quantification (n) of flow cytometry for LDHA in CD63+ EVs isolated from the plasma of healthy controls (n = 5) and glioblastoma patients (n = 10). The experiments for (ln) were independently repeated at least three times. Data presented as mean ± SD. Statistical analyses were determined by Pearson’s correlation test (a, b, d, hj), one-way ANOVA test (eg), and two-tailed Student’s t-test (n). Source data are provided as a Source Data file.
Fig. 8
Fig. 8. Working model.
Schematic representation of the role of the LDHA–ERK–STAT3/YAP pathway in regulation of CCL2 and CCL7 in glioblastoma cells, which, in turn, promotes macrophage infiltration. These infiltrating macrophages are educated by the TME and promote glioblastoma cell proliferation and survival via transferring LDHA-containing extracellular vesicles. Inhibition of LDHA is a promising therapeutic strategy for glioblastoma via blockade of the tumor-macrophage symbiotic interaction. This image was created with BioRender.com.

Update of

Similar articles

Cited by

References

    1. Stupp R, et al. Effects of radiotherapy with concomitant and adjuvant temozolomide versus radiotherapy alone on survival in glioblastoma in a randomised phase III study: 5-year analysis of the EORTC-NCIC trial. Lancet Oncol. 2009;10:459–466. doi: 10.1016/S1470-2045(09)70025-7. - DOI - PubMed
    1. Wen PY, et al. Glioblastoma in adults: a Society for Neuro-Oncology (SNO) and European Society of Neuro-Oncology (EANO) consensus review on current management and future directions. Neuro Oncol. 2020;22:1073–1113. doi: 10.1093/neuonc/noaa106. - DOI - PMC - PubMed
    1. Chen P, et al. Symbiotic macrophage-glioma cell interactions reveal synthetic lethality in PTEN-Null glioma. Cancer Cell. 2019;35:868–884 e866. doi: 10.1016/j.ccell.2019.05.003. - DOI - PMC - PubMed
    1. Khosla D. Concurrent therapy to enhance radiotherapeutic outcomes in glioblastoma. Ann. Transl. Med. 2016;4:54. - PMC - PubMed
    1. Pang L, Khan F, Dunterman M, Chen P. Pharmacological targeting of the tumor-immune symbiosis in glioblastoma. Trends Pharm. Sci. 2022;43:686–700. doi: 10.1016/j.tips.2022.04.002. - DOI - PMC - PubMed