. 2024 Mar 5;15(3):189.
doi: 10.1038/s41419-024-06509-9.

The m6A reader IGF2BP2 regulates glycolytic metabolism and mediates histone lactylation to enhance hepatic stellate cell activation and liver fibrosis

Affiliations

The m6A reader IGF2BP2 regulates glycolytic metabolism and mediates histone lactylation to enhance hepatic stellate cell activation and liver fibrosis

Yongqiang Zhou et al. Cell Death Dis. .

Abstract

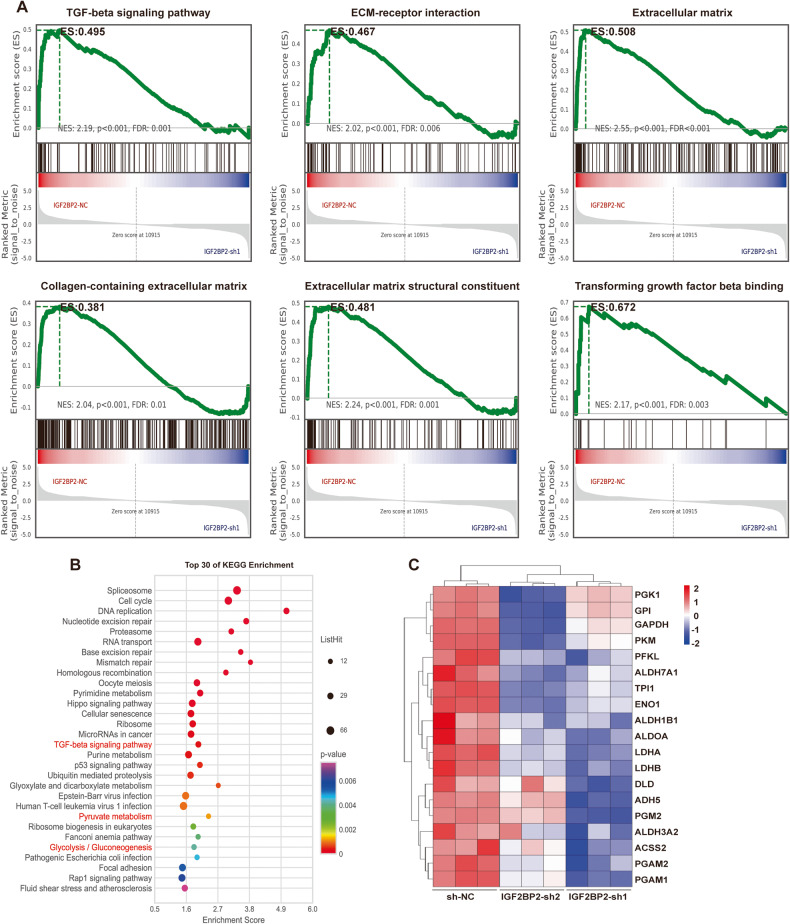
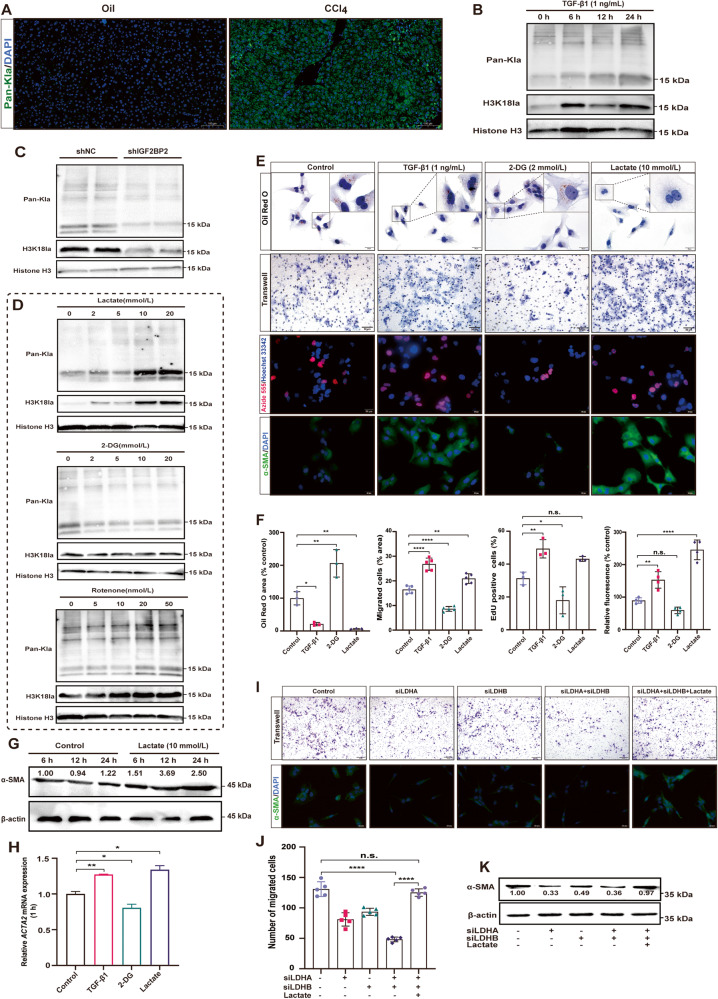
Evidence for the involvement of N6-Methyladenosine (m6A) modification in the etiology and progression of liver fibrosis has emerged and holds promise as a therapeutic target. Insulin-like growth factor 2 (IGF2) mRNA-binding protein 2 (IGF2BP2) is a newly identified m6A-binding protein that functions to enhance mRNA stability and translation. However, its role as an m6A-binding protein in liver fibrosis remains elusive. Here, we observed that IGF2BP2 is highly expressed in liver fibrosis and activated hepatic stellate cells (HSCs), and inhibition of IGF2BP2 protects against HSCs activation and liver fibrogenesis. Mechanistically, as an m6A-binding protein, IGF2BP2 regulates the expression of Aldolase A (ALDOA), a key target in the glycolytic metabolic pathway, which in turn regulates HSCs activation. Furthermore, we observed that active glycolytic metabolism in activated HSCs generates large amounts of lactate as a substrate for histone lactylation. Importantly, histone lactylation transforms the activation phenotype of HSCs. In conclusion, our findings reveal the essential role of IGF2BP2 in liver fibrosis by regulating glycolytic metabolism and highlight the potential of targeting IGF2BP2 as a therapeutic for liver fibrosis.


Conflict of interest statement

The authors declare no competing interests.

Figures

Fig. 1
Fig. 1. IGF2BP2 expression is elevated in liver fibrosis and cirrhosis.
A IGF2BP2 expression in liver fibrosis and cirrhosis from the GEO database. (a) Igf2bp2 expression in CCl4-induced liver fibrosis and normal control from GSE55747. bd IGF2BP2 expression in liver cirrhosis and normal control from GSE102383, GSE25097, and GSE6764. e IGF2BP2 expression in patients with Scheuer scores S0-1 and S2-4 from GSE84044. f IGF2BP2 expression in cirrhotic patients who develop HCC and those who do not develop HCC from GSE15654. g IGF2BP2 expression in cirrhotic patients with good or poor prognosis from GSE15654. B IGF2BP2 expression in cirrhosis retrieved from the Human Liver Proteome Database. CE Correlation analysis of IGF2BP2 expression with ACTA2 and COL1α1 expression in cirrhotic samples from GSE25097 (n = 40) and GSE15654 (n = 216). Representative H&E staining and Masson’s trichrome staining images (F) and bar plot (G) in CCl4-induced fibrotic livers of mice and livers of human patients with cirrhosis (scale bars, 100 µm). H Igf2bp2, Acta2, and Col1α1 mRNA expression in CCl4-induced fibrotic livers of mice. I Correlation analysis of Igf2bp2 mRNA expression with Acta2 mRNA expression and Col1α1 mRNA expression. Levels of IGF2BP2 in CCl4-induced fibrotic livers of mice and livers of human patients with cirrhosis revealed by immunoblotting (J) and bar plot (K). L Serum levels of IGF2BP2 in cirrhotic patients (n = 46) and healthy donors (n = 24). M The receiver operating characteristic (ROC) curve demonstrates the efficacy of IGF2BP2 combined with alanine transaminase (ALT) in predicting cirrhosis. *P < 0.05, **P < 0.01, ***P < 0.001, ****P < 0.0001.
Fig. 2
Fig. 2. Inhibition of IGF2BP2 ameliorates CCl4-induced liver fibrosis.
A Schematic illustrating of the experimental design of AAV-shIgf2bp2 for the treatment of CCl4-induced liver fibrosis in mice. B Expression of Igf2bp2 in mouse liver samples treated in according to (A) (n = 4). Representative images (C) and bar plot (D, E) of H&E staining (upper), masson’s trichrome staining (middle) and sirius red staining (bottom) in mouse liver sections treated according to (A) (n = 6, scale bar, 100 µm). Representative images (F) and bar plot (G) of α-SMA expression (n = 3, scale bar, 100 µm) visualized by immunofluorescence in mouse liver sections treated according to (A). Serum levels of ALT (H) and AST (I) in mice treated according to (A). *P < 0.05, **P < 0.01, ***P < 0.001, ****P < 0.0001.
Fig. 3
Fig. 3. Inhibition of IGF2BP2 blocks HSCs activation in vitro.
qRT-PCR (A) and immunoblotting (B) confirmed effective IGF2BP2 KD by shRNA in LX-2 cells. Representative images (C) and bar plot (DF) of cell migration assays (upper, scale bar, 50 µm), EdU cell proliferation assays (middle, scale bar, 20 µm), and immunofluorescence (bottom, scale bar, 20 µm) in IGF2BP2 KD LX-2 cells, and shNC-transfected LX-2 cells treated with TGF-β1 as a positive control. Representative images (G) and bar plot (H) of oil red O staining in IGF2BP2 KD LX-2 cells treated or untreated with TGF-β1 for 24 h (scale bar, 20 µm). Representative images (I) and bar graphs (J) of oil red O staining of LX-2 cells pretreated with JX5 (blank, 10 µM, 30 µM) for 8 h, followed by treatment or untreatment with TGF-β1 for 24 h (scale bar, 20 µm). K ACTA2 and COL1α1 mRNA expression in LX-2 cells pretreated with JX5 (blank, 10 µM, 30 µM) for 8 h, followed by treatment with TGF-β1 for different time points (0, 6, 12 h). L ACTA2 mRNA expression in LX-2 cells cultured with 10% FBS treated with JX5 (blank, 10, 30 µM) for 1 h, and LX-2 cells cultured with 2% FBS as control. n.s., not significant; *P < 0.05, **P < 0.01, ***P < 0.001, ****P < 0.0001.
Fig. 4
Fig. 4. IGF2BP2 is involved in the ECM pathway and glycolytic metabolic processes.
A Performing GSEA enrichment analysis in IGF2BP2 KD LX-2 cells to demonstrate enrichment signaling pathways or biological processes involved in IGF2BP2. B Bubble diagram showing KEGG enrichment analysis in IGF2BP2 KD LX-2 cells. The y-axis is for KEGG terms. The size and color of the bubbles represent the number and significance of genes associated with the term, respectively. C Heatmap representation of glycolysis/gluconeogenesis processes-related genes differentially expressed in IGF2BP2 KD LX-2 cells. The color bar indicates the value of the Z-transformed expression.
Fig. 5
Fig. 5. IGF2BP2 regulates glycolytic metabolism by increasing ALDOA expression.
A Venn diagram showing screening strategies for candidate downstream targets of IGF2BP2. B Bubble diagram showing Kyoto Encyclopedia of Genes and Genomes (KEGG) enrichment analysis of candidate target genes screened by (A). The y-axis is for KEGG terms. The size and color of the bubbles represent the number and significance of genes associated with the term, respectively. C Expression of initially selected downstream targets (PGK1, LDHB, ENO1, and ALDOA) of IGF2BP2 in the GSE90639 dataset. D Expression of selected downstream targets (PGK1, LDHB, ENO1, and ALDOA) detected in RNA-seq and qRT-PCR, and metabolic schematic of selected targets in the glycolytic pathway. E RIP assay using IGF2BP2 antibody in IGF2BP2 KD or control LX-2 cells. F RIP assay using m6A antibody in LX-2 cells. G ALDOA mRNA half-life in IGF2BP2 KD or control LX-2 cells. H Interactions between IGF2BP2 and ALDOA were predicted based on POSTAR3 (http://postar.ncrnalab.org). I High-confidence m6A modification sites on ALDOA were predicted from SRAMP (www.cuilab.cn/). J ALDOA expression in CCl4-induced liver fibrosis and normal control from GSE55747. K ALDOA expression in liver cirrhosis and normal control from GSE6764. L, M Correlation analysis of IGF2BP2 expression with ALDOA expression in cirrhotic samples from GSE25097 (n = 40) and GSE15654 (n = 216). N-R Measurement of lactate levels (N), α-SMA expression, and migration capacity (upper of Fig. 5P, scale bar, 50 µm) in LX-2 cells after co-transfection of ALDOA overexpression vector (OE-ALDOA) or control vector (Vector) in IGF2BP2 KD (shIGF2BP2) and control (shNC) cells. α-SMA expression was measured using immunoblotting (O) and immunofluorescence (bottom of Fig. 5P, scale bar, 20 µm). There are bar graphs showing the migration capacity (Q) and the fluorescence intensity of α-SMA expression (R) in LX-2 cells. n.s. not significant; *P < 0.05, **P < 0.01, ***P < 0.001, ****P < 0.0001.
Fig. 6
Fig. 6. Histone lactylation is essential in HSCs activation.
A Global lactylation levels in liver sections from CCl4-induced liver fibrosis mice and healthy mice were visualized by immunofluorescence (scale bar, 100 µm). B Immunoblotting showing global lactylation and H3K18la levels after TGF-β1-induced LX-2 cells for different times (0, 6, 12, 24 h). C Immunoblotting shows global lactylation and H3K18la levels in LX-2 cells with IGF2BP2 KD. D Immunoblotting shows global lactylation and H3K18la levels in LX-2 cells treated with different concentrations of lactate, 2-DG, or rotenone for 24 h. Representative images (E) and bar graphs (F) showing lipid droplets, migration capacity, cell proliferation, and α-SMA expression after treatment of LX-2 cells with TGF-β1, 2-DG, or lactate, as detected by oil red O staining, cell migration assays, EdU cell proliferation assays, and immunofluorescence, respectively. G Immunoblotting showed expression of α-SMA at 10 mmol/L exogenous lactate supplementation for different times (6 h, 12 h, 24 h). H qRT-PCR verified the expression of ACTA2 at 1 h of 2-DG, lactate treatment. Representative images (upper of I, scale bar, 50 µm) and bar plot (J) showing cell migration in LX-2 cells silenced for LDHA and LDHB. Representative images showing α-SMA expression (bottom of Fig. 6I, scale bar, 20 µm) in LX-2 cells silenced for LDHA and LDHB. K Immunoblotting shows α-SMA expression in LX-2 cells silenced for LDHA and LDHB. n.s. not significant; *P < 0.05, **P < 0.01, ****P < 0.0001.
Fig. 7
Fig. 7. Inhibition of histone lactylation ameliorates liver fibrosis in vivo.
A Schematic illustration of the experimental design of 2-DG (1000 mg/kg) for the treatment of CCl4-induced liver fibrosis in mice. B Lactate levels in the serum of mice treated according to (A) (n = 6). Representative images (C) and bar plot (D, E) of H&E staining (upper), Masson’s trichrome staining (middle), and sirius red staining (bottom) in mouse liver sections treated according to (A) (n = 6, scale bar, 100 µm). Representative images (F) and bar plot (G) of α-SMA expression (upper, n = 3, scale bar, 100 µm) visualized by immunofluorescence in mouse liver sections treated according to (A). Serum levels of ALT (H) and AST (I) in mice treated according to (A). **P < 0.01, ***P < 0.001, ****P < 0.0001.
Fig. 8
Fig. 8. Schematic model of the mechanism of IGF2BP2 and histone lactylation in liver fibrosis.
IGF2BP2 is highly activated in fibrotic livers of mice. Mechanistically, IGF2BP2 enhances the stability of the m6A-modified transcript ALDOA in the glycolytic metabolic pathway, which is crucial for HSCs activation. In addition, lactate produced by activated HSCs via the glycolytic pathway serves as a substrate for lactylation, which plays an essential role in the activation of HSCs. Created with BioRender.com.

Similar articles

Cited by

References

    1. Hammerich L, Tacke F. Hepatic inflammatory responses in liver fibrosis. Nat Rev Gastroenterol Hepatol. 2023;20:633–46. doi: 10.1038/s41575-023-00807-x. - DOI - PubMed
    1. Sun M, Kisseleva T. Reversibility of liver fibrosis. Clin Res Hepatol Gastroenterol. 2015;39:S60–3. doi: 10.1016/j.clinre.2015.06.015. - DOI - PMC - PubMed
    1. Kisseleva T, Brenner D. Molecular and cellular mechanisms of liver fibrosis and its regression. Nat Rev Gastroenterol Hepatol. 2021;18:151–66. doi: 10.1038/s41575-020-00372-7. - DOI - PubMed
    1. Trivedi P, Wang S, Friedman SL. The power of plasticity-metabolic regulation of hepatic stellate cells. Cell Metab. 2021;33:242–57. doi: 10.1016/j.cmet.2020.10.026. - DOI - PMC - PubMed
    1. Chang ML, Yang SS. Metabolic signature of hepatic fibrosis: from individual pathways to systems biology. Cells. 2019;8:1423. doi: 10.3390/cells8111423. - DOI - PMC - PubMed

Publication types