. 2024 Mar 5;15(1):1991.
doi: 10.1038/s41467-024-46057-6.

Neuronal miR-9 promotes HSV-1 epigenetic silencing and latency by repressing Oct-1 and Onecut family genes

Affiliations

Neuronal miR-9 promotes HSV-1 epigenetic silencing and latency by repressing Oct-1 and Onecut family genes

Yue Deng et al. Nat Commun. .

Abstract

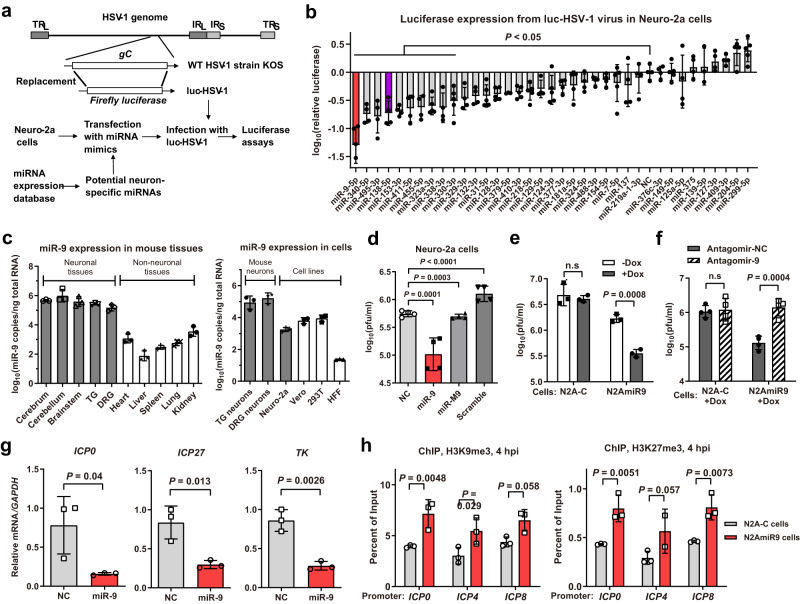
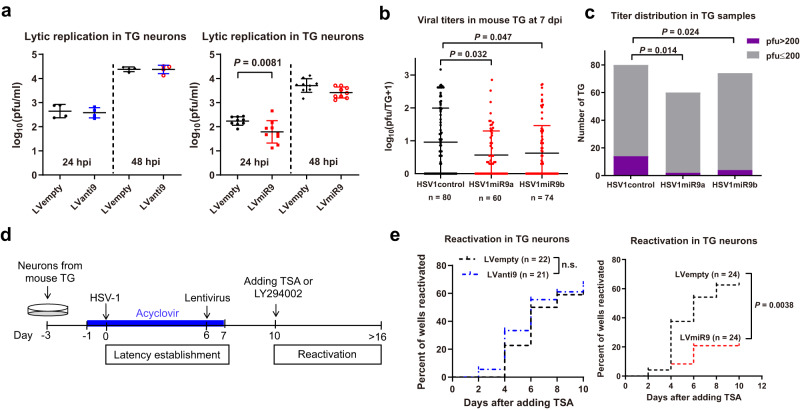
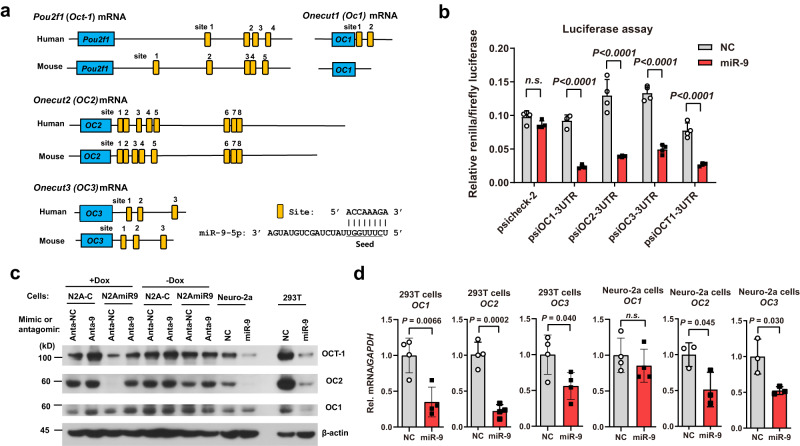
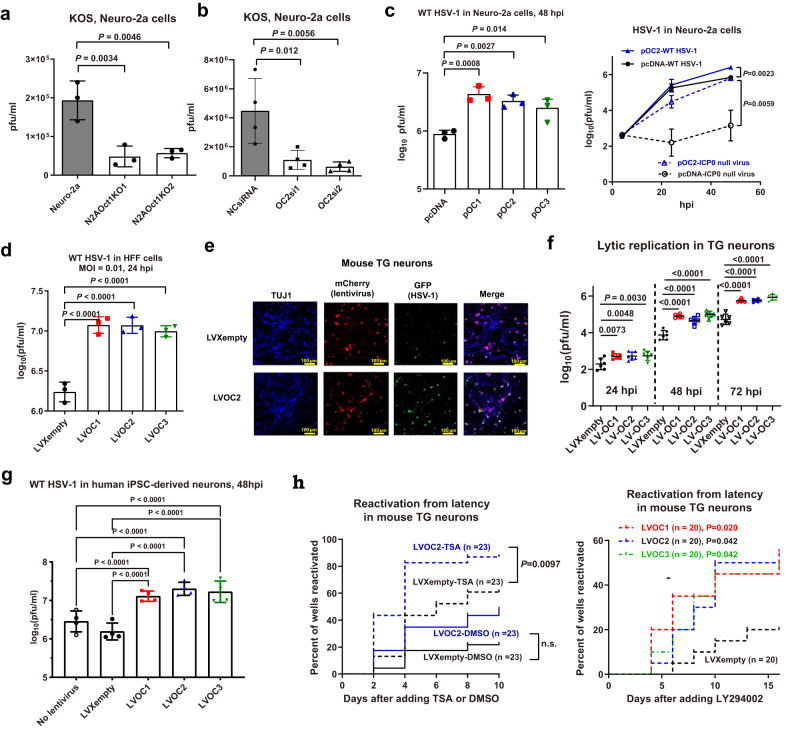
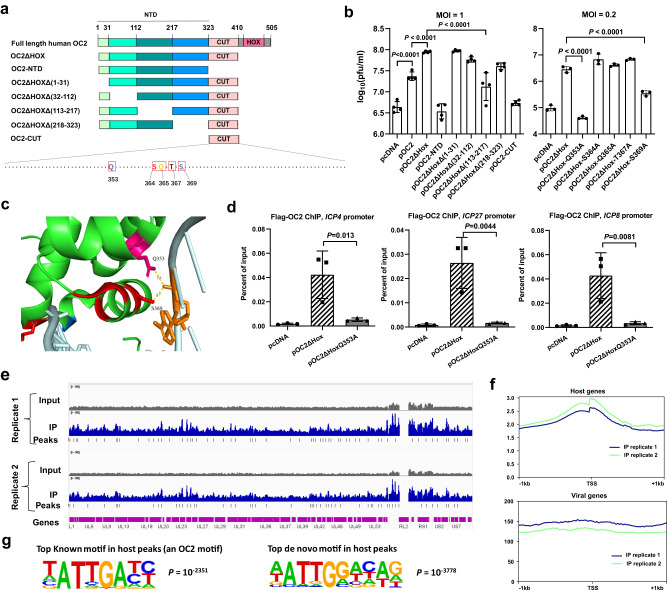
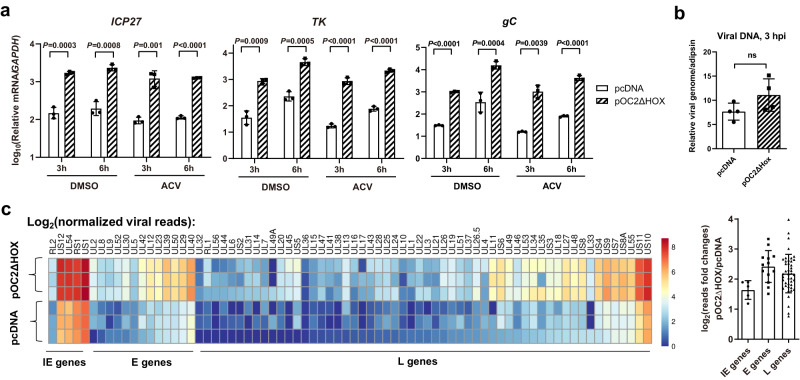
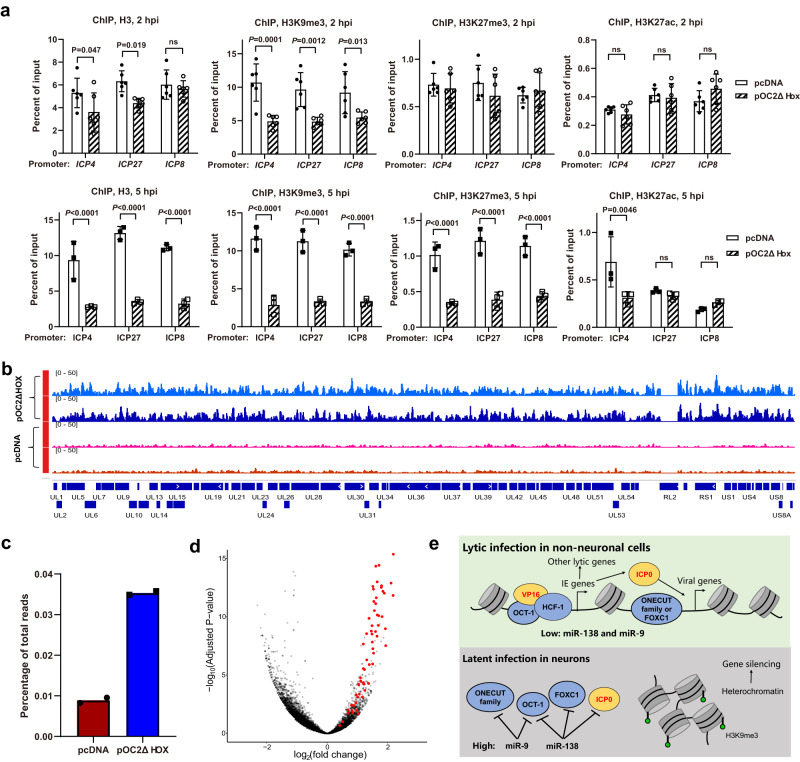
Herpes simplex virus 1 (HSV-1) latent infection entails repression of viral lytic genes in neurons. By functional screening using luciferase-expressing HSV-1, we identify ten neuron-specific microRNAs potentially repressing HSV-1 neuronal replication. Transfection of miR-9, the most active candidate from the screen, decreases HSV-1 replication and gene expression in Neuro-2a cells. Ectopic expression of miR-9 from lentivirus or recombinant HSV-1 suppresses HSV-1 replication in male primary mouse neurons in culture and mouse trigeminal ganglia in vivo, and reactivation from latency in the primary neurons. Target prediction and validation identify transcription factors Oct-1, a known co-activator of HSV transcription, and all three Onecut family members as miR-9 targets. Knockdown of ONECUT2 decreases HSV-1 yields in Neuro-2a cells. Overexpression of each ONECUT protein increases HSV-1 replication in Neuro-2a cells, human induced pluripotent stem cell-derived neurons, and primary mouse neurons, and accelerates reactivation from latency in the mouse neurons. Mutagenesis, ChIP-seq, RNA-seq, ChIP-qPCR and ATAC-seq results suggest that ONECUT2 can nonspecifically bind to viral genes via its CUT domain, globally stimulate viral gene transcription, reduce viral heterochromatin and enhance the accessibility of viral chromatin. Thus, neuronal miR-9 promotes viral epigenetic silencing and latency by targeting multiple host transcription factors important for lytic gene activation.


Conflict of interest statement

The authors declare no competing interests.

Figures

Fig. 1
Fig. 1. Neuron-specific miR-9 represses HSV-1 replication and gene expression in Neuro-2a cells.
a Diagram of luc-HSV-1 virus and the procedure of screening for neuron-specific miRNAs regulating HSV-1 infection. b Neuro-2a cells in 96-well plates were transfected with 20 nM miRNA mimic for 24 h, then infected with luc-HSV-1 (MOI = 0.3) for 72 h before luciferase assays. The adjusted P values: miR-9-5p, <0.0001; miR-340-5p, 0.0002; miR-495-3p, <0.0001; miR-138-5p, 0.0003; miR-153-3p, 0.0007; miR-411-5p, 0.0021; miR-455-5p, 0.0035; miR-323a-3p, 0.0029; miR-338-3p, 0.0030; miR-330-3p, 0.019. c RT-qPCR analysis of miR-9 in the indicated tissues (left) or cells (right). d Neuro-2a cells were transfected with 20 nM miRNA mimic for 24 h, then infected with KOS (MOI = 0.3) for 48 h before viral titration. e The indicated cells were treated or not treated with 1 μg/ml Dox for 48 h, then infected with KOS (MOI = 0.3) for 48 before virus titration. f The indicated cells maintained in 1 μg/ml Dox were transfected with 80 nM antagomir for 24 h, then infected with KOS (MOI = 0.3) for 48 h before viral titration. g Neuro-2a cells were transfected with 20 nM miRNA mimic, then infected with KOS (MOI = 1) for 4 h before RT-qPCR analysis of the indicated viral transcripts. h N2A-C or N2AmiR9 cells maintained in 1 μg/ml Dox were infected with HSV-1 (MOI = 1) for 4 h before ChIP-qPCR analysis of the enrichment of H3K9me3 (left) or H3K27me3 (right) at the indicated promoters. NC, nonspecific control. n = 3 (c, e, g, h) or 4 (b, d, f) biologically independent samples. Data were analyzed by one-way ANOVA with Dunnett’s multiple comparisons tests (b, d), two-way ANOVA with Sidak’s multiple comparisons tests (e, f, h) or two-sided unpaired t tests (g) and are presented as the mean ± s.d. Source data are provided as a Source Data file.
Fig. 2
Fig. 2. miR-9 suppresses HSV-1 replication and reactivation in mouse TG or TG neurons.
a Neurons isolated from mouse TG were transduced with the indicated lentiviruses and then infected with KOS (MOI = 0.1). At the indicated times, supernatants were collected for virus titration. b Mice were inoculated on the cornea with 2 × 105 pfu/eye. TG were harvested at 7 dpi for viral titration. Each dot represents one TG and the n numbers represent the numbers of TG collected. c The numbers of TG with pfu >200 or ≤200 were shown for each virus. d Diagram of neuronal culture models of HSV-1 latency and reactivation. e Using the model depicted in panel d, after the addition of 0.2 μM TSA, supernatants were collected every two days for assays of infectious virus positivity. n.s., non-significant. a n = 4 (left) or 9 (right) biologically independent samples. Sample sizes for other panels are labeled on the figure. Data were analyzed by one-way ANOVA with Dunnett’s multiple comparisons tests (b), two-way ANOVA with Sidak’s multiple comparisons tests (a), two-sided Fisher’s exact tests (c) or Log-rank (Mantel-Cox) tests (e) and are presented as the mean ± s.d. Source data are provided as a Source Data file.
Fig. 3
Fig. 3. miR-9 targets Oct-1 and OC family transcripts.
a Diagram of miR-9 binding sites in the indicated human and mouse genes. Horizontal lines represent mRNAs. Blue boxes with gene names inside represent open reading frames. Small yellow boxes represent 8mer sites in the 3’ UTRs. Base pairing between an 8mer site and miR-9 is shown to the bottom right. b 293T cells were co-transfected with 20 nM miRNA mimic and 20 ng/ml plasmid for 48 h before dual luciferase assays. c The indicated cells were transfected with 40 nM of the indicated mimics or 80 nM of the indicated antagomirs for 48 h before Western blot analysis of the indicated proteins in the indicated cell lines. This experiment was repeated once with similar results. Anta-NC, non-specific control antagomir. Anta-9, miR-9 antagomir. d Neuro-2a or 293T cells were transfected with 80 nM mimic for 48 h before RT-qPCR analysis of human (for 293T cells) or mouse (for Neuro-2a cells) OC1, OC2 or OC3 mRNA. (b, d) n = 4 biologically independent samples. Data were analyzed by two-way ANOVA with Sidak’s multiple comparisons tests (b) or two-sided unpaired t tests (d) and are presented as the mean ± s.d. Source data are provided as a Source Data file.
Fig. 4
Fig. 4. OCT-1 and OC proteins promote HSV-1 replication and/or reactivation.
a The indicated cells were infected with KOS (MOI = 0.3) for 48 h before virus titration. b Neuro-2a cells were transfected with 80 nM siRNA for 40 h, then infected with KOS (MOI = 0.2) for 48 h before virus titration. c Neuro-2a cells were transfected with 200 ng/ml plasmid for 24 h, then infected with WT KOS or ICP0-null virus (MOI = 0.2) for 48 h (left) or the indicated times (right) before virus titration. d HFF cells were transduced with lentivirus for 72 h, then infected with KOS (MOI = 0.05) for 48 h before virus titration. e Primary TG neurons were transduced with lentivirus for 4 days, then infected with 64-GFP (MOI = 0.1) for 48 h before immunofluorescence analysis of TUJ1 and visualization of GFP (green) and mCherry (red) expression. The experiment was repeated once with similar results. f Primary TG neurons were transduced with lentivirus for 4 days, then infected with KOS (MOI = 0.1) for the indicated times before titration of the virus in the supernatants. g Differentiated human neurons were transduced with lentivirus for 10 days, then infected with KOS (MOI = 1) for 48 hpi before virus titration. The data are from 4 biologically independent experiments with 4 replicates per experiment. Each point represents the mean from one experiment. h TG neurons were transduced with lentivirus and supernatants were assayed for infectious virus positivity at the indicated days after addition of DMSO (left), TSA (0.2 μM) (left) or LY294002 (20 μM) (right). n = 3 (a, c, d), 4 (b), 6 (f) or 16 (g) biologically independent samples. Sample sizes for (h) are labeled on the figure. Data were analyzed by one-way ANOVA with Dunnett’s multiple comparisons tests (a, b, d, f and left panel of c), two-sided unpaired t tests (right panel of c), two-way ANOVA, matched by experimental batch, with Šídák’s multiple comparisons tests (g) or Log-rank (Mantel-Cox) tests (h) and are presented as the mean ± s.d. Source data are provided as a Source Data file.
Fig. 5
Fig. 5. OC2 binds to HSV-1 DNA to stimulate viral gene transcription.
a Schematic of OC2 and its truncated mutants. Amino acid positions are labeled at the top. Expanded below are CUT domain residues with the mutated ones in boxes. b Neuro-2a cells were transfected with 200 ng/ml plasmid for 24 h, then infected with ICP0-null virus for 48 h before virus titration. c Crystal structure of OC1 DBDs complexed with DNA adapted by using the PyMOL software (PDB code 2D5V). The dotted lines represent hydrogen bonds whose distances are labeled. d Neuro-2a cells were transfected with 400 ng/μl plasmid for 40 h, then infected with ICP0-null virus (MOI = 3) for 5 h before ChIP-qPCR analysis of the enrichment of transfected Flag-tagged proteins at the indicated promoters using a Flag antibody. e After ChIP performed as in panel d, DNA samples were sequenced. In gray and blue are coverage plots along the HSV-1 genome (with the terminal repeat sequences deleted) for input and immunoprecipitated DNA samples, respectively. Small vertical sticks represent identified peaks in the immunoprecipitated samples. f ChIP-seq signal around transcription start sites (TSS) for host (upper) or viral (lower) genes. g The top-ranked known (left) or de novo (right) motifs identified in host peaks with the P values displayed. n = 2 (eg), 3 (d, right panel of b) or 4 (left panel of b) biologically independent samples. Data were analyzed by one-way ANOVA with Dunnett’s multiple comparisons tests (b, d) and are presented as the mean ± s.d. Source data are provided as a Source Data file.
Fig. 6
Fig. 6. OC2 can globally stimulate HSV-1 gene transcription.
a Neuro-2a cells were transfected with 200 ng/ml plasmid for 42 h, then infected with ICP0-null virus (MOI = 1) in media containing 100 μM ACV or DMSO for 3 or 6 h before RT-qPCR analysis. b Neuro-2a cells were transfected with 200 ng/ml plasmid, then infected with ICP0-null virus (MOI = 1) for 3 h before viral DNA quantification. c Neuro-2a cells were transfected with 200 ng/ml plasmid for 42 h, then infected with ICP0-null virus (MOI = 2) for 4 h before RNA-seq analysis. Normalized reads for each viral transcripts were log2 transformed before illustration by the Heatmap. The right panel shows the fold changes for genes of different kinetic classes with each point representing a viral transcript. n = 3 (a, c) or 4 (b) biologically independent samples. Data were analyzed by two-way ANOVA with Sidak’s multiple comparisons tests (a) or two-sided unpaired t tests (b) and are presented as the mean ± s.d. Source data are provided as a Source Data file.
Fig. 7
Fig. 7. OC2 can regulate HSV-1 chromatin.
a Neuro-2a cells were transfected with 600 ng/μl plasmid for 43 h, then infected with ICP0-null virus (MOI = 2) for 2 or 5 h before ChIP-qPCR analysis of the enrichment of histone H3 and its modifications on the indicated promoters. b Neuro-2a cells were transfected with 200 ng/ul of pcDNA or pOC2ΔHOX for 40 h, then infected with ICP0-null virus (MOI = 1) for 2 h before ATAC-seq analysis. Coverage plots for reads aligned to the entire ICP0-null virus genome are shown. c Percentages of total viral reads within total reads in the ATAC-seq data. d Volcano plot for the differences between pOC2ΔHOX and pcDNA transfected cells in reads aligned to viral (red) or host (black) promoters. Each dot represents one gene promoter. e Model of regulation of the lytic/latent balance by host neuronal miRNAs and their targets. n = 2 (b, c, d), 3 (lower panels of a) or 6 (upper panels of a) biologically independent samples. Data were analyzed by two-way ANOVA with Sidak’s multiple comparisons tests (a), two-sided unpaired t tests (c) or two-sided Fisher’s t tests adjusted by false discovery rates to correct for multiple testing (d). The data are presented as the mean ± s.d. Source data are provided as a Source Data file.

Similar articles

Cited by

References

    1. Knipe, D. M., Heldwein, E. F., Mohr, I. J. & Sodroski, C. N. in Fields Virology Seventh Edition (eds Howley, P. M. et al.) 235–296 (Lippincott Williams & Wilkins, 2021).
    1. Knipe DM, Cliffe A. Chromatin control of herpes simplex virus lytic and latent infection. Nat. Rev. Microbiol. 2008;6:211–221. doi: 10.1038/nrmicro1794. - DOI - PubMed
    1. Schang LM, Hu M, Cortes EF, Sun K. Chromatin-mediated epigenetic regulation of HSV-1 transcription as a potential target in antiviral therapy. Antivir. Res. 2021;192:105103. doi: 10.1016/j.antiviral.2021.105103. - DOI - PMC - PubMed
    1. Herrera FJ, Triezenberg SJ. VP16-dependent association of chromatin-modifying coactivators and underrepresentation of histones at immediate-early gene promoters during herpes simplex virus infection. J. Virol. 2004;78:9689–9696. doi: 10.1128/JVI.78.18.9689-9696.2004. - DOI - PMC - PubMed
    1. Hou F, et al. Interactome and ubiquitinome analyses identify functional targets of herpes simplex virus 1 infected cell protein 0. Front. Microbiol. 2022;13:856471. doi: 10.3389/fmicb.2022.856471. - DOI - PMC - PubMed