. 2024 Mar 5;12(1):16.
doi: 10.1038/s41413-024-00316-w.

Brain regulates weight bearing bone through PGE2 skeletal interoception: implication of ankle osteoarthritis and pain

Affiliations

Brain regulates weight bearing bone through PGE2 skeletal interoception: implication of ankle osteoarthritis and pain

Feng Gao et al. Bone Res. .

Abstract

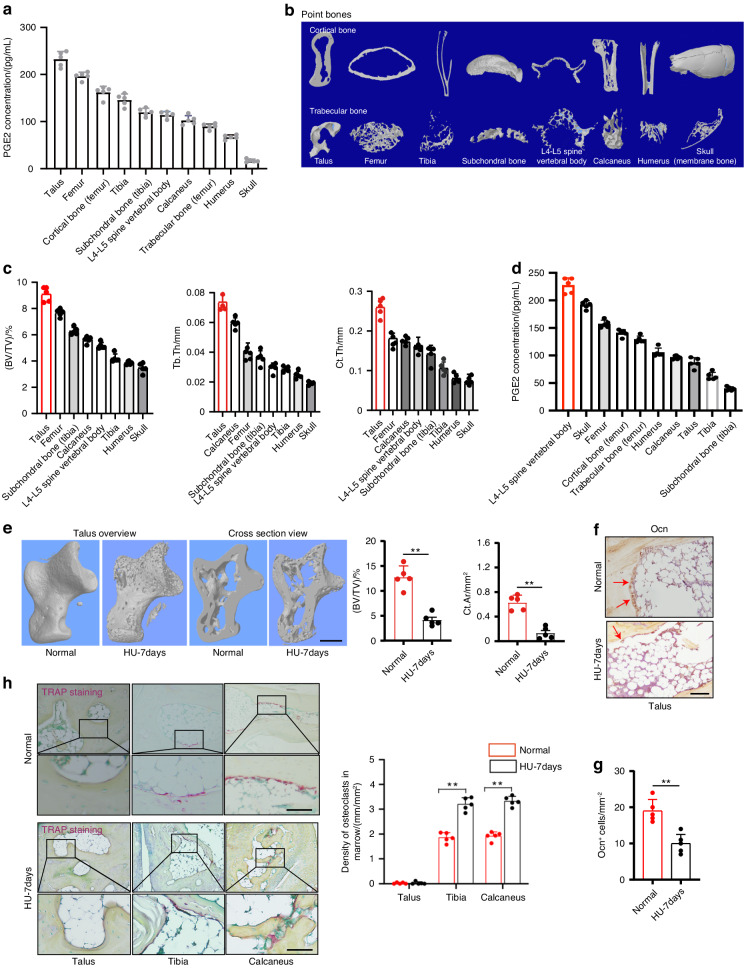
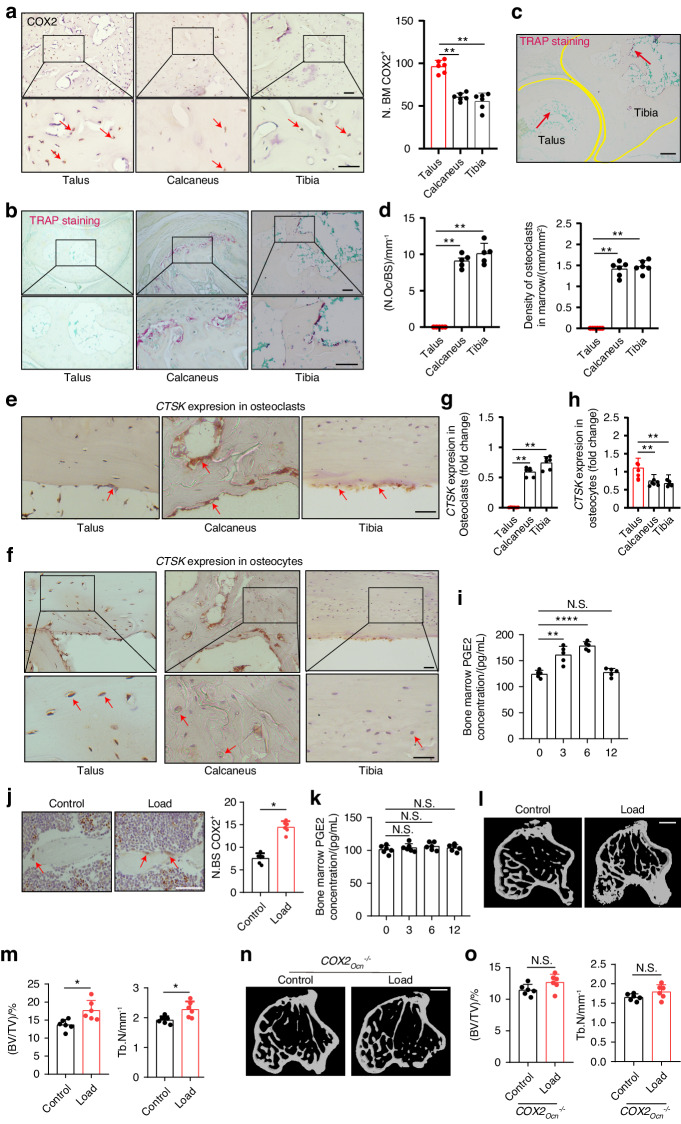
Bone is a mechanosensitive tissue and undergoes constant remodeling to adapt to the mechanical loading environment. However, it is unclear whether the signals of bone cells in response to mechanical stress are processed and interpreted in the brain. In this study, we found that the hypothalamus of the brain regulates bone remodeling and structure by perceiving bone prostaglandin E2 (PGE2) concentration in response to mechanical loading. Bone PGE2 levels are in proportion to their weight bearing. When weight bearing changes in the tail-suspension mice, the PGE2 concentrations in bones change in line with their weight bearing changes. Deletion of cyclooxygenase-2 (COX2) in the osteoblast lineage cells or knockout of receptor 4 (EP4) in sensory nerve blunts bone formation in response to mechanical loading. Moreover, knockout of TrkA in sensory nerve also significantly reduces mechanical load-induced bone formation. Moreover, mechanical loading induces cAMP-response element binding protein (CREB) phosphorylation in the hypothalamic arcuate nucleus (ARC) to inhibit sympathetic tyrosine hydroxylase (TH) expression in the paraventricular nucleus (PVN) for osteogenesis. Finally, we show that elevated PGE2 is associated with ankle osteoarthritis (AOA) and pain. Together, our data demonstrate that in response to mechanical loading, skeletal interoception occurs in the form of hypothalamic processing of PGE2-driven peripheral signaling to maintain physiologic bone homeostasis, while chronically elevated PGE2 can be sensed as pain during AOA and implication of potential treatment.


Conflict of interest statement

The authors declare no competing interests.

Figures

Fig. 1
Fig. 1
PGE2 concentration in bone is positively correlated with mechanical load. a Enzyme-linked immunosorbent assay (ELISA) analysis of PGE2 level in bone at 10 different points of 12-week-old C57BL/6 mice. b Representative μCT images of 8 different point bones from 12-week-old C57BL/6 mice. c Quantitative analysis of trabecular bone fraction (BV/TV), trabecular bone thickness (Tb. Th) and cortical bone thickness (Ct. Th). d ELISA analysis of PGE2 level in bone at 10 different points of 13-week-old C57BL/6 mice with HU for 7 days. e Representative μCT images and quantitative analysis of trabecular bone fraction (BV/TV), cortical bone area (Ct. Ar) of talus from normal 13-week-old C57BL/6 mice or with HU for 7 days. Scale bars, 50 μm. Representative images of immunostaining of osteocalcin (Ocn) positive cells f and analysis of Ocn+ cells in the subchondral bone of talus from normal 13-week-old C57BL/6 mice or with HU for 7 days g. Scale bars, 50 μm. h Representative images of immunostaining and quantitative analysis of the density of TRAP+ cells in the subchondral bone of talus, tibia, and calcaneus from normal 13-week-old C57BL/6 mice or with HU for 7 days. Scale bars, 50 μm. n ≥ 5 per group. *P < 0.05, **P < 0.01, and N.S. indicates not significant. Statistical significance was determined by Student’s t-test
Fig. 2
Fig. 2
PGE2 mediates mechanical load-induced osteoblastic bone formation. a Representative images of immunostaining and quantitative analysis of the number of COX2+ cells (brown) in the subchondral bone marrow (N.BM/COX2+) of talus, calcaneus, and tibia from 12-week-old C57BL/6 mice. Scale bars, 50 μm. Representative images of immunostaining TRAP+ cells per bone surface (N.Oc/BS) on the trabecular bone surface b and TRAP+ cells in the bone marrow c and quantitative analysis of TRAP+ cells d in talus, calcaneus, and tibia from 12-week-old C57BL/6 mice. Scale bars, 50 μm. Representative images of immunostaining e and quantitative analysis g of CTSK expression in osteoclasts at steady state of the subchondral bone of talus, calcaneus, and tibia from 12-week-old C57BL/6 mice. Scale bars, 50 μm. Representative images of immunostaining f and quantitative analysis h of CTSK expression in osteocytes at steady state of the subchondral bone of talus, calcaneus, and tibia from 12-week-old C57BL/6 mice. Scale bars, 50 μm. i ELISA analysis of PGE2 level in tibiae bone marrow at different time points after axial compression loading on the tibiae of WT mice. j Immunohistochemical staining and quantification of COX2+ cells (brown) on the trabecular tibial surface in WT mice. Scale bar, 50 µm. k ELISA analysis of PGE2 level in tibiae bone marrow at different time points after axial compression loading on the tibiae 100 cycles at 2 Hz of COX2Ocn−/− mice. Representative µCT images l and quantitative analysis m of trabecular bone fraction (BV/TV) and trabecular number (Tb.N) of tibial bone of WT mice loaded for one month or non‐loaded tibiae. Scale bar, 500 µm. Representative µCT images n and quantitative analysis o of trabecular bone fraction (BV/TV) and trabecular number (Tb.N) of tibial bone of COX2Ocn−/− mice loaded for one month or non‐loaded tibiae. Scale bar, 500 µm. n ≥ 5 per group. *P < 0.05, **P < 0.01, and N.S. indicates not significant. Statistical significance was determined by Student’s t-test
Fig. 3
Fig. 3
Deletion of TrkA in sensory nerve reduces mechanical load-induced bone formation. a Representative images of immunofluorescence staining and quantitative analysis of the CGRP+ sensory nerves (red) in the subchondral bone of talus from 12-week-old TrkAwt and TrkAAvil−/ mice. Scale bar, 100 μm. b Representative images of immunostaining of TRAP+ cells in the subchondral bone of talus from 12-week-old TrkAwt and TrkAAvil−/− mice. Scale bar, 100 μm. Representative μCT images and quantitative analysis of trabecular bone fraction (BV/TV) c, trabecular bone thickness (Tb. Th) and cortical bone thickness (Ct. Th) d of talus from 12-week-old TrkAwt and TrkAAvil−/− mice. Scale bar, 100 μm. e Representative images of immunostaining of Ocn and analysis of Ocn+ cells in the subchondral bone of talus from 12-week-old TrkAwt and TrkAAvil−/− mice. Scale bar, 100 μm. ELISA analysis of Ocn f and carboxy-terminal collagen crosslinks (CTX) level of the serum g from 12-week-old TrkAwt and TrkAAvil−/− mice. TrkAwt and TrkAAvil−/− mice underwent one month of axial compression loading of tibiae. Non‐loaded tibiae were used as controls. h Representative µCT images and quantitative analysis of trabecular bone fraction (BV/TV) of tibial bone. Scale bar, 500 µm. i Representative images of immunofluorescence staining and quantitative analysis of Ocn+ cells (green) on trabecular bone surface of tibiae. Scale bar, 50 μm. n ≥ 5 per group. *P < 0.05, **P < 0.01, and N.S. indicates not significant. Statistical significance was determined by Student’s t-test
Fig. 4
Fig. 4
Mechanical load induces osteogenesis through PGE2/EP4 interoceptive signaling. EP4wt and EP4Avil−/− mice underwent one month of axial compression loading of tibiae. Non‐loaded tibiae were used as controls. a Representative µCT images and quantitative analysis of trabecular bone fraction (BV/TV) and trabecular number (Tb.N) of tibial bone. Scale bar, 500 µm. b Representative images of immunofluorescence staining of Ocn and quantitative analysis of Ocn+ cells (green) on trabecular bone surface of tibiae. Scale bar, 50 μm. c Representative images of immunofluorescence staining and quantitative analysis of the pCREB+ cells in the ARC of the hypothalamus of WT mice underwent three consecutive days of axial compression loading of tibiae or control sham load. Scale bar, 50 μm. d Representative images of immunofluorescence staining and quantitative analysis of the pCREB+ cells in the ARC of the hypothalamus of COX2wt and COX2Ocn−/− mice underwent three consecutive days of axial compression loading of tibiae. Scale bar, 50 μm. e Representative images of immunofluorescence staining and quantitative analysis of the pCREB+ cells in the ARC of the hypothalamus of EP4wt and EP4Avil−/− mice underwent three consecutive days of axial compression loading of tibiae. Scale bar, 50 μm. f Representative images of immunofluorescence staining and quantitative analysis of the TH+ cells in the PVN of the hypothalamus of WT mice underwent three consecutive days of axial compression loading of tibiae or control sham load. Scale bar, 50 μm. g Representative images of immunofluorescence staining and quantitative analysis of the TH+ cells in the PVN of the hypothalamus of EP4wt and EP4Avil−/− mice underwent three consecutive days of axial compression loading of tibiae. Scale bar, 50 μm. n ≥ 5 per group. *P < 0.05, **P < 0.01, and N.S. indicates not significant. Statistical significance was determined by Student’s t-test
Fig. 5
Fig. 5
Mechanical loading regulates sympathetic activity through hypothalamus AgRP neurons. a Diagram of the AAV9-hSyn-GFP injection sites in the ARC area of the WT mice. b Representative images of GFP+ neurons in the PVN of the hypothalamus AAV9-hSyn-GFP injection in ARC. c Diagram of the CTB injection site in the PVN area of the WT mice. d Representative images of GTB+ neurons in the ARC of the hypothalamus after CTB injection in PVN. Representative images of immunofluorescence staining e and quantitative analysis of the pCREB (red) and CTB (green) f in the ARC of the hypothalamus of WT mice underwent three consecutive days of axial compression loading of tibiae or control sham load after CTB injection in the PVN for 5 days. Scale bar, 50 μm. AgRP-Ires-Cre mice injected with pAAV-hSyn-DIO-hM4d(Gi)-mCherry in one side of the ARC (right) and control AAV in the other side (left). Mice injected saline or CNO (0.3 mg/kg of body weight, i.p.) before loading. Representative images of immunofluorescence staining g and quantitative analysis h of the pCREB (green) and mCherry (red) in the ARC of hypothalamus of AgRP-Ires-Cre mice underwent three consecutive days of axial compression loading of tibiae or control sham load. Scale bar, 50 μm. Representative images of immunofluorescence staining i and quantitative analysis of the TH (green) j in the PVN of hypothalamus of AgRP-Ires-Cre mice that underwent three consecutive days of axial compression loading of tibiae. Scale bar, 50 μm. n ≥ 5 per group. *P < 0.05, **P < 0.01, and N.S. indicates not significant. Statistical significance was determined by Student’s t-test
Fig. 6
Fig. 6
Mechanical load suppresses sympathetic activity through the ARC → PVN circuit via PGE2/EP4 interoceptive pathway. a RT-PCR quantitative analysis of Crem gene expression in the PVN area of the hypothalamus of WT mice underwent three consecutive days of axial compression loading of the tibia or control sham load. b Western blot analysis of CREMτ and CREMα/β/γ isoforms in the PVN area of the hypothalamus of WT mice underwent three consecutive days of axial compression loading of tibiae (n = 5) or control sham load (n = 3). c, d Quantitative analysis of CREMτ and CREMα/β/γ from Western blot in b. e Diagram of potential CREM binding site on the TH gene promoter. f ChIP analysis of CREM on TH gene promoter in the PVN area of WT mice underwent three consecutive days of axial compression loading of the tibia. g Representative images of immunofluorescence staining and quantitative analysis of the CREM+ cells in the PVN of the hypothalamus of EP4wt and EP4Avil−/− mice underwent three consecutive days of axial compression loading of tibiae or control sham load. Scale bar, 50 μm. h Representative images of immunofluorescence staining and quantitative analysis of the pSTAT3+ cells in the PVN of the hypothalamus of EP4wt and EP4Avil−/− mice underwent three consecutive days of axial compression loading of tibiae or control sham load. Scale bar, 50 μm. n ≥ 5 per group. *P < 0.05, **P < 0.01, and N.S. indicates not significant. Statistical significance was determined by Student’s t-test for A. Statistical significance was determined by two-way analysis of variance for e, f. i ChIP analysis of pSTAT3 on CREM gene promoter in the PVN area of WT mice underwent three consecutive days of axial compression loading of tibiae. j Diagram of the mechanism of mechanical load up-regulated CREM gene expression in the PVN area
Fig. 7
Fig. 7
Alteration in PGE2 level leads to Ankle Osteoarthritis and pain through sensory nerve.Representative μCT images a and quantitative analysis of trabecular bone fraction (BV/TV) and trabecular bone thickness (Tb. Th) of talus b from 20-week-old C57BL/6 mice with sham or AOA surgery for 8 weeks. Scale bars, 50 μm. c Representative images of Safranin Orange and fast green staining in the subchondral bone of talus from 20-week-old C57BL/6 mice with sham or AOA surgery for 8 weeks (AOA 8W). Scale bars, 50 μm. Representative images of catwalk d and analysis e of ipsilateral intensity and contact area of right hind paw of 20-week-old C57BL/6 mice with sham or AOA 8W. f Representative images of immunostaining and quantitative analysis of the COX2+ (brown) cells in the subchondral bone of talus of 20-week-old C57BL/6 mice with sham or AOA 8W. Scale bars, 50 μm. g ELISA analysis of PGE2 level in the talus of 20-week-old C57BL/6 mice with sham or AOA 8W. h Representative images of immunofluorescence staining and quantitative analysis of the CGRP+ sensory nerves (green) in the subchondral bone of talus of 20-week-old C57BL/6 mice with sham or AOA 8W. Scale bars, 50 μm. i Representative images of immunostaining of CTSK and quantitative analysis of CTSK+ cells (red) in the subchondral bone of talus of 20-week-old C57BL/6 mice with sham or AOA 8W. Scale bars, 50 μm. j Representative images of human talus samples from end stage of AOA patients with total ankle arthroplasty (TAA). Representative μCT images k and quantitative analysis l of trabecular bone fraction (BV/TV) of healthy talus and end-stage AOA patient talus. Scale bars, 500 μm. m Representative images of immunostaining of TRAP in the subchondral bone of healthy talus and end-stage AOA patient talus. Scale bars, 50 μm. n Representative images of immunostaining and quantitative analysis of the COX2+ cells (brown) in the subchondral bone of healthy talus and end-stage AOA patient talus. Scale bars, 50 μm. o Representative immunofluorescence staining and quantitative analysis of CTSK (red) in the subchondral bone of healthy talus and end-stage AOA patient talus. Scale bars, 50 μm. p Representative images of immunofluorescence staining and quantitative analysis of the CGRP+ sensory nerves (red) in the subchondral bone of healthy talus and end-stage AOA patient talus. Scale bars, 50 μm. n ≥ 5 per group. *P < 0.05, **P < 0.01, and N.S. indicates not significant. Statistical significance was determined by Student’s t-test
Fig. 8
Fig. 8
Schematic diagram of PGE2 skeletal interoception regulating bone remodeling in response to mechanical loading.Mechanical loading induces secretion of PGE2, which binds to and activate the EP4 receptor on sensory nerves. The activated sensory nerves transmit the signals to ARC and then to PVN in the hypothalamus where TH transcriptional activity is downregulated. Mechanically, expression of CREM in the PVN is upregulated with mechanical loading, and CREM binds to the TH promoter to its transcription for the changes of sympathetic tone activity. Aberrant mechanical loading in ankle osteoarthritis could lead to pathological changes in talus. Three animal models used in the study: Tibia axial mechanical loading, hindlimb unloading, and ankle osteoarthritis (bottom)

Update of

Similar articles

Cited by

References

    1. Nutman AP, Bennett VC, Friend CR, Van Kranendonk MJ, Chivas AR. Rapid emergence of life shown by discovery of 3,700-million-year-old microbial structures. Nature. 2016;537:535–538. doi: 10.1038/nature19355. - DOI - PubMed
    1. Moroz LL. On the independent origins of complex brains and neurons. Brain Behav. Evol. 2009;74:177–190. doi: 10.1159/000258665. - DOI - PMC - PubMed
    1. Tosches MA, et al. Evolution of pallium, hippocampus, and cortical cell types revealed by single-cell transcriptomics in reptiles. Science. 2018;360:881–888. doi: 10.1126/science.aar4237. - DOI - PubMed
    1. Hain D, et al. Molecular diversity and evolution of neuron types in the amniote brain. Science. 2022;377:eabp8202. doi: 10.1126/science.abp8202. - DOI - PubMed
    1. Tosches MA, Laurent G. Evolution of neuronal identity in the cerebral cortex. Curr. Opin. Neurobiol. 2019;56:199–208. doi: 10.1016/j.conb.2019.04.009. - DOI - PubMed