. 2024 Mar 5;15(1):2001.
doi: 10.1038/s41467-024-46329-1.

Functional analysis of the human perivascular subarachnoid space

Affiliations

Functional analysis of the human perivascular subarachnoid space

Per Kristian Eide et al. Nat Commun. .

Abstract

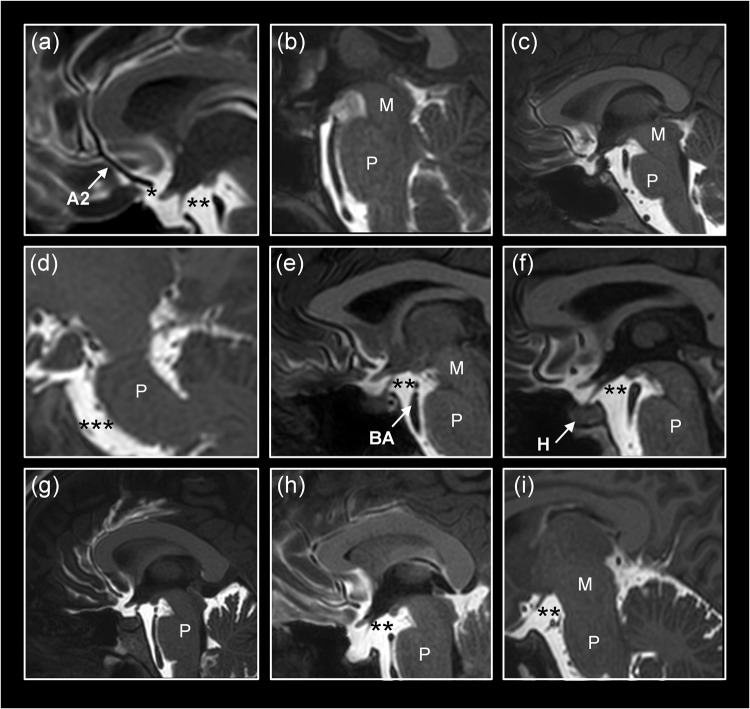
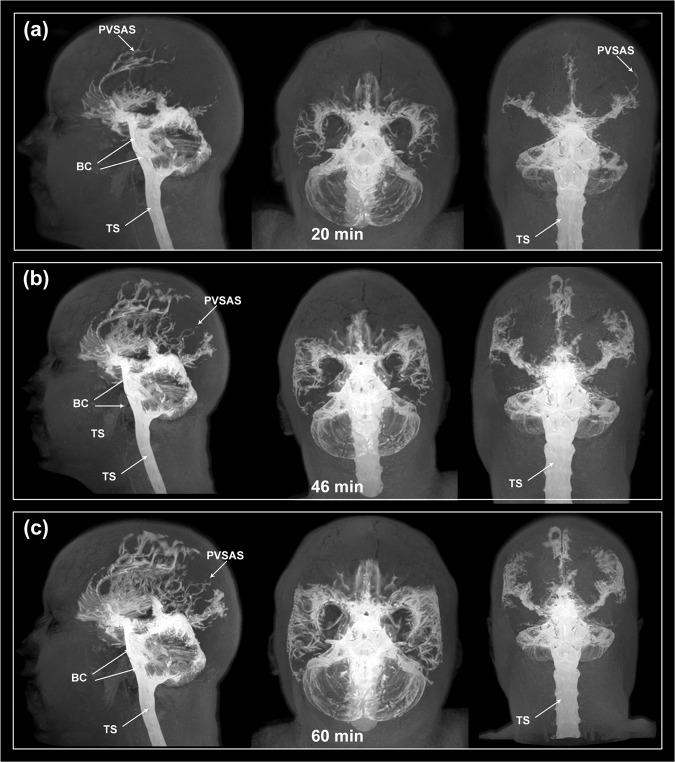
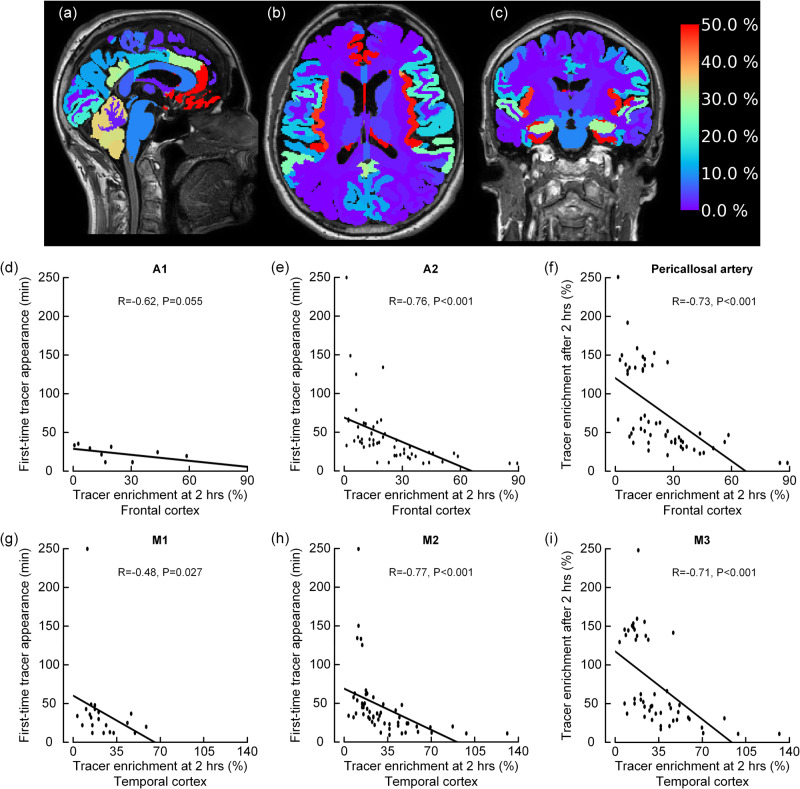
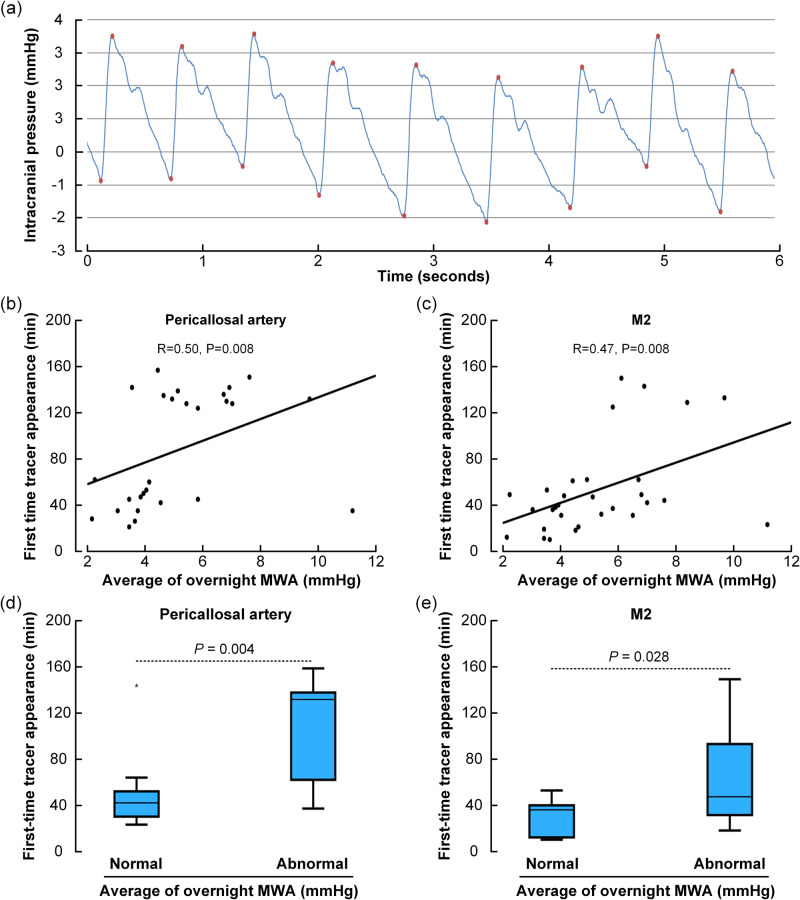
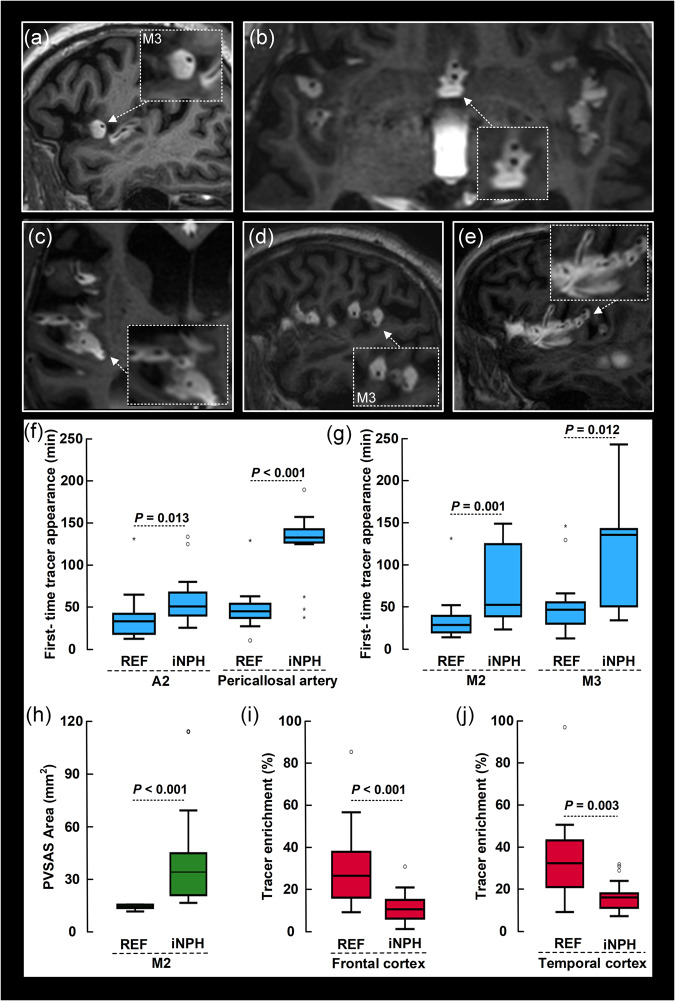
The human subarachnoid space harbors the cerebrospinal fluid, which flows within a landscape of blood vessels and trabeculae. Functional implications of subarachnoid space anatomy remain far less understood. This study of 75 patients utilizes a cerebrospinal fluid tracer (gadobutrol) and consecutive magnetic resonance imaging to investigate features of early (i.e. within 2-3 h after injection) tracer propagation within the subarachnoid space. There is a time-dependent perivascular pattern of enrichment antegrade along the major cerebral artery trunks; the anterior-, middle-, and posterior cerebral arteries. The correlation between time of first enrichment around arteries and early enrichment in nearby cerebral cortex is significant. These observations suggest the existence of a compartmentalized subarachnoid space, where perivascular ensheathment of arteries facilitates antegrade tracer passage towards brain tissue. Periarterial transport is impaired in subjects with reduced intracranial pressure-volume reserve capacity and in idiopathic normal pressure hydrocephalus patients who also show increased perivascular space size.


Conflict of interest statement

PKE has a financial interest in the software company (dPCom AS, Oslo) manufacturing the software (Sensometrics Software) used for analysis of the ICP recordings. The other author (GR) declares no competing interests.

Figures

Fig. 1
Fig. 1. The human subarachnoid space is compartmentalized by a perivascular subarachnoid space.
We used an MRI contrast agent (gadobutrol) as CSF tracer to study compartmentalization of the subarachnoid space (SAS). a, b In MR image planes orthogonal to the vessels, the CSF tracer that was administered intrathecal formed a donut-shaped form around the arteries (A). This perivascular subarachnoid space (PVSAS) is thus represented by the contrast-enriched perivascular compartment, delineated by a perivascular membrane (PVM) semipermeable to the CSF tracer. Tracer enrichment in PVSAS preceded tracer enrichment in surrounding subarachnoid space (SAS) and thereafter in cerebral cortex (CC). In b is shown a 3D representation of the PVSAS residing within the SAS. c, d Schematic illustrations show the artery (A), perivascular subarachnoid space (PVSAS), delineated by the perivascular membrane (PVM), and surrounding SAS. Provided the PVM is part of the leptomeninges (arachnoid and pia), we may anticipate that the perivascular membrane (PVM) is attached to the arachnoid trabecula (AT) and further towards the pia mater (P) and the arachnoid barrier cell layer towards the dura mater (not shown here). Illustration in c, d: Øystein Horgmo, University of Oslo.
Fig. 2
Fig. 2. Tracer evidence of a perivascular subarachnoid space along the anterior, middle and posterior cerebral arteries.
First signs of antegrade tracer enhancement along artery trunks in subarachnoid space (SAS) were circumferential around the anterior cerebral artery (ACA; ad), middle cerebral artery (MCA; eh) and posterior cerebral artery (PCA; il), where tracer enrichment in the surrounding SAS occurred subsequently at later time points. In image planes orthogonal to the vessels, tracer formed a donut-shaped form around the arteries ae, gh. The perivascular subarachnoid space is thus represented by the contrast-enriched perivascular compartment. Time from intrathecal tracer injection: (a) 199 min, (b) 32 min, (c) 60 min, (d) 39 min, (e) 53 min, (f) 19 min, (g) 10 min, (h) 37 min, (i) 20 min (j) 11 min, (k) 59 min, and (l) 9 min.
Fig. 3
Fig. 3. Antegrade perivascular transport along the anterior cerebral artery (ACA) branches.
The time course of periarterial tracer enrichment in the perivascular subarachnoid space (PVSAS) along ACA (ae) indicates antegrade tracer propagation. The asterisk indicates first-time appearance of tracer along ACA. f The time from intrathecal injection to first-time appearance of tracer along the different segments of ACA, i.e. A1 (n = 11), A2 (n = 61) and pericallosal artery (n = 63) is shown. Graph indicated by mean and 95% confidence intervals (CI) and differences determined by ANOVA with post-hoc Bonferroni corrections. Variation in spinal transit time was no confounder for differences in first-time appearance of tracer between the vascular segments. g A 3D image shows tracer enrichment in subarachnoid space (SAS), and along the perivascular subsrachnoid space (PVSAS) of the pericallosal artery (note the sparse distal enrichment as compared with the pronounced proximal enrichment of subarachnoid space). h A cartoon illustrates the tracer transport confined to the PVSAS, moving in antegrade direction (arrow); illustration: Øystein Horgmo, University of Oslo.
Fig. 4
Fig. 4. Antegrade perivascular transport along the middle cerebral artery branches.
The time course of periarterial tracer enrichment in the perivascular subarachnoid space along MCA (ad) indicates antegrade tracer propagation. The asterisk indicates first time appearance of tracer along MCA. e The time from intrathecal injection to first-time appearance of tracer along the segments of MCA, i.e. M1 (n = 24), M2 (n = 68) and M3 (n = 59) is shown. Graph indicated by mean and 95% confidence intervals (CI) and differences determined by ANOVA with post hoc Bonferroni corrections to correct for multiple comparisons. Variation in spinal transit time was no confounder for differences in first-time appearance of tracer between the vascular segments. f Measured at the M2 segment of the MCA about 2 h after injection, tracer enrichment was signficantly stronger in perivascular subarachnoid space (PVSAS; n = 10) than in surrounding subarachnoid space (SAS n = 10; P = 0.002; Mann-Whitney U-test). The difference was reduced at a later time (about 3 h; n = 10; P = 0.63; Mann-Whitney U-test). Box plots show median, 75% percentiles and ranges. g Visibly stronger tracer enrichment in PVSAS than surrounding SAS.
Fig. 5
Fig. 5. Direct tracer propagation between subarachnoid basal cisterns and the perivascular subarachnoid space.
ai The present observations gave evidence for direct communication between prepontine and interpeduncular cisterns and the perivascular subarachnoid spaces. Only one of 75 subjects demonstrated some barrier function of the Liliequist membrane. Time from intrathecal tracer injection: (a) 132 min, (b) 34 min, (c) 15 min, (d) 14 min, (e) 22 min, (f) 30 min, (g) 9 min, (h) 140 min, and (i) 26 min. A2: A2 segment of anterior cerebral artery. BA: Basilar artery. H: Hypophysis. M: Mesencephalon. P: Pons. * Prechiasmatic cistern. ** Interpeduncular (or premesenchephalic) cistern. *** Prepontine cistern.
Fig. 6
Fig. 6. 3D representations of direct tracer propagation between subarachnoid basal cisterns and the perivascular subarachnoid space.
a–c The present observations suggest direct passage of tracer from the thecal sac (TS), via basal cisterns (BC) towards the perivascular subarachnoid spaces (PVSAS). The 3D images show tracer enrichment in sagittal, axial and cornal planes, assessed 20 min (a), 46 min (b) and 60 min (c) after intratehcal tracer injection.
Fig. 7
Fig. 7. Periarterial subarachnoid tracer transport precedes tracer enrichment in cerebral cortex.
After being confined to the periarterial space, the tracer passed to the surrounding subarachnoid space (SAS) and further to the extravascular compartment within the cerebral cortex. a–c Sagittal, axial, and coronal MRI shows tracer enrichment in brain as percentage change in normalized T1 signal at 2 h after intrathecal tracer (gadobutrol, 0.50 mmol) administration (percentages shown on the color bar to the right). Tracer enrichment in CSF is removed to show tracer enrichment in brain only. Highest tracer enrichment (red color) is seen cerebral cortex nearby the ACA (a, b), MCA (b, c) and PCA (c). d–f The correlation between tracer enrichment in frontal cortex (gray matter) and first-time appearance of tracer in A1, A2 and pericallosal artery segments of ACA. g–i The correlation between tracer enrichment in temporal cortex (gray matter) and first-time appearance of periarterial tracer enhancement in M1, M2 and M3 segments of MCA. The negative correlations show that shorter first time appearance of tracer was associated with stronger tracer enrichment in cerebral cortex. For the individual plots, the Spearman correlation coefficient is given with significance level, and fit line shown. Images (a–c): Lars Magnus Valnes, Department of neurosurgery, Oslo University Hospital-Rikshospitalet.
Fig. 8
Fig. 8. The periarterial subarachnoid tracer transport depends on the pulsatile intracranial pressure (ICP).
a The pulsatile intracranial pressure (ICP) refers to the cardiac-induced pressure waves from the continuous ICP signal, which was quantified as the mean ICP wave amplitude (MWA) over consecutive 6-seconds time windows. The average of MWA during overnight ICP measurements was calculated. With increasing pulsatile ICP, the perivascular tracer transport became slowed down. Thus, there was a significant positive correlation between average of overnight MWA and first-time tracer appearance in (b) pericallosal artery of anterior cerebral artery (ACA), as well as (c) M2 segment of middle cerebral artery (MCA). For the individual plots, the Spearman correlation coefficient is given with significance level, and fit line shown. Variation in spinal transit time was no confounder for correlations in b and c. Furthermore, dichotomizing over-night MWA scores as Normal (n = 10) and Abnormal (n = 22) according to previously described criteria showed in subjects with abnormal elevated MWA significantly delayed first-time tracer appearance in pericallosal artery segment of ACA (d) and M2 segment of MCA (e). Box plots show median, 75% percentiles and ranges. Statistical differences determined by Mann-Whitney U-test.
Fig. 9
Fig. 9. Alterations of perivascular subarachnoid spaces in subjects with a dementia disease.
The dementia subtype idiopathic normal pressure hydrocephalus (iNPH) presents with enlarged and more irregular perivascular subarachnoid spaces (PVSAS) a–e. Time from intrathecal tracer injection: a 54 min, (b) 33 min, (c) 203 min, (d) 130 min, and (e) 130 min. The morphological alterations of PVSAS were accompanied with delayed perivascular tracer transport. First-time appearance of tracer occurred later in the ACA branches A2 of iNPH (n = 15) than reference (REF) subjects (n = 13), in pericallosal artery of iNPH (n = 16) than REF (n = 13) subjects, in pericallosal artery of iNPH (n = 16) than REF (n = 13) subjects (f), as well as in the MCA branches M2 of iNPH (n = 18) than REF (n = 13) subjects and in M3 of iNPH (n = 13) than REF (n = 13) subjects (g). The area of PVSAS in the M2 segment was larger in iNPH patients (n = 19) as compared with REF (n = 9) individuals (h). Furthermore, tracer enrichment in gray matter at 2 h was reduced in iNPH (n = 22) than REF (n = 14) in frontal cortex (i) and temproal cortex (j). Box plots show median, 75% percentiles and ranges. Signifcant differences between groups determined by Mann-Whitney U-test.

Similar articles

Cited by

References

    1. Weller RO, Sharp MM, Christodoulides M, Carare RO, Møllgård K. The meninges as barriers and facilitators for the movement of fluid, cells and pathogens related to the rodent and human CNS. Acta Neuropathol. 2018;135:363–385. doi: 10.1007/s00401-018-1809-z. - DOI - PubMed
    1. Louveau A, et al. Structural and functional features of central nervous system lymphatic vessels. Nature. 2015;523:337–341. doi: 10.1038/nature14432. - DOI - PMC - PubMed
    1. Aspelund A, et al. A dural lymphatic vascular system that drains brain interstitial fluid and macromolecules. J. Exp. Med. 2015;212:991–999. doi: 10.1084/jem.20142290. - DOI - PMC - PubMed
    1. Nauen DW, Troncoso JC. Amyloid-beta is present in human lymph nodes and greatly enriched in those of the cervical region. Alzheimer’s Dement.: J. Alzheimer’s Assoc. 2022;18:205–210. doi: 10.1002/alz.12385. - DOI - PubMed
    1. Rustenhoven J, Kipnis J. Brain borders at the central stage of neuroimmunology. Nature. 2022;612:417–429. doi: 10.1038/s41586-022-05474-7. - DOI - PMC - PubMed