

Association between BMI z-score and body composition indexes with blood pressure and grip strength in school-age children: a cross-sectional study
- PMID: 38443395
- PMCID: PMC10915149
- DOI: 10.1038/s41598-024-55875-z
Association between BMI z-score and body composition indexes with blood pressure and grip strength in school-age children: a cross-sectional study
Abstract
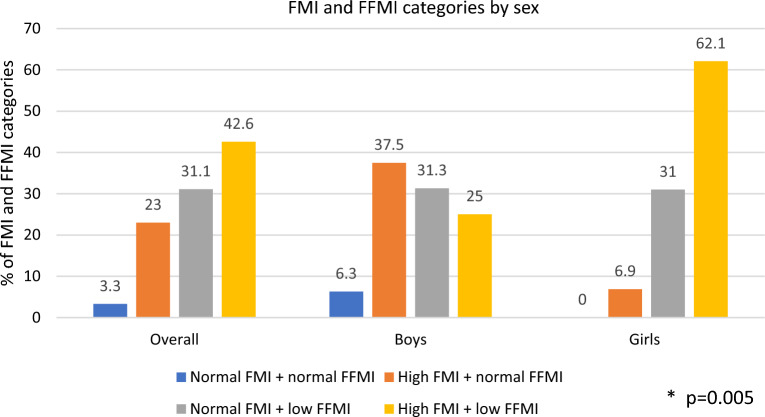
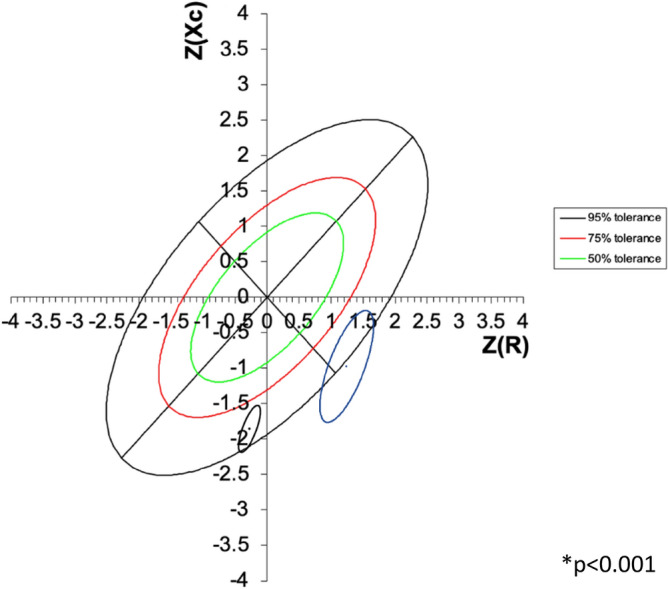
Childhood obesity is linked to diverse health outcomes, including elevated blood pressure (EBP). Emerging evidence showed that excess fat mass (FM) may have a deleterious impact on blood pressure even in normal-weight children. The primary objective of this study was to assess the association between body weight status by BMI z-score and body composition parameters by conventional bioelectrical impedance analysis (BIA) and bioelectrical impedance vector analysis (BIVA). Also, we aimed to explore the performance of BMI z-score, %FM, and FM index (FMI) in discriminating EBP in a sample of school-age Mexican children. Children were classified as having normal weight, overweight or obesity according to WHO criteria for BMI z-score. FMI was considered high when above 75th percentile, and fat free mass index (FFMI) was considered low when below 25th percentile of the reference population. Body composition was also classified according to the BIVA method and EBP was determined when systolic and/or diastolic blood pressure ≥ 90th percentile. BMI z-score groups were compared by Student´s t-test or the Mann-Whitney U test, or by the chi-square test or Fisher exact test. Receiving operating characteristic (ROC) analysis was performed. 61 children were included (52.5% boys, median age 9.8 (25th, 75th percentiles: 8.5, 11.0)) years. High FMI was observed in 32.3% of children with normal weight. Low FFMI was present in 93.5% of children with normal weight and 53.3% of those with overweight/obesity. According to BIVA, 58.1% and 43.3% of children with normal weight and overweight/obesity were classified as having cachexia. All the three adiposity indicators showed significant areas under the ROC curve (AURC) greater than 0.775 for EBP, with the largest one displayed for FM% (0.794). Hight FMI and low FFMI are common in children with normal weight. Identifying deficiency of FFM might be limited by using solely BMI indicators. Cachexia by BIVA was present in a high proportion of children with either normal weight or overweight/obesity. Both BMI z-score and FM (% and FMI) performed well at discriminating EBP, with a numerically greater AURC observed for FM%. Body composition in pediatric population is relevant for identifying body composition abnormalities at early age.
Keywords: Adiposity; Cardiovascular risk; Childhood obesity; Elevated blood pressure; Lean mass.
© 2024. The Author(s).
Conflict of interest statement
The authors declare no competing interests.
Figures


Similar articles
-
Comparison of body mass index and fat mass index to classify body composition in adolescents-The EVA4YOU study.Eur J Pediatr. 2024 May;183(5):2203-2214. doi: 10.1007/s00431-024-05474-x. Epub 2024 Feb 22. Eur J Pediatr. 2024. PMID: 38386029 Free PMC article.
-
Relationship of Fat Mass Index and Fat Free Mass Index With Body Mass Index and Association With Function, Cognition and Sarcopenia in Pre-Frail Older Adults.Front Endocrinol (Lausanne). 2021 Dec 24;12:765415. doi: 10.3389/fendo.2021.765415. eCollection 2021. Front Endocrinol (Lausanne). 2021. PMID: 35002957 Free PMC article.
-
Body Composition Characteristics of a Load-Capacity Model: Age-Dependent and Sex-Specific Percentiles in 5- to 17-Year-Old Children.Obes Facts. 2021;14(6):593-603. doi: 10.1159/000518638. Epub 2021 Oct 5. Obes Facts. 2021. PMID: 34818246 Free PMC article.
-
Socioeconomic position and body composition in childhood in high- and middle-income countries: a systematic review and narrative synthesis.Int J Obes (Lond). 2021 Nov;45(11):2316-2334. doi: 10.1038/s41366-021-00899-y. Epub 2021 Jul 27. Int J Obes (Lond). 2021. PMID: 34315999 Free PMC article.
-
The Physiological Effects of Weight-Cycling: A Review of Current Evidence.Curr Obes Rep. 2024 Mar;13(1):35-50. doi: 10.1007/s13679-023-00539-8. Epub 2024 Jan 3. Curr Obes Rep. 2024. PMID: 38172475 Review.
Cited by
-
Effect of 4 Weeks of High-Intensity Interval Training (HIIT) on VO2max, Anaerobic Power, and Specific Performance in Cyclists with Cerebral Palsy.J Funct Morphol Kinesiol. 2025 Mar 24;10(2):102. doi: 10.3390/jfmk10020102. J Funct Morphol Kinesiol. 2025. PMID: 40566399 Free PMC article.
-
Integrating Genetic Insights, Technological Advancements, Screening, and Personalized Pharmacological Interventions in Childhood Obesity.Adv Ther. 2025 Jan;42(1):72-93. doi: 10.1007/s12325-024-03057-8. Epub 2024 Nov 13. Adv Ther. 2025. PMID: 39535684 Free PMC article. Review.
References
MeSH terms
Grants and funding
LinkOut - more resources
Full Text Sources
Medical
