. 2024 Mar 5;15(1):1995.
doi: 10.1038/s41467-024-46357-x.

ALKBH5-mediated m6A modification of IL-11 drives macrophage-to-myofibroblast transition and pathological cardiac fibrosis in mice

Affiliations

ALKBH5-mediated m6A modification of IL-11 drives macrophage-to-myofibroblast transition and pathological cardiac fibrosis in mice

Tao Zhuang et al. Nat Commun. .

Erratum in

Abstract

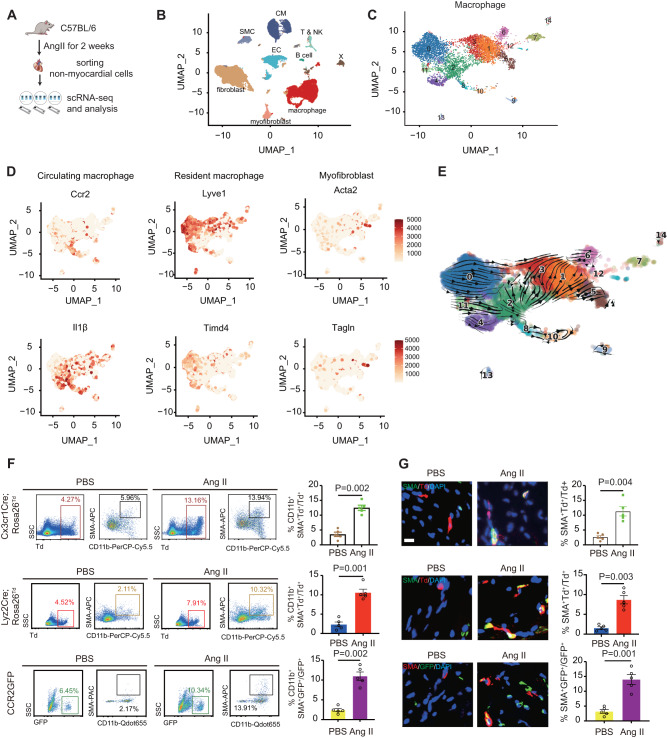
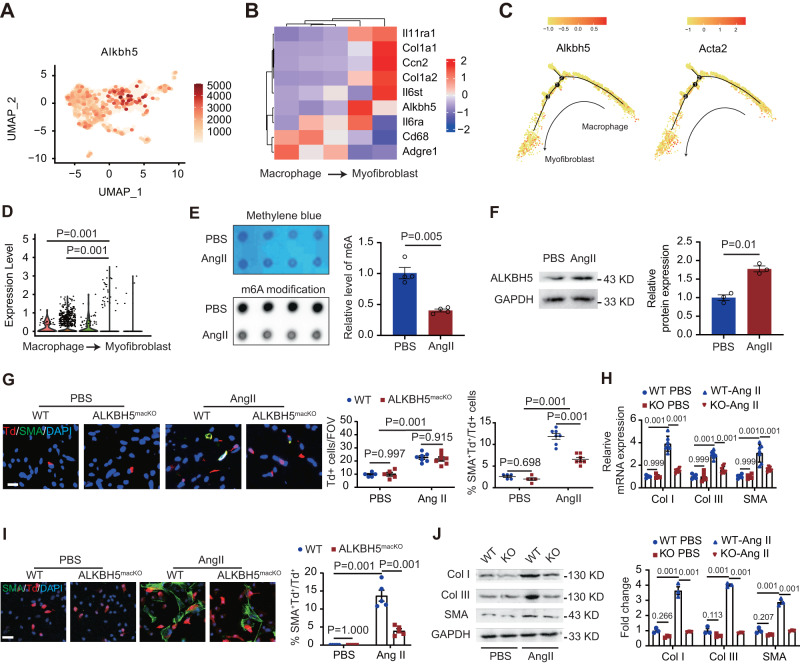
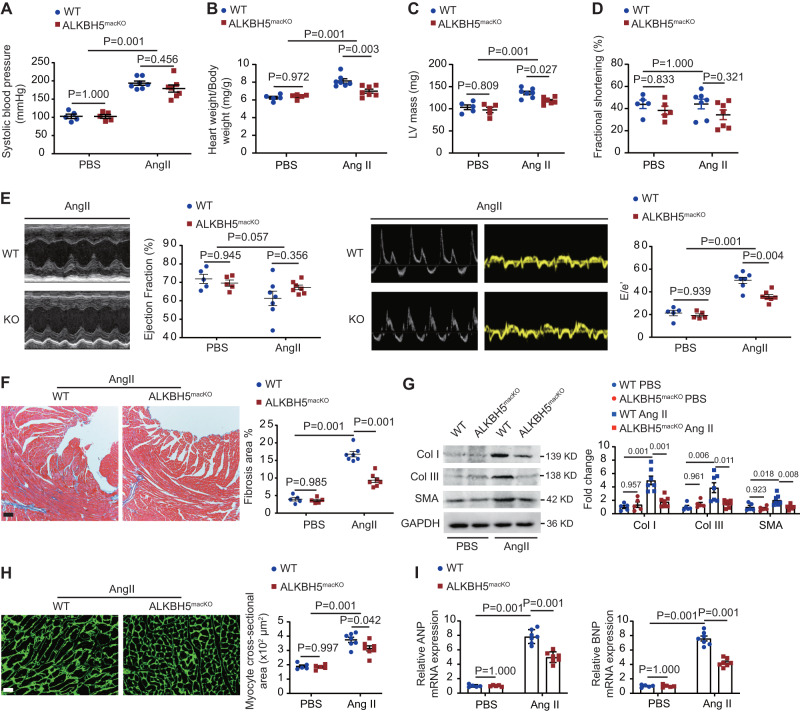
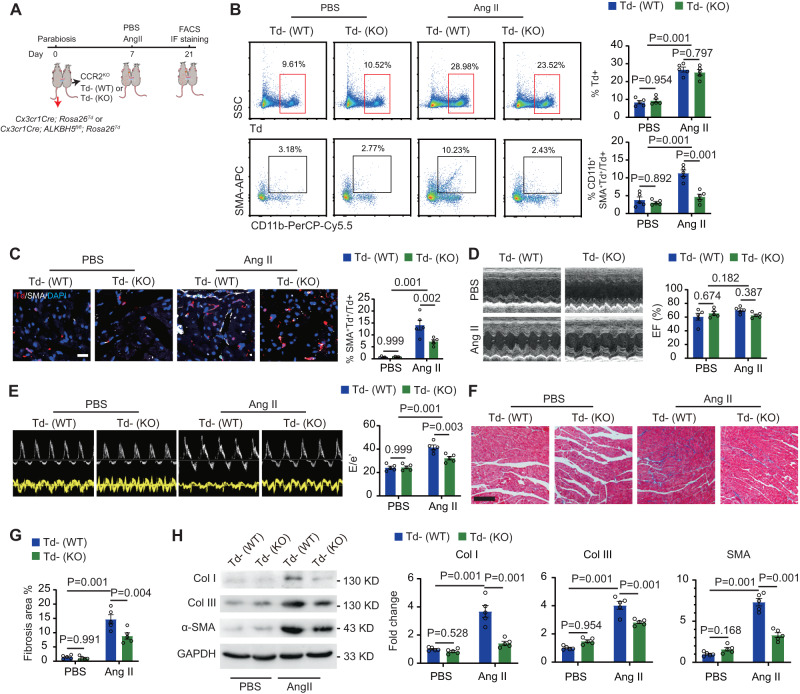
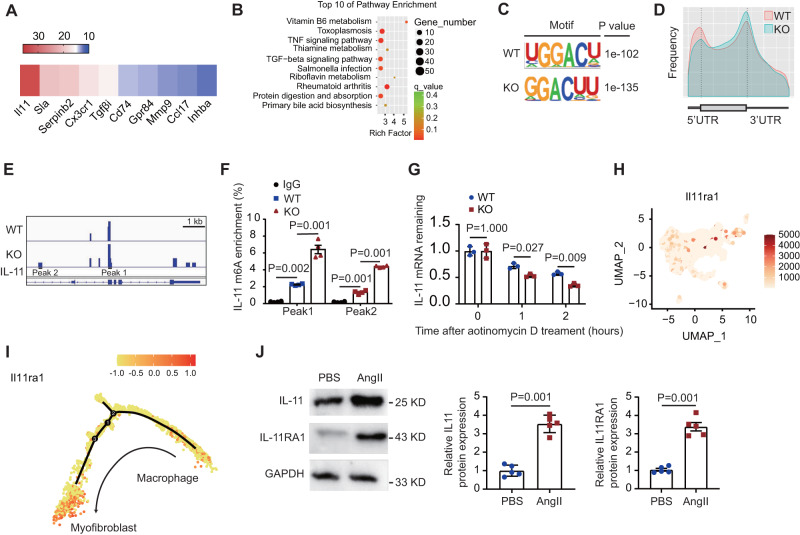
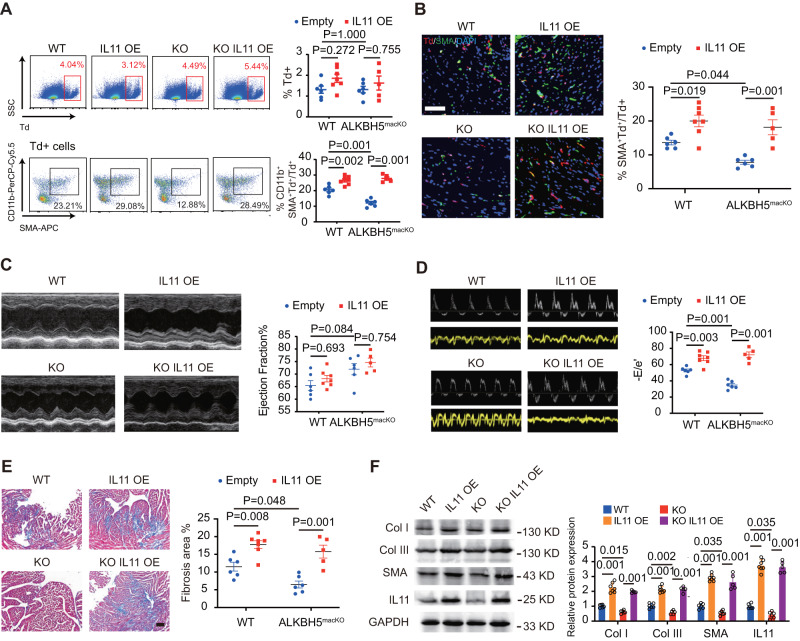
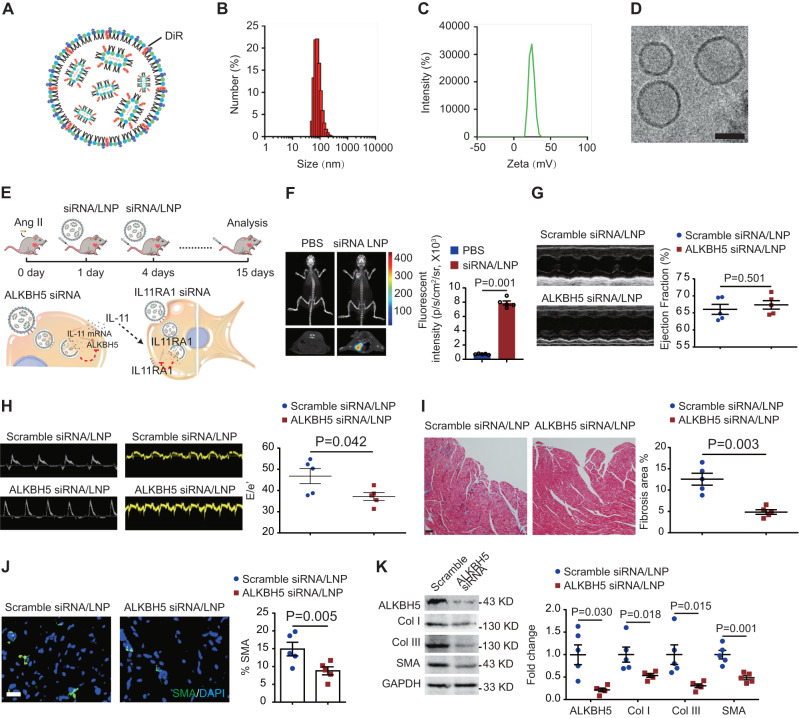
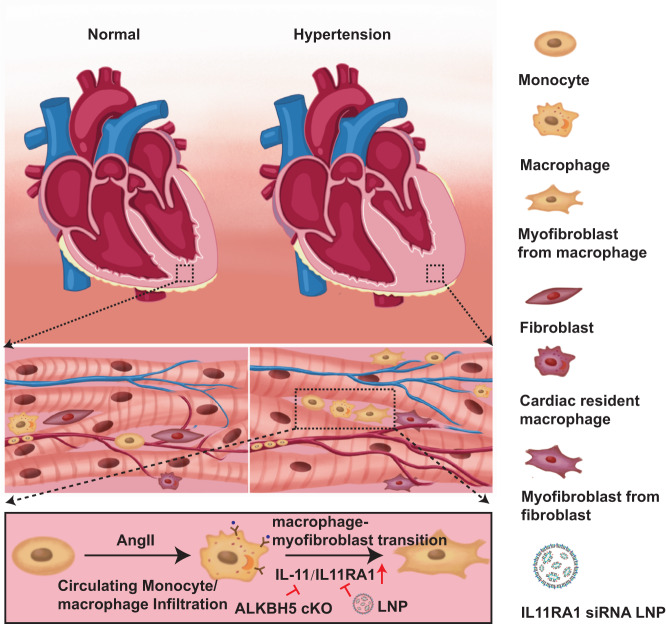
Cardiac macrophage contributes to the development of cardiac fibrosis, but factors that regulate cardiac macrophages transition and activation during this process remains elusive. Here we show, by single-cell transcriptomics, lineage tracing and parabiosis, that cardiac macrophages from circulating monocytes preferentially commit to macrophage-to-myofibroblast transition (MMT) under angiotensin II (Ang II)-induced hypertension, with accompanying increased expression of the RNA N6-methyladenosine demethylases, ALKBH5. Meanwhile, macrophage-specific knockout of ALKBH5 inhibits Ang II-induced MMT, and subsequently ameliorates cardiac fibrosis and dysfunction. Mechanistically, RNA immunoprecipitation sequencing identifies interlukin-11 (IL-11) mRNA as a target for ALKBH5-mediated m6A demethylation, leading to increased IL-11 mRNA stability and protein levels. By contrast, overexpression of IL11 in circulating macrophages reverses the phenotype in ALKBH5-deficient mice and macrophage. Lastly, targeted delivery of ALKBH5 or IL-11 receptor α (IL11RA1) siRNA to monocytes/macrophages attenuates MMT and cardiac fibrosis under hypertensive stress. Our results thus suggest that the ALKBH5/IL-11/IL11RA1/MMT axis alters cardiac macrophage and contributes to hypertensive cardiac fibrosis and dysfunction in mice, and thereby identify potential targets for cardiac fibrosis therapy in patients.


Conflict of interest statement

The authors declare no competing interests.

Figures

Fig. 1
Fig. 1. Hypertension increases macrophage-myofibroblast transition.
A Diagram of single cell RNA sequencing of non-myocardial cells from Angiotensin II or PBS infused C57BL/6 mice. B UMAP dimensionality reduction analysis displayed clusters of non-myocardial cells. C UMAP dimensionality reduction analysis of macrophage. D Feature plots depicting single-cell gene expression of selected macrophage and myofibroblast genes by UMAP dimensionality reduction analysis. E, RNA velocity (scVelo) analysis showed macrophage to myofibroblast transition. F Representative flow cytometry analyses of cardiac CD11b+SMA+ cells gated on Td+ cells from PBS or Ang II treated Cx3cr1Cre; Rosa26Td and Lyz2Cre;Rosa26Td mice, or GFP+ cells from PBS or Ang II treated CCR2GFP mice, with representative images at left and quantification at right. n = 5. G Representative immunofluorescent images (left) and quantification (right) of SMA+Td+ cells of cardiac tissues from Cx3cr1Cre; Rosa26Td, Lyz2Cre; Rosa26Td and CCR2GFP mice with and without Ang II infusion. n = 5. Scale bar, 50 μm. All data are presented as mean ± standard error mean. Data in F, G were analyzed by two-tailed unpaired Student’s t-test. P < 0.05 was considered as statistically significant. Ang II Angiotensin II, scRNA-seq single cell RNA sequencing, UMAP uniform manifold approximation and projection, SMC smooth muscle cell, CM cardiomyocyte, EC endothelial cell, NK natural killer.
Fig. 2
Fig. 2. ALKBH5 upregulation is involved in hypertension-induced cardiac MMT.
A Dot plots depicting single-cell gene expression of ALKBH5 in macrophage subclusters visualized on the UMAP dimensionality reduction plots. B The heat maps showing the marker gene and ALKBH5 expression of each cell cluster. C The ALKBH5 and Acta2 expression in pseudotemporal trajectory analysis from cluster macrophages to myofibroblasts. D ALKBH5 expression in macrophages and myofibroblast-like macrophages shown by violin. E m6A dot blot assay of mRNAs in cardiac Td+ cells from Cx3cr1CreTd mice with or without Ang II infusion (n = 5). F Expression of ALKBH5 by western blot in cardiac Td+ cells from Cx3cr1CreTd mice with and without Ang II infusion. n = 5. G Representative immunofluorescent images and quantification of SMA+Td+ cells in cardiac tissues from Cx3cr1CreTd and ALKBH5macKO-Td mice (n = 5 for PBS group and n = 7 for Ang II group). Scale bar, 100 μm. H mRNA levels of SMA and collagen (Col) types I and III expression in cardiac Td+ cells from Cx3cr1CreTd and ALKBH5macKO mice. n = 5 for PBS group and n = 7 for Ang II group. I Representative immunofluorescent images (left) and quantification (right) of SMA+ cells in cultured Td+ macrophages cells from Cx3cr1CreTd and ALKBH5macKO mice with and without Ang II infusion. n = 5. Scale bar, 100 μm. J Representative images and quantification of the SMA and collagen (Col) types I and III expression by western blot in cardiac tissues of Cx3cr1CreTd and ALKBH5macKO-Td mice (n = 5 for PBS group and n = 7 for Ang II group). All data are presented as mean ± standard error mean. Data in E, F were analyzed by two-tailed unpaired Student’s t test. Data in D were analyzed by Wilcoxon signed-ranks test. Data in G were analyzed by two-way ANOVA followed by Tukey post-hoc tests. Data in HJ were analyzed by one-way ANOVA followed by Tukey post-hoc tests. n.s. indicates nonsignificant. P < 0.05 was considered as statistically significant. UMAP uniform manifold approximation and projection, Ang II Angiotensin II, FOV field of view, WT wild-type, KO knockout, Col collagen.
Fig. 3
Fig. 3. Specific deletion of ALKBH5 in Cx3cr1 lineage improves Ang II induced MMT and cardiac fibrosis.
A Quantification analysis of SBP in sham and Ang II treated WT and ALKBH5macKO-Td mice (n = 5 for PBS group and n = 7 for Ang II group). B Quantification analysis of heart weight/body weight in sham and Ang II treated WT and ALKBH5macKO-Td mice (n = 5 for PBS group and n = 7 for Ang II group). C Quantification analysis of LV mass in sham and Ang II treated WT and ALKBH5macKO-Td mice (n = 5 for PBS group and n = 7 for Ang II group). D Quantification analysis of fractional shortening in sham and Ang II treated WT and ALKBH5macKO-Td mice (n = 5 for PBS group and n = 7 for Ang II group). E Representative echocardiography images and quantification of ejection fraction (left) and E/e’ (right) of WT and ALKBH5macKO-Td mice after PBS or Ang II treatment for 14 days (n = 5 for PBS group and n = 7 for Ang II group). F Representative images of Masson trichrome staining in cardiac tissue and quantification of positive fibrotic area (n = 5 for PBS group and n = 7 for Ang II group). Scale bar, 100 μm. G Representative images and quantification of the SMA and collagen (Col) types I and III expression by western blot in cardiac tissues of WT and ALKBH5macKO-Td mice (n = 5 for PBS group and n = 7 for Ang II group). H Representative images of wheat germ agglutinin staining in cardiac tissue and quantification of positive fibrotic area (n = 5 for PBS group and n = 7 for Ang II group). Scale bar, 100 μm. I mRNA levels of ANP and BNP expression in cardiac Td+ cells from WT and ALKBH5macKO mice. n = 5 for PBS group and n = 7 for Ang II group. All data are presented as mean ± standard error mean. Data in AF and H were analyzed by two-way ANOVA followed by Tukey post-hoc tests. Data in G, I were analyzed by one-way ANOVA followed by Tukey post-hoc tests. n.s. indicates nonsignificant. P < 0.05 was considered as statistically significant. Ang II Angiotensin II, WT wild-type, ANP atrialnatriureticpeptide, BNP brain natriuretic peptide, Col collagen.
Fig. 4
Fig. 4. ALKBH5 in circulating monocytes-derived macrophage contributes to hypertension-induced cardiac fibrosis and dysfunction.
A Diagram of parabiosis between CCR2KO and Cx3cr1Cre; Rosa26Td or Cx3cr1Cre; ALKBH5fl/fl; Rosa26Td mice, respectively. B Representative images and quantification of flow cytometry analyses of Td+ and CD11b+SMA+ cells gated on Td+ cells in hearts from CCR2KO mice cojoined with Cx3cr1Cre; Rosa26Td or Cx3cr1Cre; ALKBH5fl/fl; Rosa26Td mice. n = 5. C Representative immunofluorescent images and quantification of SMA+ cells in Td+ cells of cardiac tissues from CCR2KO cojoined with Cx3cr1Cre; Rosa26Td or Cx3cr1Cre; ALKBH5fl/fl; Rosa26Td mice (n = 5). Scale bar, 100 μm. D Representative echocardiography images of ejection fraction of the CCR2KO cojoined with Cx3cr1Cre; Rosa26Td or Cx3cr1Cre; ALKBH5fl/fl; Rosa26Td mice after Ang II treatment for 14 days, with indices of cardiac ejection fraction and E/e’ at right. n = 5. E Representative echocardiography images of E/e’ (E) of the CCR2KO cojoined with Cx3cr1Cre; Rosa26Td or Cx3cr1Cre; ALKBH5fl/fl; Rosa26Td mice after Ang II treatment for 14 days, with indices of cardiac ejection fraction and E/e’ at right. n = 5. F Representative images of Masson trichrome staining. n = 5. Scale bar, 100 μm. G Quantification of positive fibrotic area. n = 5. Scale bar, 100 μm. H Representative images of SMA and ECM genes collagen I and III in cardiac tissues shown by western blot (n = 5). All data are presented as mean ± standard error mean. Data in BE and G were analyzed by two-way ANOVA followed by Tukey post-hoc tests. Data in H were analyzed by one-way ANOVA followed by Tukey post-hoc tests. n.s. indicates nonsignificant. P < 0.05 was considered as statistically significant. Ang II Angiotensin II, WT wild-type, KO knockout, Col collagen.
Fig. 5
Fig. 5. Macrophage ALKBH5 directly regulates m6A modification on IL-11 mRNA.
A top abundant enriched target mRNAs of ALKBH5 induced by Angiotensin II. B Top enriched pathway of ALKBH5 induced by Angiotensin II. C m6A motif identified from m6A RNA immunoprecipitation-sequencing analysis. D Metagene distribution of m6A peaks along the whole transcriptome, including 5’ untranslated regions (5’ UTR), covering coding sequence (CDS) and 3’ UTR. E m6A peak distribution on IL-11 mRNA shown by Integrative Genomics Viewer (IGV) tool. kb means kilo base pair. F Relative fold change of m6A enrichment on IL-11 mRNA by m6A RIP-qPCR analysis (n = 4). G Degradation of IL-11 mRNA was detected in macrophages following treating with actinomycin D for indicated time (n = 3). H IL11RA1 gene signatures visualized by Feature Plots. I Expression level of IL11RA1 along the pseudotime trajectory. J Protein levels of IL11RA1 in cardiac Td+ cells of the hearts following PBS and Ang II treatment shown by western blot with representative images at left and quantification at right. n = 5. All data are presented as mean ± standard error mean. Data in F were analyzed by one-way ANOVA followed by Tukey post-hoc tests. Data in G were analyzed by two-way ANOVA followed by Tukey post-hoc tests. Data in J were analyzed by two-tailed unpaired Student’s t-test. n.s. indicates nonsignificant. P < 0.05 was considered as statistically significant. UTR Untranslated Regions, WT wild-type, KO knockout, UMAP uniform manifold approximation and projection, Ang II angiotensin II.
Fig. 6
Fig. 6. IL-11 overexpression reverses macrophage ALKBH5 deletion-mediated improved cardiac dysfunction via increasing cardiac fibrosis.
A Representative flow cytometry analyses of Td+ and CD11b+SMA+cells in hearts from C57BL6/J mice transplanted bone marrow from ALKBH5macKO-Td-BM and Cx3cr1CreTd-BM mice with empty vector or IL11 overexpression, with quantification at right. n = 6 for WT and ALKBH5macKO group. n = 7 for IL11 OE group. n = 5 for ALKBH5macKO and IL11 OE group. B Representative immunofluorescent images and quantification of SMA+ cells in Td+ cells of cardiac tissues from the reconstituted mice. n = 6 for WT and ALKBH5macKO group. n = 7 for IL11 OE group. n = 5 for ALKBH5macKO and IL11 OE group. Scale bar, 100 μm. C Representative echocardiography images and quantification of ejection fraction of the above mice after Ang II treatment for 2 weeks. n = 6 for WT and ALKBH5macKO group. n = 7 for IL11 OE group. n = 5 for ALKBH5macKO and IL11 OE group. D Representative echocardiography images and quantification of E/e’ of the above mice after Ang II treatment for 2 weeks. n = 6 for WT and ALKBH5macKO group. n = 7 for IL11 OE group. n = 5 for ALKBH5macKO and IL11 OE group. E Representative images of Masson trichrome staining in cardiac tissue and quantification of positive fibrotic area. n = 6 for WT and ALKBH5macKO group. n = 7 for IL11 OE group. n = 5 for ALKBH5macKO and IL11 OE group. Scale bar, 100 μm. F Representative images and quantification of the SMA, collagen (Col) types I and III and IL11 expression by western blot in cardiac tissues of the reconstituted mice. n = 6 for WT and ALKBH5macKO group. n = 7 for IL11 OE group. n = 5 for ALKBH5macKO and IL11 OE group. All data are presented as mean ± standard error mean. Data in AE and F were analyzed by one-way ANOVA followed by Tukey post-hoc tests. n.s. indicates nonsignificant. P < 0.05 was considered as statistically significant. WT wild-type, KO knockout, OE overexpression, Col collagen.
Fig. 7
Fig. 7. Nanoparticle monocyte/macrophage-target delivery of ALKBH5 siRNA attenuates Ang II-induced cardiac fibrosis and dysfunction.
A Schematic diagram of lipid nanoparticle. B Size distribution of lipid nanoparticle measured by dynamic light scattering (DLS). C Zeta potential of lipid nanoparticle measured by dynamic light scattering (DLS). D The represent cryo-transmission electron micrographs (TEMS) of lipid nanoparticle. Scale bar, 50 nm. E Experimental diagram of in vivo ALKBH5 loss-of-function using C12-200 lipid nanoparticles. F Representative fluorescence imaging combined with microCT after intravenous injection of DiR-labeled C12-200 lipid nanoparticles, with quantification of fluorescent intensity at right. n = 5. G Representative echocardiography images and indices of ejection fraction of mice with scramble or ALKBH5 siRNA/LNP. n = 5. H Representative echocardiography images and indices of E/e’ of mice with scramble or ALKBH5 siRNA/LNP. n = 5. I Representative images (left) and quantification of positive fibrotic area (right) of Masson trichrome staining in cardiac tissue of mice with scramble or ALKBH5 siRNA/LNP n = 5. Scale bar, 100 μm. J Representative immunofluorescent images and quantification of SMA+ cells in cardiac tissues from scramble or ALKBH5 siRNA/LNP treated mice. n = 5. Scale bar, 100 μm. K Western blot analysis of IL11RA and ECM genes collagen I and III in cardiac tissues from mice with scramble or ALKBH5 siRNA/LNP. Quantitative results are shown on the right. n = 5. All data are presented as mean ± standard error mean. Data in FK were analyzed by two-tailed unpaired Student’s t-test. n.s. indicates nonsignificant. P < 0.05 was considered as statistically significant. siRNA small interfering RNA, LNP lipid nanoparticle, Col collagen.
Fig. 8
Fig. 8. Schematic illustration of macrophage ALKBH5-IL-11/IL11RA1 pathway in cardiac remodeling.
Schematic illustration of macrophage ALKBH5-IL-11/IL11RA1 pathway in cardiac remodeling.

References

    1. McDonagh TA, et al. 2021 ESC Guidelines for the diagnosis and treatment of acute and chronic heart failure: Developed by the Task Force for the diagnosis and treatment of acute and chronic heart failure of the European Society of Cardiology (ESC). With the special contribution of the Heart Failure Association (HFA) of the ESC. Eur. J. Heart Fail. 2022;24:4–131. doi: 10.1002/ejhf.2333. - DOI - PubMed
    1. Bergmann O, et al. Dynamics of cell generation and turnover in the human heart. Cell. 2015;161:1566–1575. doi: 10.1016/j.cell.2015.05.026. - DOI - PubMed
    1. Pinto AR, et al. Revisiting cardiac cellular composition. Circ. Res. 2016;118:400–409. doi: 10.1161/CIRCRESAHA.115.307778. - DOI - PMC - PubMed
    1. Gibb AA, Lazaropoulos MP, Elrod JW. Myofibroblasts and fibrosis: Mitochondrial and metabolic control of cellular differentiation. Circ. Res. 2020;127:427–447. doi: 10.1161/CIRCRESAHA.120.316958. - DOI - PMC - PubMed
    1. Steffens S, Nahrendorf M, Madonna R. Immune cells in cardiac homeostasis and disease: emerging insights from novel technologies. Eur. Heart J. 2022;43:1533–1541. doi: 10.1093/eurheartj/ehab842. - DOI - PMC - PubMed