

The use of wearable resistance and weighted vest for sprint performance and kinematics: a systematic review and meta-analysis
- PMID: 38443408
- PMCID: PMC10915135
- DOI: 10.1038/s41598-024-54282-8
The use of wearable resistance and weighted vest for sprint performance and kinematics: a systematic review and meta-analysis
Abstract
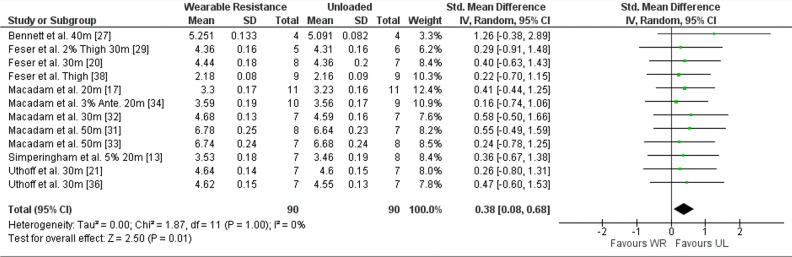
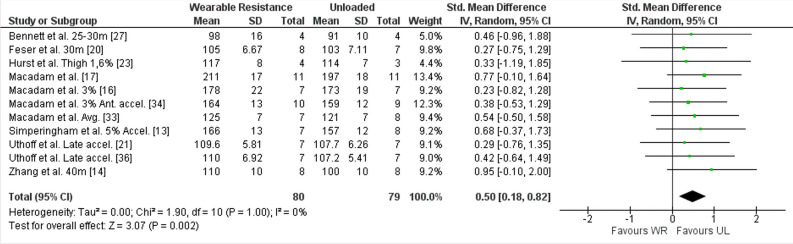
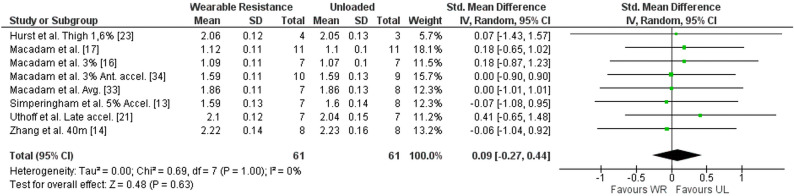
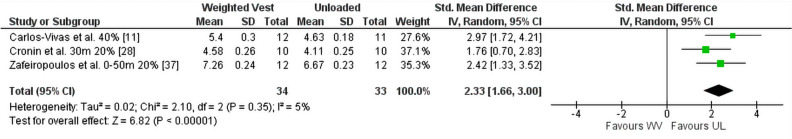
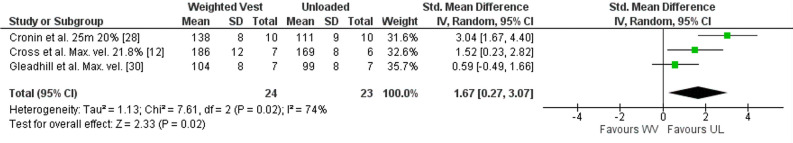
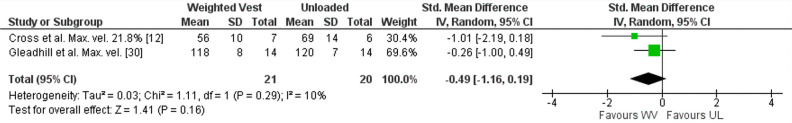
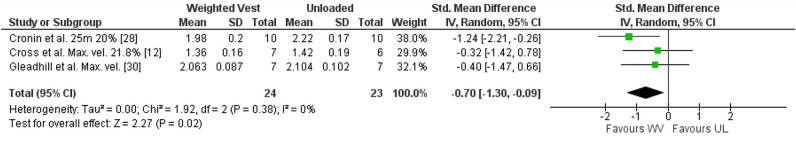
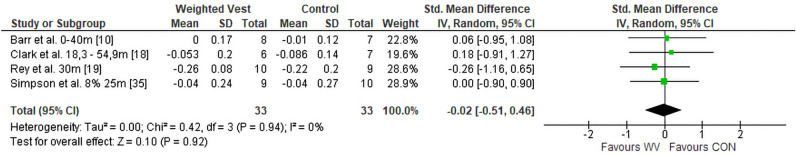
Wearable resistance (WR) and weighted vests (WV) can be used in almost all training conditions to enhance sprint performance; however, positioning and additional mass are different in WV and WR strategies, affecting performance and kinematics differently. We aimed to systematically review the literature, searching for intervention studies that reported the acute or chronic kinematic and performance impact of WV and WR and comparing them. We analyzed Pubmed, Embase, Scopus, and SPORTDiscuss databases for longitudinal and cross-over studies investigating sprint performance or kinematics using an inverse-variance with a random-effect method for meta-analysis. After the eligibility assessment, 25 studies were included in the meta-analysis. Cross-over WR and WV studies found significantly higher sprint times and higher ground contact times (CT) compared to unloaded (UL) conditions. However, WR presented a lower step frequency (SF) compared to UL, whereas WV presented a lower step length (SL). Only one study investigated the chronic adaptations for WR, indicating a superiority of the WR group on sprint time compared to the control group. However, no difference was found chronically for WV regarding sprint time, CT, and flight time (FT). Our findings suggest that using WV and WR in field sports demonstrates overload sprint gesture through kinematic changes, however, WR can be more suitable for SF-reliant athletes and WV for SL-reliant athletes. Although promising for chronic performance improvement, coaches and athletes should carefully consider WV and WR use since there is no supporting evidence that WV or WR will impact sprint performance, CT, and FT.
© 2024. The Author(s).
Conflict of interest statement
The authors declare no competing interests.
Figures


Similar articles
-
Acute Kinematic and Kinetic Adaptations to Wearable Resistance During Sprint Acceleration.J Strength Cond Res. 2017 May;31(5):1297-1304. doi: 10.1519/JSC.0000000000001596. J Strength Cond Res. 2017. PMID: 27548784 Clinical Trial.
-
The effects of lower limb wearable resistance on sprint running performance: A systematic review.Eur J Sport Sci. 2020 Apr;20(3):394-406. doi: 10.1080/17461391.2019.1629631. Epub 2019 Jul 2. Eur J Sport Sci. 2020. PMID: 31177935
-
Thigh positioned wearable resistance affects step frequency not step length during 50 m sprint-running.Eur J Sport Sci. 2020 May;20(4):444-451. doi: 10.1080/17461391.2019.1641557. Epub 2019 Jul 25. Eur J Sport Sci. 2020. PMID: 31282306
-
Acute changes in acceleration phase sprint biomechanics with lower body wearable resistance.Sports Biomech. 2022 Nov;21(10):1176-1188. doi: 10.1080/14763141.2020.1743349. Epub 2020 Apr 20. Sports Biomech. 2022. PMID: 32308138
-
Acute and longitudinal effects of weighted vest training on sprint-running performance: a systematic review.Sports Biomech. 2022 Mar;21(3):239-254. doi: 10.1080/14763141.2019.1607542. Epub 2019 May 9. Sports Biomech. 2022. PMID: 31070108
Cited by
-
Effects of wearable resistance training on linear sprinting and jumping abilities in healthy populations: a systematic review and three-level meta-analysis.Front Physiol. 2025 Jun 18;16:1590866. doi: 10.3389/fphys.2025.1590866. eCollection 2025. Front Physiol. 2025. PMID: 40606227 Free PMC article. Review.
-
Impacts of Wearable Resistance Placement on Running Efficiency Assessed by Wearable Sensors: A Pilot Study.Sensors (Basel). 2024 Jul 7;24(13):4399. doi: 10.3390/s24134399. Sensors (Basel). 2024. PMID: 39001178 Free PMC article.
References
-
- Cronin J, Ogden T, Lawton T, Brughelli M. Does Increasing Maximal Strength Improve Sprint Running Performance? Strength Cond. J. 2007;29:86–95. doi: 10.1519/00126548-200706000-00014. - DOI
-
- Rodríguez-Rosell D, Torres-Torrelo J, Franco-Márquez F, González-Suárez JM, González-Badillo JJ. Effects of light-load maximal lifting velocity weight training vs. combined weight training and plyometrics on sprint, vertical jump and strength performance in adult soccer players. J. Sci. Med. Sport. 2017;20:695–699. doi: 10.1016/j.jsams.2016.11.010. - DOI - PubMed
Publication types
MeSH terms
Grants and funding
LinkOut - more resources
Full Text Sources
