. 2024 Mar 5;7(1):268.
doi: 10.1038/s42003-024-05960-w.

EVATOM: an optical, label-free, machine learning assisted embryo health assessment tool

Affiliations

EVATOM: an optical, label-free, machine learning assisted embryo health assessment tool

Neha Goswami et al. Commun Biol. .

Abstract

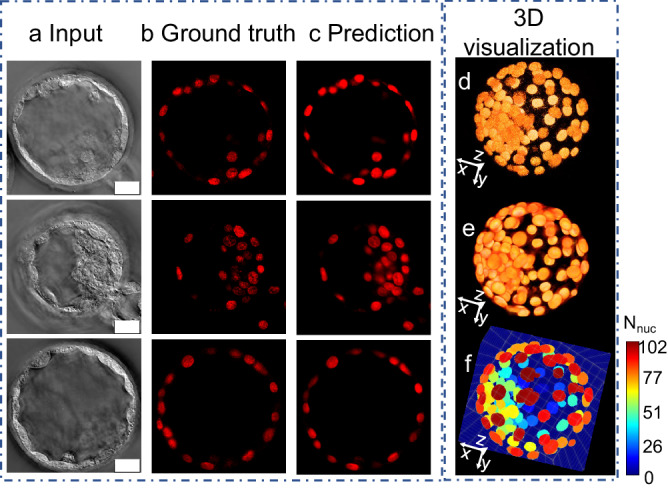
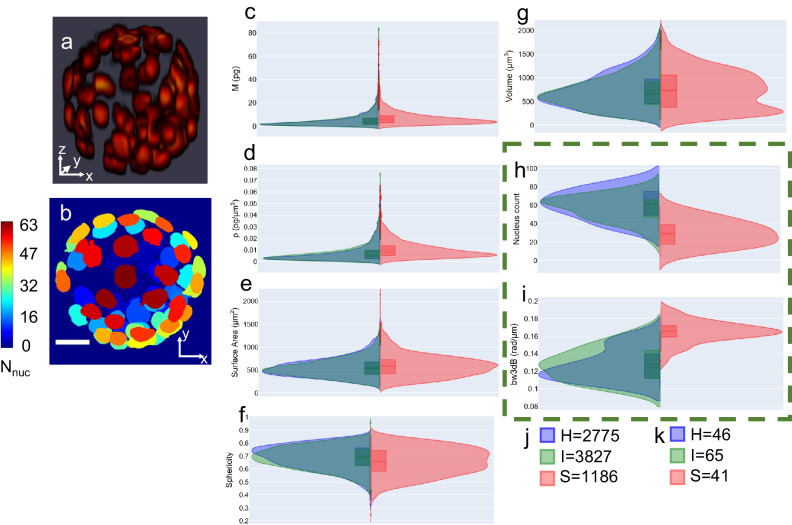
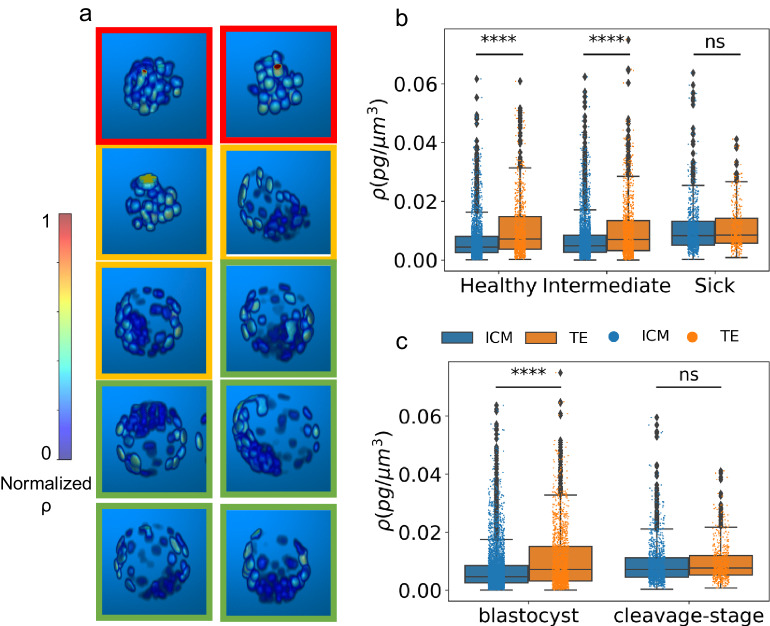
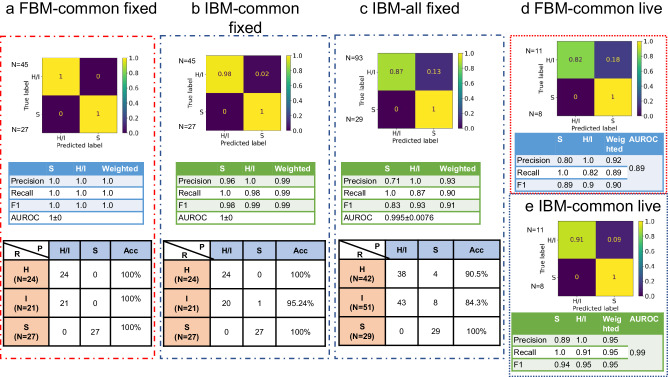
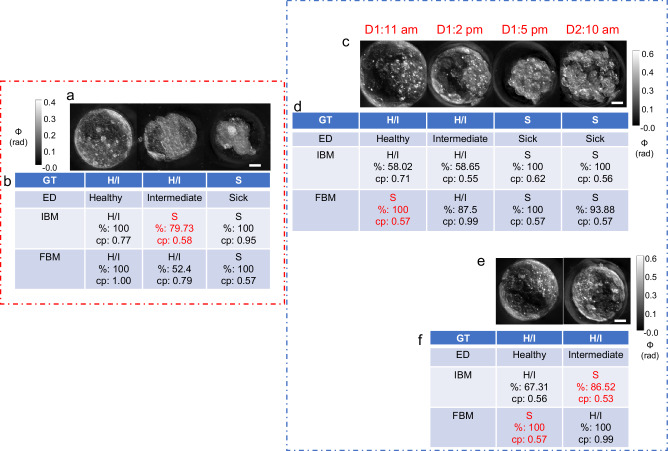
The combination of a good quality embryo and proper maternal health factors promise higher chances of a successful in vitro fertilization (IVF) procedure leading to clinical pregnancy and live birth. Of these two factors, selection of a good embryo is a controllable aspect. The current gold standard in clinical practice is visual assessment of an embryo based on its morphological appearance by trained embryologists. More recently, machine learning has been incorporated into embryo selection "packages". Here, we report EVATOM: a machine-learning assisted embryo health assessment tool utilizing an optical quantitative phase imaging technique called artificial confocal microscopy (ACM). We present a label-free nucleus detection method with, to the best of our knowledge, novel quantitative embryo health biomarkers. Two viability assessment models are presented for grading embryos into two classes: healthy/intermediate (H/I) or sick (S) class. The models achieve a weighted F1 score of 1.0 and 0.99 respectively on the in-distribution test set of 72 fixed embryos and a weighted F1 score of 0.9 and 0.95 respectively on the out-of-distribution test dataset of 19 time-instances from 8 live embryos.


Conflict of interest statement

The authors declare the following competing interests: G.P. had financial interests in Phi Optics Inc, a QPI instrument manufacturer. All other authors declare no competing interests.

Figures

Fig. 1
Fig. 1. Workflow.
a ACM system setup, NP: Nomarski prism, OL: objective lens, CL: condenser lens, LCVR: liquid crystal variable retarder, BS: beamsplitter, P: pinhole, EFW: emission filter wheel, SM1/SM2: scanning mirrors, A: analyzer, S: sample, CD: confocal detector, L: laser source, TPMT: transmission photomultiplier tube, blue dotted box depicts the LS-GLIM module, red dotted box depicts the DIC microscope without analyzer, and green dotted box depicts the confocal module. b Final GLIM image. c Corresponding fluorescence image stained for nuclei identification in the embryo slice shown in (b). d Deep learning modules: 1: Nucleus prediction model (NPM), 2: Feature-based health grading model (FBM), 3: Image-based health grading model (IBM). e Composite of nucleus prediction, f 3D rendering from 2D predictions and corresponding segmentation labels per nuclei with a colorbar showing the number of nuclei detected in the embryo, g An example of extracted nuclei features with histograms (dry mass M, dry mass density ρ, volume V). h Health grading of embryos by IBM and FBM, with the example embryo assigned to the Healthy/Intermediate class because of the % nuclei/z-slices predicted as H/I is >50%. Scalebars are shown as white rectangles in lower right corner of images in (b) and (c) and denote 20 µm. Colorbar in (b) represents optical phase distribution (ϕ) in radians.
Fig. 2
Fig. 2. Nucleus prediction model results and 3D visualization.
a Input LS-GLIM z slice, b Corresponding ground truth fluorescence image marking the nuclei, c Model prediction. d 3D stacked ground truth, e 3d stacked prediction, f 3d instance segmentation labels. Scalebar is shown as white rectangles in lower right corner of images in (a), denotes 20 µm, and applies to all images in (a), (b), and (c). The colorbar shows the number of nuclei detected in the embryo.
Fig. 3
Fig. 3. 3D segmentation and related features.
a Stacked model predictions, b maximum projection along z-axis of the labeled volume in (a). showing the number of nuclei in the embryo. The colorbar shows the number of nuclei detected in the embryo, ci Violin plots showing the kernel density plots and enclosed box plots for nuclear dry mass, nuclear dry-mass density, nuclear surface area, nuclear sphericity, nuclear volume, embryo-wise nucleus count, and embryo-wise 3 dB power bandwidth of scattering amplitude spectrum for 152 embryos grouped by health classes: Healthy (H) (blue), Intermediate (I) (green) and Sick (S) (red) class. For nuclei level parameters the number of nuclei in the three classes are shown in (j) and for the embryo level features (enclosed in green dashed box) the number of embryos per class are shown in (k). z-height of the embryo in (a) and (b) is 91 µm. Scalebar is shown as white rectangle in lower left corner of image for (b) is 20 µm. Statistics are presented in Supplementary Table 1. Solid lines inside the boxplots represent median and dotted lines represent mean values, whiskers extend to the maximum and minimum data point within 1.5 times the inter quartile range (1.5*IQR) from the respective quartile (box edge).
Fig. 4
Fig. 4. Mean nuclear dry-mass density distribution.
a 3D reconstructions of normalized mean nuclear dry mass density map for selected embryos from Supplementary Fig. 6, enclosed by red boxes (sick), orange boxes (intermediate), and green boxes (healthy). b Mean nuclear dry mass density differences between TE versus ICM nuclei for healthy, intermediate, and sick class of embryos, showing significant differences for healthy (p = 3.41e−27, with 768 TE and 2007 ICM nuclei), and intermediate class (p = 2.71e−20, with 1019 TE and 2808 ICM nuclei), but nonsignificant (ns) differences for sick class (p = 0.071, with 340 TE and 846 ICM nuclei). c Mean nuclear dry mass density differences between TE versus ICM nuclei for blastocyst and cleavage-stage embryos, showing significant differences for blastocyst (p = 8.11e−39, with 1570 TE and 4538 ICM nuclei), but nonsignificant (ns) differences for cleavage stage embryos (p = 0.0105, with 557 TE and 1123 ICM nuclei), with significance threshold alpha set at p = 0.0001 for both (b) and (c). Kruskal Wallis non-parametric test was performed to determine statistical significance. A total of 152 embryos were analyzed for (b) and (c). Colorbar in a represents normalized mean nuclear dry mass density. Median value is represented by the line inside each box, whiskers extend to the maximum and minimum data point within 1.5 times the inter quartile range (1.5*IQR) from the respective quartile (box edge), with outliers represented by black dots. Raw data is overlayed as colored dots as per the legend.
Fig. 5
Fig. 5. Health grading model performance-confusion matrix, performance metrics and real-class wise performance for.
a FBM for common test set of 72 embryos, b IBM for common test set of 72 embryos, c IBM for extended data of 122 embryos, d FBM for live embryos (19 instances), and e IBM for live embryos (19 instances). R denotes the real class assigned by expert (healthy (H), intermediate (I) and sick (S)) and P denotes the model predicted class (H/I and S), N denotes the number of embryos per class, Acc denotes the accuracy per real class.
Fig. 6
Fig. 6. Health grading of embryos.
a LS-GLIM composite images from common test set of fixed embryos, b Model predictions on test embryos in (a). c Time-lapse LS-GLIM composite images from common test set of live embryos, d Model predictions on test embryo in (c). e LS-GLIM composite images from common test set of live embryos showing two different embryos, f Model predictions on test embryos in (e). Red entries in (b), (d), and (f) represent wrong predictions. Colorbars show phase distribution (ϕ) in radians. Scalebar is shown as a white rectangle in the lower right corner of each row of images and denotes 20 µm for all images. GT: ground truth class, ED: real class assigned by experts, IBM: image-based classification model, FBM: feature-based classification model. H/I: healthy or intermediate class, S: sick class. cp: average prediction score over majority predictions, % denotes percentage of majority predictions (z-slices for IBM and nuclei for FBM). D1, D2: Days of time-lapse followed by timestamps of acquisition. Red dotted box encloses data from fixed embryos while blue dotted box encloses data from live embryos.

References

    1. Perkel KJ, Tscherner A, Merrill C, Lamarre J, Madan P. The ART of selecting the best embryo: a review of early embryonic mortality and bovine embryo viability assessment methods. Mol. Reprod. Dev. 2015;82:822–838. doi: 10.1002/mrd.22525. - DOI - PubMed
    1. Gardner D, Sakkas D. Assessment of embryo viability: the ability to select a single embryo for transfer—a review. Placenta. 2003;24:S5–S12. doi: 10.1016/S0143-4004(03)00136-X. - DOI - PubMed
    1. Machtinger R, Racowsky C. Morphological systems of human embryo assessment and clinical evidence. Reprod. Biomed. Online. 2013;26:210–221. doi: 10.1016/j.rbmo.2012.10.021. - DOI - PubMed
    1. Santos Filho E, Noble JA, Wells D. A review on automatic analysis of human embryo microscope images. open Biomed. Eng. J. 2010;4:170. doi: 10.2174/1874120701004010170. - DOI - PMC - PubMed
    1. Zaninovic N, Rosenwaks Z. Artificial intelligence in human in vitro fertilization and embryology. Fertil. Steril. 2020;114:914–920. doi: 10.1016/j.fertnstert.2020.09.157. - DOI - PubMed

Publication types