. 2024 Apr;21(4):692-702.
doi: 10.1038/s41592-024-02188-8. Epub 2024 Mar 5.

Improved green and red GRAB sensors for monitoring spatiotemporal serotonin release in vivo

Affiliations

Improved green and red GRAB sensors for monitoring spatiotemporal serotonin release in vivo

Fei Deng et al. Nat Methods. 2024 Apr.

Abstract

The serotonergic system plays important roles in both physiological and pathological processes, and is a therapeutic target for many psychiatric disorders. Although several genetically encoded GFP-based serotonin (5-HT) sensors were recently developed, their sensitivities and spectral profiles are relatively limited. To overcome these limitations, we optimized green fluorescent G-protein-coupled receptor (GPCR)-activation-based 5-HT (GRAB5-HT) sensors and developed a red fluorescent GRAB5-HT sensor. These sensors exhibit excellent cell surface trafficking and high specificity, sensitivity and spatiotemporal resolution, making them suitable for monitoring 5-HT dynamics in vivo. Besides recording subcortical 5-HT release in freely moving mice, we observed both uniform and gradient 5-HT release in the mouse dorsal cortex with mesoscopic imaging. Finally, we performed dual-color imaging and observed seizure-induced waves of 5-HT release throughout the cortex following calcium and endocannabinoid waves. In summary, these 5-HT sensors can offer valuable insights regarding the serotonergic system in both health and disease.


Conflict of interest statement

Competing interests

The authors declare no competing interests.

Figures

Extended Data Fig. 1 |
Extended Data Fig. 1 |. Characterization of GRAB5-HT sensors in HEK293T cells and cultured rat cortical neurons.
Extended Data Fig. 2 |
Extended Data Fig. 2 |. Specificity of 5-HT sensors.
Extended Data Fig. 3 |
Extended Data Fig. 3 |. Comparison of single GFP-based 5-HT sensors in cultured rat cortical neurons.
Extended Data Fig. 4 |
Extended Data Fig. 4 |. Expression of GRAB5-HT sensors shows minimal buffering effects.
Extended Data Fig. 5 |
Extended Data Fig. 5 |. Dual-color imaging of 5-HT and DA dynamics in acute mouse brain slices with high spatial-temporal resolution.
Extended Data Fig. 6 |
Extended Data Fig. 6 |. Representative r5-HTmut and GCaMP6s signals during the sleep-wake cycle in freely moving mice.
Extended Data Fig. 7 |
Extended Data Fig. 7 |. Comparison of gGRAB5-HT3.0 and other green 5-HT sensors during the sleep-wake cycle in freely moving mice.
Extended Data Fig. 8 |
Extended Data Fig. 8 |. Comparison of gGRAB5-HT3.0 and other green 5-HT sensors during reward and tone delivery.
Extended Data Fig. 9 |
Extended Data Fig. 9 |. gGRAB5-HT3.0 reveals 5-HT dynamics in mouse dorsal cortex in vivo.
Extended Data Fig. 10 |
Extended Data Fig. 10 |. Mesoscopic imaging of 5-HT, Ca2+ and eCB waves during seizures.
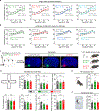
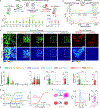
Fig. 1 |
Fig. 1 |. Development of improved green fluorescent 5-HT sensors and red 5-HT sensors.
a, Schematic illustrating the strategy for developing GRAB5-HT sensors (top). Performance of sensor candidates based on different receptor subtypes for green (bottom left) and red 5-HT sensors (bottom right). The dashed horizontal line represents g5-HT1.0 response (bottom left), and the best candidates in green and red sensors are denoted by enlarged green and pink dots, respectively. b, Optimization of the replacement site, linker, cpFP and GPCR. Responses to 10 μM 5-HT of various candidates are presented, and different versions are indicated with enlarged dots. c, Representative images of sensors’ expression (top, with 5-HT) and response (bottom) to 5-HT in HEK293T cells. Insets with white dashed outlines in images have either enhanced contrast (top) or different pseudocolor scales (bottom). 100 μM 5-HT for green sensors and 10 μM 5-HT for red sensors. Similar results were observed for more than 50 cells. Scale bar, 20 μm. d, Group summary of the brightness (left), peak ΔF/F0 (middle) and SNR (right) of different 5-HT sensors. The SNR of all sensors were relative to g5-HT1.0; a.u., arbitrary units, the basal brightness of g5-HT1.0 is set as 1. n = 119 cells from 3 coverslips (hereafter denoted as 119/3) for g5-HT3.0, 82/3 for g5-HT1.0, 64/3 for PsychLight2, 139/3 for iSeroSnFR, 92/3 for g5-H3.0mut, 159/5 for r5-HT1.0 and 191/5 for r5-HTmut; 100 μM 5-HT for green sensors and 10 μM 5-HT for red sensors. (One-way ANOVA followed by Tukey’s multiple-comparison tests for green sensors; for peak ΔF/F0, F4,491 = 387.1, P = 2.76 × 10−150, post hoc test: P = 0, 4.15 × 10⁻⁹, 0 and 0 for g5-HT3.0 versus other sensors; for relative SNR, F4,491 = 285.7, P = 1.13 × 10−126, post hoc test: P = 5.62 × 10⁻⁷, 2.22 × 10⁻⁸, 7.33 × 10⁻⁸ and 4 × 10⁻⁹ for g5-HT3.0 versus other sensors. Two-tailed Student’s t-test for r5-HT1.0 and r5-HTmut; for peak ΔF/F0, P = 3.13 × 10−72; for relative SNR, P = 2.67 × 10−43.) e, Dose-response curves of different 5-HT sensors. n = 3 wells for each sensor with 300–500 cells per well. f, Schematic illustrates the photoactivation properties of jRGECO1a and r5-HT1.0 (left), representative traces (middle) and group summary of peak ΔF/F0 (right) in response to blue light (488 nm, without imaging) in cells expressing jRGECO1a or r5-HT1.0. n = 105/4 for jRGECO1a and 88/4 for r5-HT1.0. (Two-tailed Student’s t-test, P = 2.07 × 10−48). Data are shown as mean ± SEM in d–f, with the error bars or shaded regions indicating the SEM, ***P < 0.001.
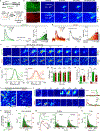
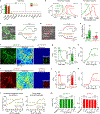
Fig. 2 |
Fig. 2 |. Characterization of 5-HT sensors in HEK293T cells and cultured rat cortical neurons.
a, Normalized ΔF/F0 of g5-HT3.0 and r5-HT1.0 in response to different compounds (each at 10 μM except RS at 100 μM). 5-HTP, 5-hydroxytryptophan; 5-HIAA, 5-hydroxyindole acetic acid; DA, dopamine; NE, norepinephrine; HA, histamine; MT, melatonin; OA, octopamine; Glu, glutamate; GABA, gamma-aminobutyric acid; ACh, acetylcholine; Gly, glycine. Norm., normalized. n = 3 wells per group, 200–500 cells per well. (One-way ANOVA followed by Tukey’s multiple-comparison tests, for g5-HT3.0, F13,28 = 745.7, P = 5.74 × 10⁻³², post hoc test: P = 0 for 5-HT versus 5-HT and RS, and other compounds; for r5-HT1.0, F13,28 = 180.6, P = 2.02 × 10⁻²³, post hoc test: P = 0 for 5-HT versus 5-HT and RS, and other compounds.) b, One-photon excitation (Ex) and emission (Em) spectra and two-photon excitation spectra of g5-HT3.0 and r5-HT1.0 in the absence (dashed line) and presence of 10 μM 5-HT (solid line). F.I., fluorescence intensity. c–e, Kinetic of g5-HT3.0 and r5-HT1.0 in cultured HEK293T cells. Illustration of the local puffing system (c,d, left). Representative traces of sensor fluorescence increase to 5-HT puffing (c,d, top right) and decrease to RS puffing (c,d, bottom right). Group summary of on and off kinetics (e). n = 10 cells from 3 coverslips (short for 10/3) for g5-HT3.0 on kinetics, 12/4 for g5-HT3.0 off kinetics, 9/3 for r5-HT1.0 on kinetics, 12/4 for r5-HT1.0 off kinetics. f, Representative images showing the expression and responses of g5-HT3.0 and g5-HT3.0mut to 100 μM 5-HT in cultured rat cortical neurons. The inset in the g5-HT3.0mut response image shows the contrast-enhanced expression image. g, Representative traces and peak response summary of g5-HT3.0 and g5-HT3.0mut in response to 100 μM 5-HT. n = 96 regions of interest (ROIs) from 5 coverslips (short for 96/5) for g5-HT3.0 and 92/5 for g5-HT3.0mut. (Two-tailed Student’s t-test, P = 1.40 × 10−53 for g5-HT3.0 versus g5-HT3.0mut.) h, The dose-response curve of g5-HT3.0. n = 76/4. i, Representative images showing the expression and responses of r5-HT1.0 and r5-HTmut to 10 μM 5-HT. j, Representative traces and peak response summary of r5-HT1.0 and r5-HTmut in response to 10 μM 5-HT. n = 80/4 for r5-HT1.0 and 60/3 for r5-HTmut. (Two-tailed Student’s t-test, P = 4.46 × 10−70 for r5-HT1.0 versus r5-HTmut.) k, The dose-response curve of r5-HT1.0. n = 80/4. l, Downstream coupling tests. WT, wild type; Ctrl, control, without expression of wild type 5-HTR4 or sensors; a.u., arbitrary units. n = 3 wells per group, 200–500 cells per well. (One-way ANOVA followed by Tukey’s multiple-comparison tests, for luciferase complementation assay, F3,8 = 256, P = 2.77 × 10⁻⁸, post hoc test: P = 0 and 0.37 for g5-HT3.0 versus 5-HTR4 (WT) and Ctrl in 1 mM 5-HT, respectively, P = 0 and 1 for r5-HT1.0 versus 5-HTR4 (WT) and Ctrl, respectively; for Tango assay, F3,8 = 766.4, P = 3.55 × 10⁻¹⁰, post hoc test: P = 0 and 0.89 for g5-HT3.0 versus 5-HTR4 (WT) and Ctrl in 100 μM 5-HT, respectively, P = 0 and 0.86 for r5-HT1.0 versus 5-HTR4 (WT) and Ctrl, respectively.) m, Normalized ΔF/F0 of g5-HT3.0 and r5-HT1.0 in response to the 2-h application of 10 μM 5-HT, followed by 100 μM RS. n = 3 wells for each sensor. (One-way repeated measures ANOVA followed by Tukey’s multiple-comparison tests, for g5-HT3.0, F = 359.8, P = 0.034, post hoc test: P = 1.29 × 10⁻⁶ for baseline versus 0 h, P = 1.76 × 10⁻⁶ for 2.0 h versus RS, P = 1, 0.77, 1, 1 for 0 h versus 0.5 h, 1 h, 1.5 h or 2.0 h, respectively; for r5-HT1.0, F = 250.9, P = 0.04, post hoc test: P = 2.85 × 10⁻⁶ for baseline versus 0 h, P = 5.82 × 10⁻⁶ for 2.0 h versus RS, P = 0.95, 0.44, 0.66, 0.64 for 0 h versus 0.5 h, 1 h, 1.5 h or 2.0 h, respectively.) a–e and l tested in HEK293T cells; f–k and m tested in cultured rat cortical neurons. All scale bar, 20 μm. Data are shown as mean ± SEM in a,e,g,h,j–m, with the error bars or shaded regions indicating the SEM. ***P < 0.001, n.s., not significant.
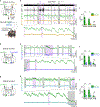
Fig. 3 |
Fig. 3 |. Red GRAB5-HT sensor can monitor endogenous 5-HT release in freely moving mice.
a, Schematic depicting the fiber-photometry recording setup using red 5-HT sensors with optogenetic activation of DRN in Sert-Cre mice. b, Representative ΔF/F0 traces of r5-HT1.0 and r5-HTmut in response to optical stimulation in the DRN under different stimulation durations before or after fluoxetine (FLX) application. Blue shading, period for 488-nm stimulation. c, Average ΔF/F0 traces of r5-HT1.0 and r5-HTmut under different stimulation durations in an example mouse. d, Summarized peak responses of r5-HT1.0 and r5-HTmut under different stimulation durations. n = 6 mice for each treatment. (Two-tailed Student’s t-tests, for r5-HTmut versus r5-HT1.0, P = 0.030, 0.052, 0.041 under 1 s, 5 s, 10 s stimulation, respectively; for r5-HTmut versus r5-HT1.0+FLX, P = 0.016, 0.034, 0.033 under 1 s, 5 s, 10 s stimulation, respectively.) e, Summarized decay kinetics of r5-HT1.0 with or without FLX application under different stimulation durations. n = 6 mice for each treatment. (Two-tailed paired t-tests for r5-HT1.0 and r5-HT1.0 + FLX, P = 4.44 × 10⁻⁴, 1.44 × 10⁻², 3.19 × 10⁻² for 1 s, 5 s and 10 s stimulation, respectively.) f, Schematic showing the setup for dual-color recording of r5-HT1.0 or r5-HTmut and GCaMP6s (G6s) during sleep-wake cycles. g, Representative traces of simultaneous EEG, EMG, r5-HT1.0, and G6s recording during sleep-wake cycles in freely behaving mice. Pink shading, wake state; gray shading, REM sleep. h, Zoom-in traces of r5-HT1.0 and G6s (from g) or r5-HTmut and G6s (mainly during the NREM sleep). i, The average cross-correlation between r5-HT1.0 and G6s signals during sleep-wake cycles. j, Average responses of 5-HT sensors (red channel, r5-HT1.0 or r5-HTmut) and G6s (green channel). n = 4 mice for each group. (Two-way repeated measures ANOVA followed by Tukey’s multiple-comparison tests; for r5-HT1.0 versus r5-HTmut, post hoc test: P = 5.65 × 10⁻³, 9.22 × 10⁻³ and 0.47 during wake, NREM and REM sleep state, respectively; for G6s (with r5-HT1.0) versus G6s (with r5-HTmut), post hoc test: P = 0.56, 0.11 and 0.71 during wake, NREM and REM sleep state, respectively.) Data are shown as mean ± SEM in c–e,i,j, with the error bars or shaded regions indicating the SEM, *P < 0.05, **P < 0.01, ***P < 0.001, n.s., not significant.
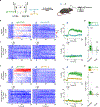
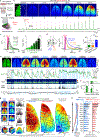
Fig. 4 |
Fig. 4 |. gGRAB5-HT3.0 reveals 5-HT release in mouse dorsal cortex in vivo by mesoscopic imaging.
a, Schematic depicting the mesoscopic imaging experiments. b, Representative images showing the cortical g5-HT3.0 expression and response to optical stimulation in the DRN with incremental frequencies (top). Representative traces of g5-HT3.0 and a negative control memEGFP (bottom). The dashed white outline indicates the ROI. c, Representative ΔF/F0 traces of g5-HT3.0 (left) and group data of peak response (right) with increased frequencies of 635 nm laser. n = 3 mice for each group. (Two-tailed Student’s t-tests, P = 8.48 × 10⁻³ for g5-HT3.0 versus memEGFP under 50 Hz stimulation.) d, Schematic illustrating the effect of SERT blocker and DAT blocker on extracellular 5-HT level (left). Representative ΔF/F0 traces of g5-HT3.0 (middle) and summary data of decay kinetics (right) during 50 Hz 10 s stimulation after treatment with indicated compounds. (One-way repeated measures ANOVA followed by Tukey’s multiple-comparison tests, F = 28.9, P = 4.18 × 10⁻³, post hoc test: P = 0.98 for DAT blocker versus control, 6.45 × 10⁻³ for SERT blocker versus control and 5.72 × 10⁻³ for SERT blocker versus DAT blocker.) e, Representative fluorescence and pseudocolor images of g5-HT3.0 during sleep-wake cycles (top). Representative traces of g5-HT3.0 response, EEG, EMG (by root mean square, RMS) and g5-HT3.0mut response in the dorsal cortex during sleep-wake cycles (bottom). The dashed white outline in the top left image indicates the ROI. Dashed arrows and red circles indicate the timepoint of frames shown at the top. Gray shading, REM sleep; light blue shading, wake state. f, Group data of g5-HT3.0 and g5-HT3.0mut responses in mice during the awake state, NREM and REM sleep. n = 5 mice for g5-HT3.0 and 3 mice for g5-HT3.0mut. (Two-way repeated measures ANOVA followed by Tukey’s multiple-comparison tests for g5-HT3.0 and g5-HT3.0mut, P = 5.77 × 10⁻⁶, 1.89 × 10⁻³ and 1 during the wake, NREM and REM sleep state, respectively.) g, Snapshots of g5-HT3.0 responses in different mice in the awake state and DRN activation, and serotonergic projection map modified from Allen Brain (left). Average pseudocolor images of g5-HT3.0 responses under indicated conditions (middle) and serotonergic projection map overlaid with black outlines aligned to the Allen Mouse Brain CCF (right). n = 5 and 3 mice for the awake state and DRN activation group, respectively. h, Average relative responses of g5-HT3.0 and serotonergic projection density along the anterior-to-posterior (AP) axis (left) and summary of g5-HT3.0 signals or serotonergic projection density in different cortex regions. n = 5 and 3 mice for the awake state and DRN activation group, respectively. All scale bar, 1 mm. Data are shown as mean ± SEM in c,d,f,h, with the error bars or shaded regions indicating the SEM, **P < 0.01, ***P < 0.001, n.s., not significant.
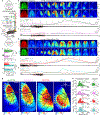
Fig. 5 |
Fig. 5 |. Dual-color imaging of cortex-wide neurochemical waves during seizures.
a, Schematic depicting the setup of dual-color mesoscopic imaging in a KA-induced seizure model. b, Representative images and ΔF/F0 traces of g5-HT3.0 and jRGECO1a during seizures. Two ROIs (500 μm in diameter) are labeled; ROI 1 (the white circle) and ROI 2 (the white dashed circle) show the maximum response regions of g5-HT3.0 and jRGECO1a, respectively. The solid and dashed lines in traces correspond to ROI 1 and ROI 2, respectively. The red shading in the EEG trace indicates the epileptic discharges. c, Representative ΔF/F0 traces of g5-HT3.0mut and jRGECO1a during seizures, similar to b, and images are showed in Extended Data Fig. 9b. d, Representative images and ΔF/F0 traces of r5-HT1.0 and eCB2.0 during seizures, similar to b, except that ROI 1 (the white circle) and ROI 2 (the white dashed circle) show the maximum response regions of r5-HT1.0 and eCB2.0, respectively. e, Representative traces of r5-HTmut and eCB2.0 signals during seizures, similar to d, and images are showed in Extended Data Fig. 9d. f, Group summary of different sensors’ peak responses. n = 5 mice for the group co-expressing g5-HT3.0 and jRGECO1a, n = 4 for g5-HT3.0mut and jRGECO1a, n = 3 for r5-HT1.0 and eCB2.0, n = 3 for r5-HTmut and eCB2.0. (Two-tailed Student’s t-tests, P = 2.36 × 10⁻⁴ for g5-HT3.0 versus g5-HT3.0mut, P = 0.64 for jRGECO1a between two groups; P = 4.41 × 10⁻³ for r5-HT1.0 versus r5-HTmut, P = 0.45 for eCB2.0 between two groups.) g, Representative images showing the wave propagation detected by indicated sensors. The red circle indicates the origin of waves; small white arrows indicate the wave-propagating velocity vector; green lines with arrow indicate example propagating trajectories. L, lateral, M, medial, A, anterior, P, posterior. h, Probability distributions of wave-propagating speed and direction calculated by indicated sensors. Scale bar in all images, 1 mm. Data are shown as mean ± SEM in f,h, with the error bars indicating the SEM, **P < 0.01, ***P < 0.001, n.s., not significant.

References

    1. Berger M, Gray JA & Roth BL The expanded biology of serotonin. Annu. Rev. Med. 60, 355–366 (2009). - PMC - PubMed
    1. Li Y et al. Serotonin neurons in the dorsal raphe nucleus encode reward signals. Nat Commun. 7, 10503 (2016). - PMC - PubMed
    1. Portas CM et al. On-line detection of extracellular levels of serotonin in dorsal raphe nucleus and frontal cortex over the sleep/wake cycle in the freely moving rat. Neuroscience 83, 807–814 (1998). - PubMed
    1. Lesch KP et al. Association of anxiety-related traits with a polymorphism in the serotonin transporter gene regulatory region. Science 274, 1527–1531 (1996). - PubMed
    1. Theodore WH, Juhasz C, Savic V & Drevets W Serotonin, depression, and epilepsy. Epilepsia 46, 3–3 (2005).

LinkOut - more resources