. 2024 Mar;26(3):353-365.
doi: 10.1038/s41556-024-01367-1. Epub 2024 Mar 5.

Distinct pathways drive anterior hypoblast specification in the implanting human embryo

Affiliations

Distinct pathways drive anterior hypoblast specification in the implanting human embryo

Bailey A T Weatherbee et al. Nat Cell Biol. 2024 Mar.

Abstract

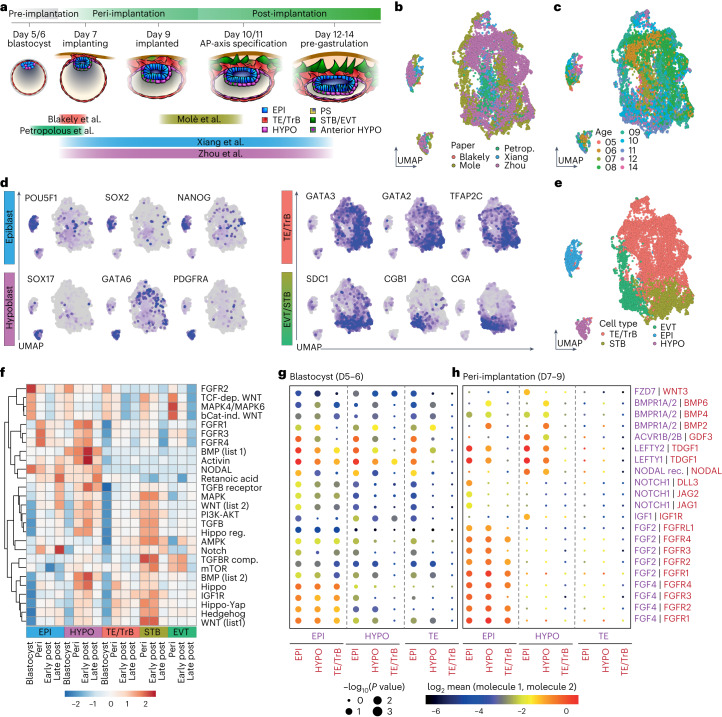
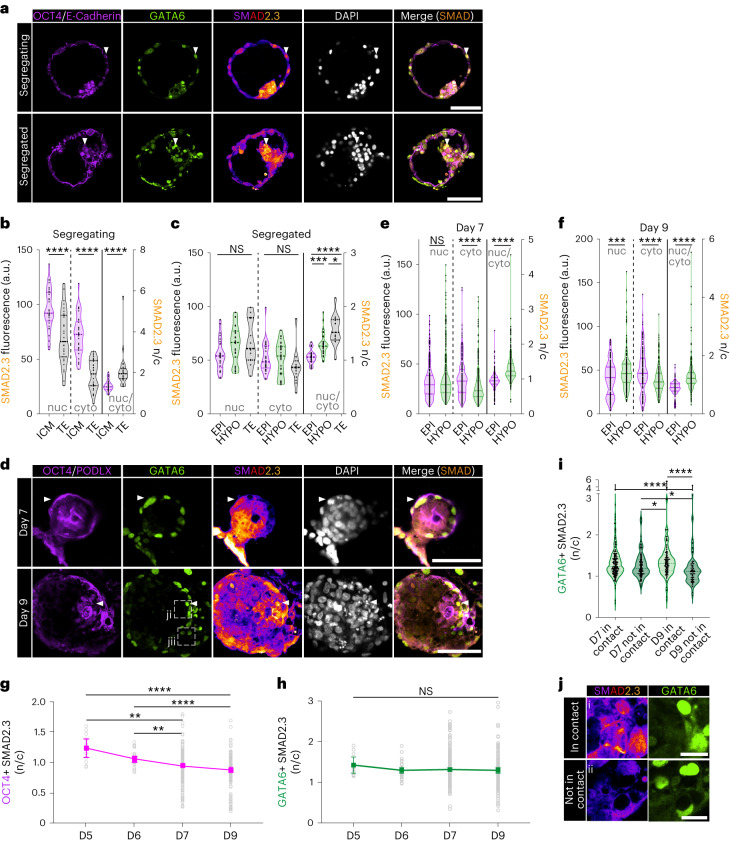
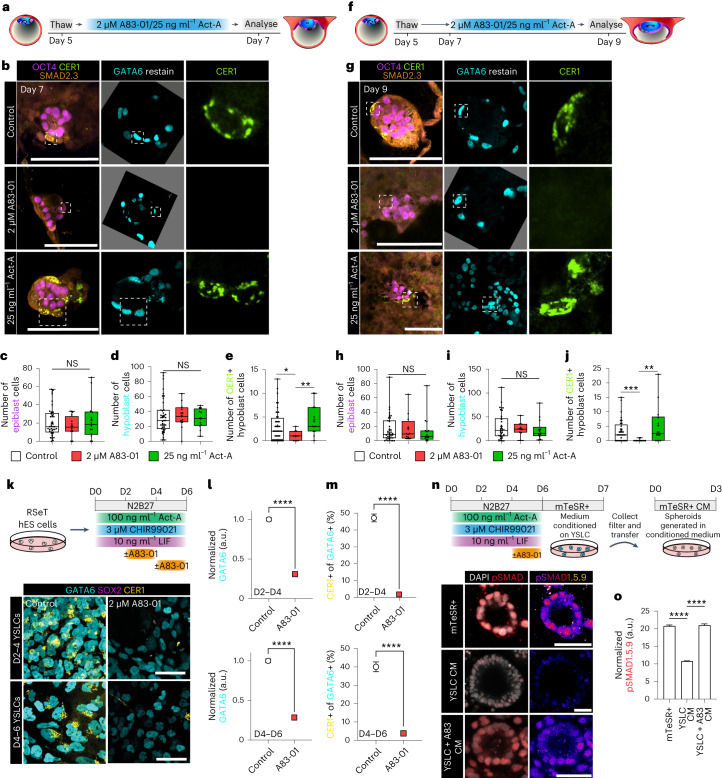
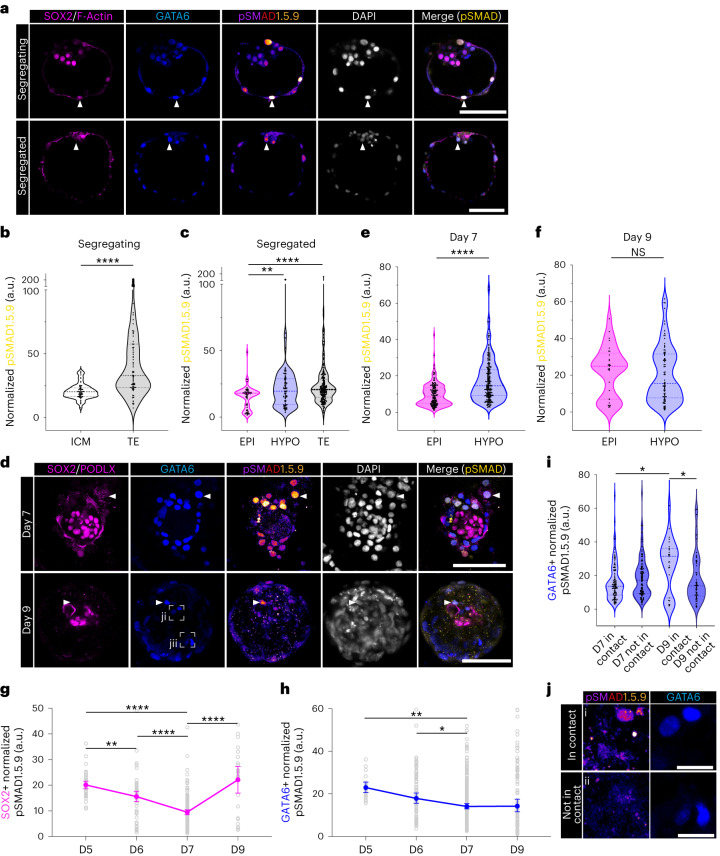
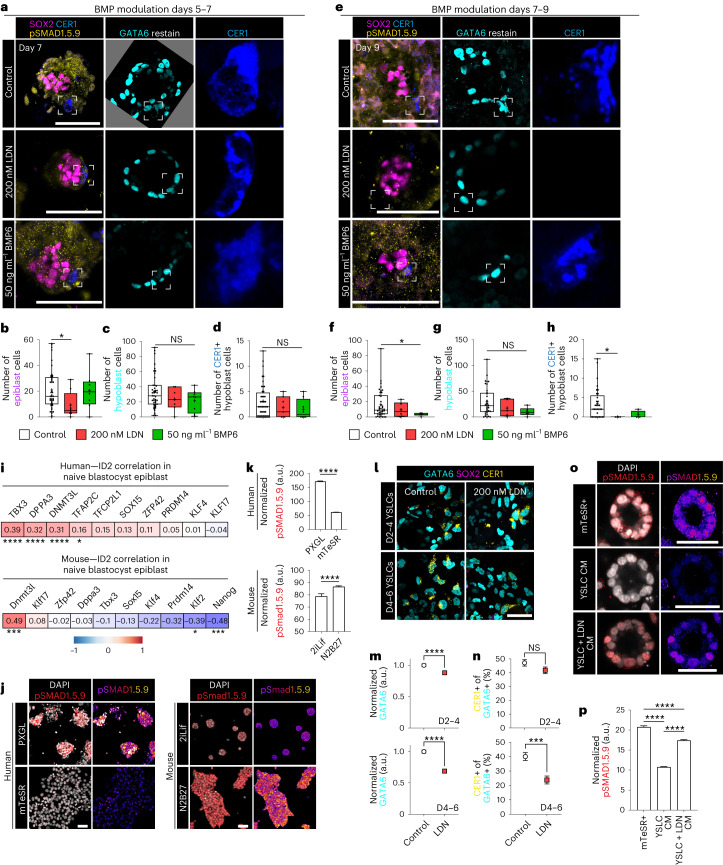
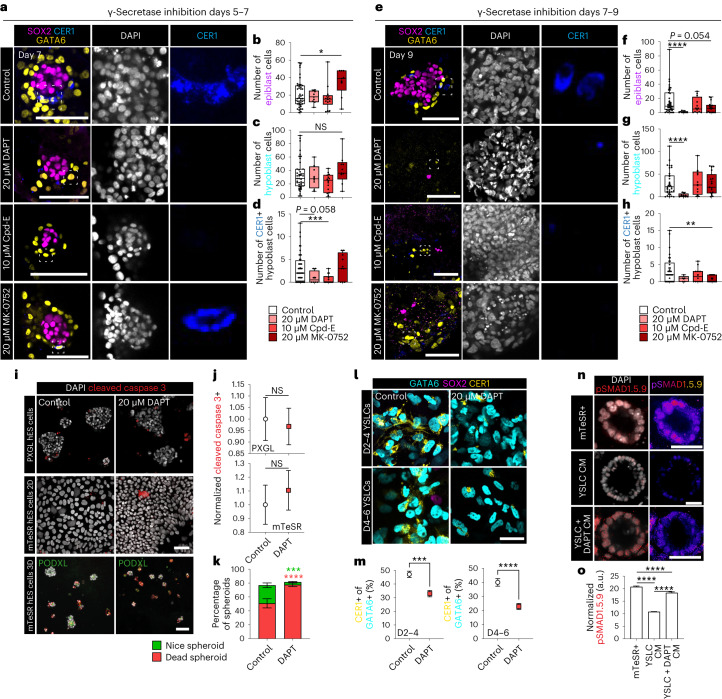
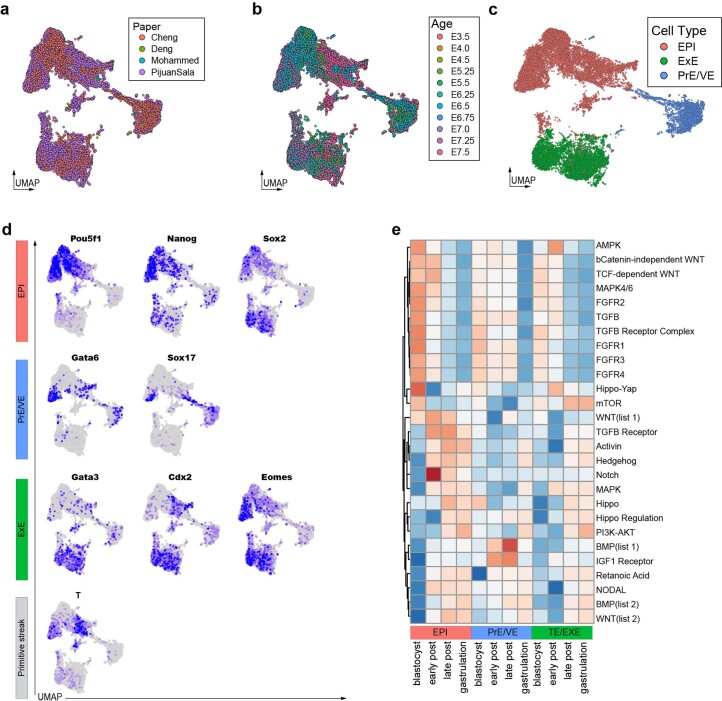
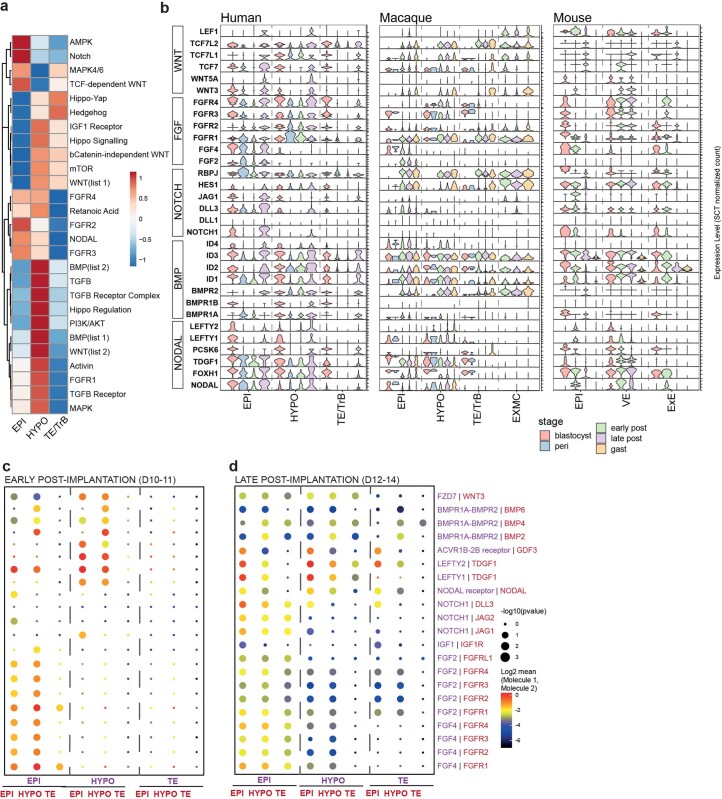
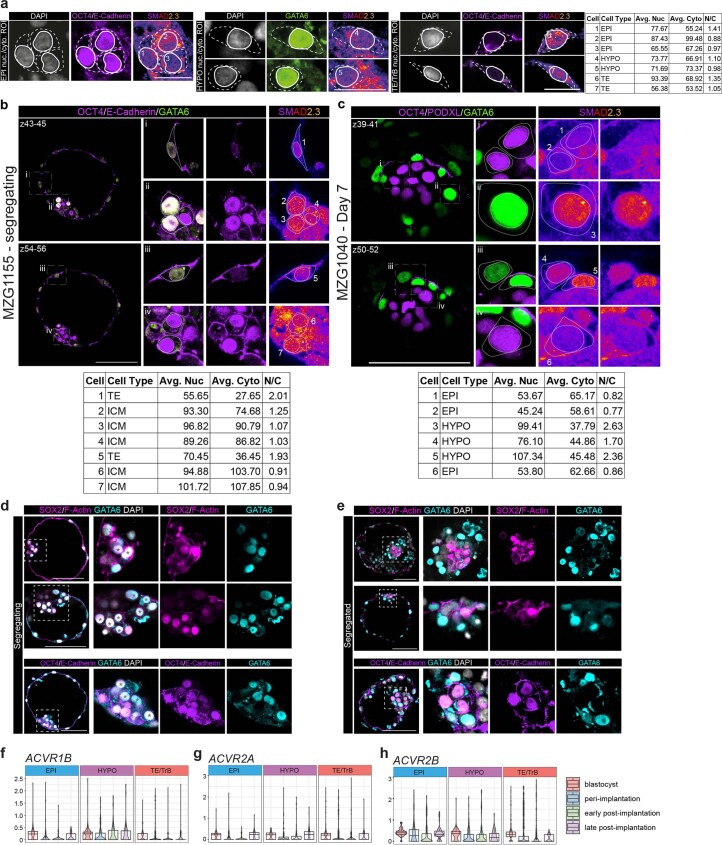
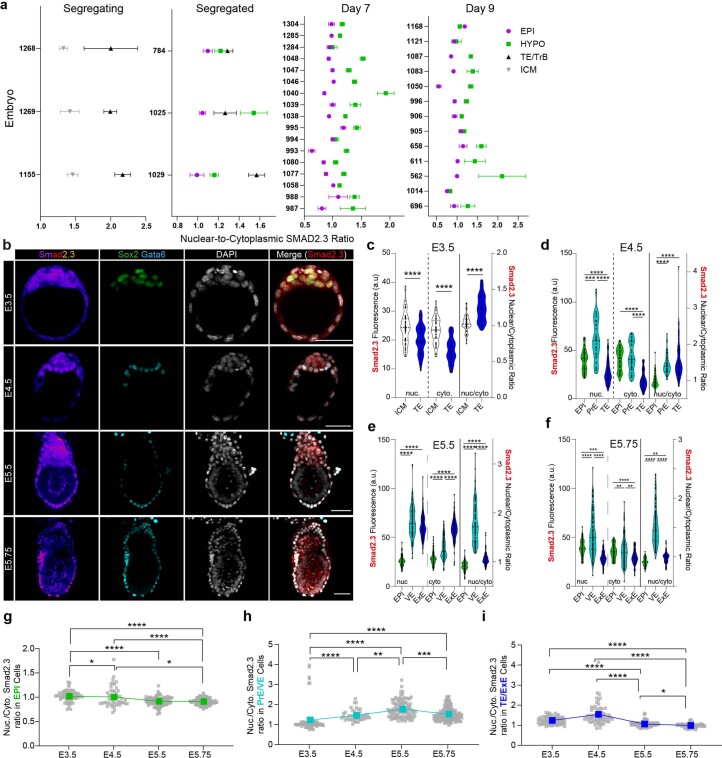
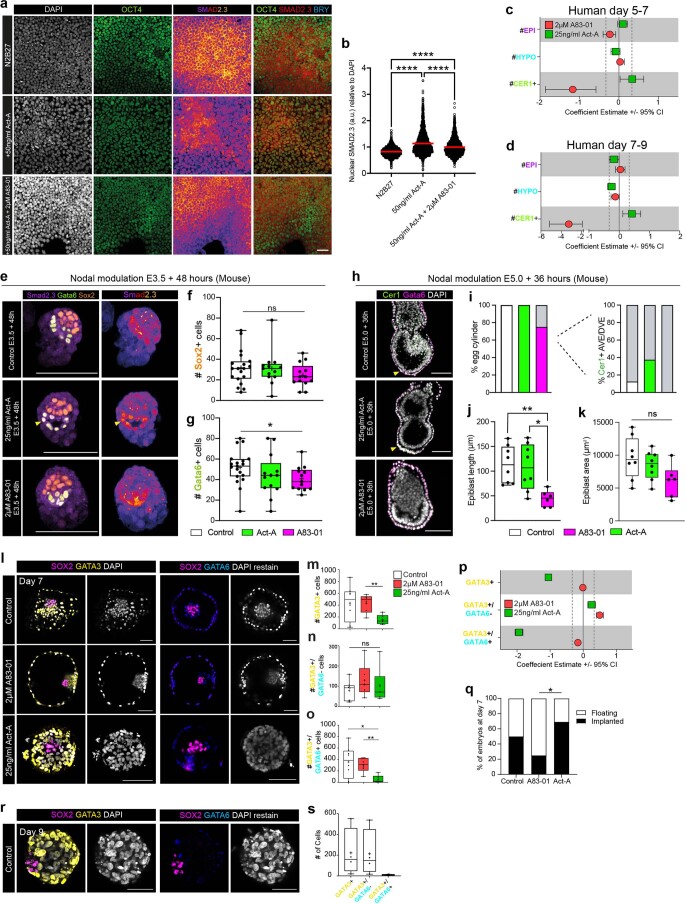
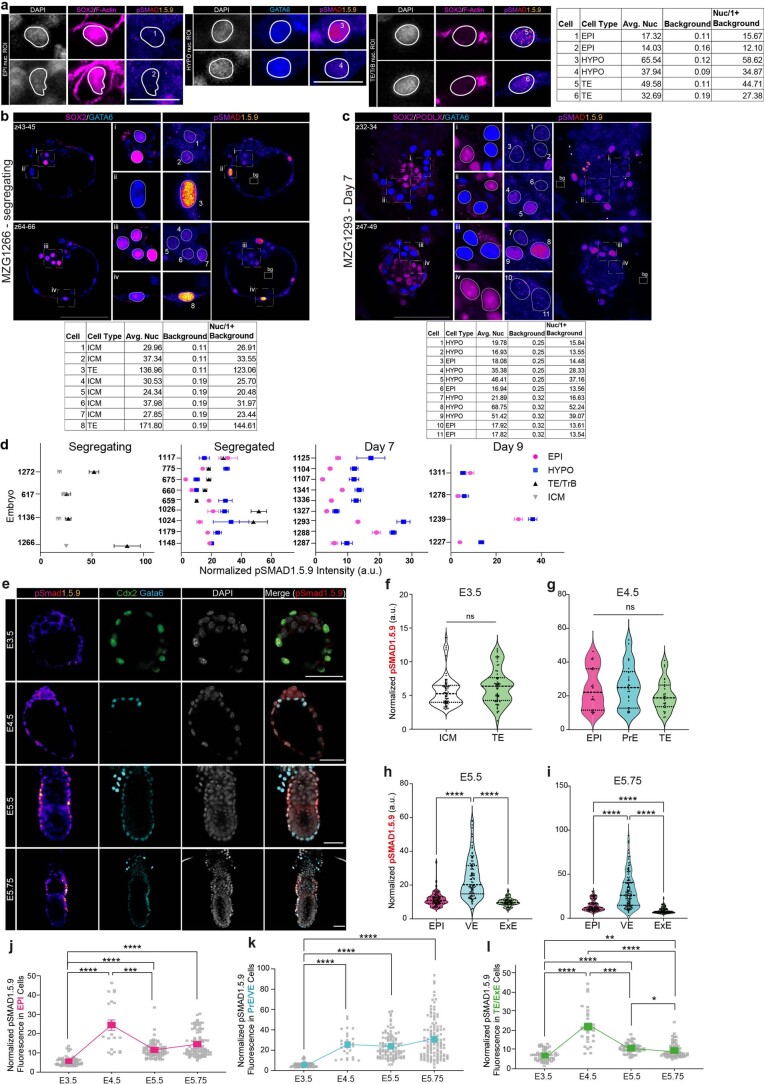
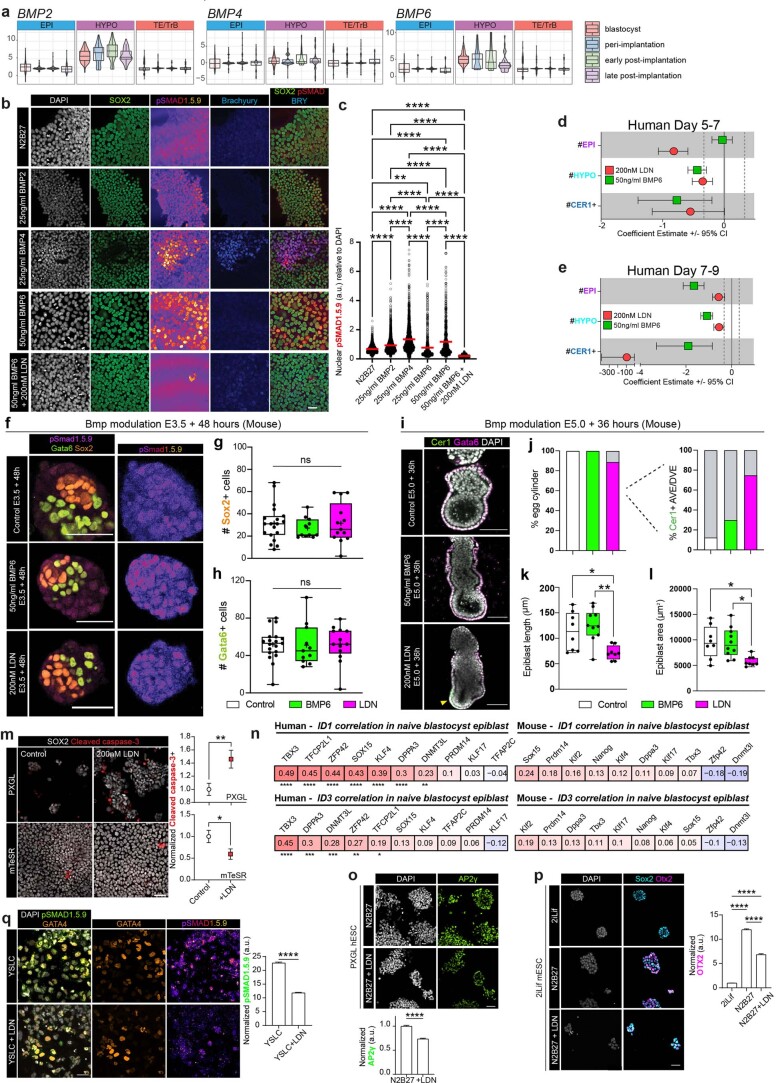
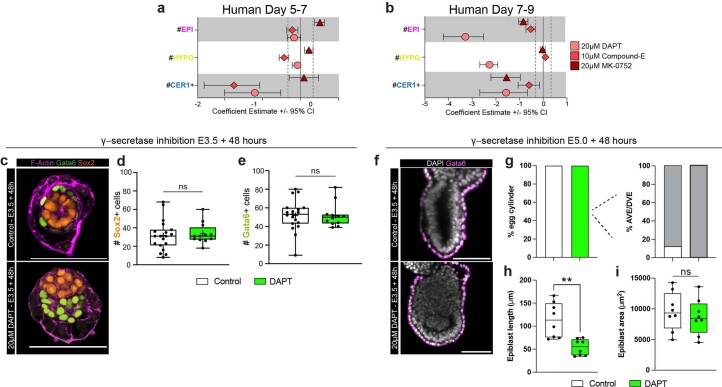
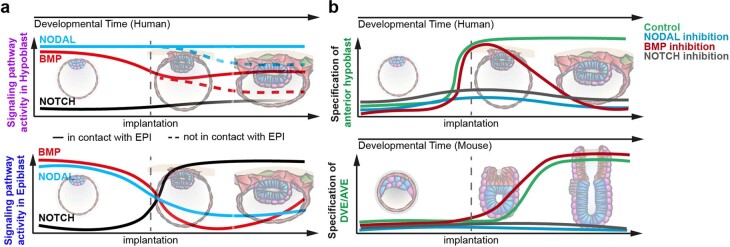
Development requires coordinated interactions between the epiblast, which generates the embryo proper; the trophectoderm, which generates the placenta; and the hypoblast, which forms both the anterior signalling centre and the yolk sac. These interactions remain poorly understood in human embryogenesis because mechanistic studies have only recently become possible. Here we examine signalling interactions post-implantation using human embryos and stem cell models of the epiblast and hypoblast. We find anterior hypoblast specification is NODAL dependent, as in the mouse. However, while BMP inhibits anterior signalling centre specification in the mouse, it is essential for its maintenance in human. We also find contrasting requirements for BMP in the naive pre-implantation epiblast of mouse and human embryos. Finally, we show that NOTCH signalling is important for human epiblast survival. Our findings of conserved and species-specific factors that drive these early stages of embryonic development highlight the strengths of comparative species studies.


Conflict of interest statement

The authors declare no competing interests.

Figures

Fig. 1
Fig. 1. Generation and analysis of a combined human sequencing dataset.
a, Diagram depicting human development from blastocyst through pre-gastrulation stages. The datasets integrated to generate our combined object are presented below. b, Uniform manifold approximation projection (UMAP) of datasets coloured by original publication. N = 9,862 single cells. c, UMAP of human datasets coloured by embryo age. d, UMAPs of human datasets coloured by a gradient of canonical marker gene expression for epiblast (EPI), hypoblast (HYPO), trophectoderm/trophoblast (TE/TrB) and terminal extravillous trophoblast (EVT) or syncytiotrophoblast (STB) lineages. e, UMAP coloured by assigned cell type. f, Heatmap of WikiPathways signalling pathway module score for each developmental stage of each individual cell type. Visualized value is calculated average scaled score from individual single-cell module scores. g,h, CellPhoneDB dotplots for blastocyst (g) and peri-implantation (h) stages depicting predicted activity of individual receptor–ligand pairs. Each ligand–receptor pair is colour matched to the expressing lineage on the x axis. N = 9,862 single cells. AP, anterior-posterior; dep, dependent; ind, independent; reg, regulation; comp, complex.
Fig. 2
Fig. 2. Characterization of SMAD2.3 dynamics during human in vitro implantation.
a, Immunofluorescence images of segregating (N = 3 embryos) and segregated human blastocysts (N = 3 blastocysts) stained for OCT4/E-CADHERIN, GATA6, total SMAD2.3 and DAPI. b,c, Quantification of nuclear and cytoplasmic SMAD2.3 fluorescence and their ratio in inner cell mass (ICM, n = 34 cells) and trophectoderm (TE, n = 31 cells) in segregating blastocysts and between epiblast (EPI, n = 26 cells), hypoblast (HYPO, n = 31 cells) and TE (n = 13 cells) of segregated blastocysts. d, Immunofluorescence images of day 7 (N = 17 embryos) and day 9 (N = 13 embryos) human embryos following in vitro implantation stained for OCT4/PODLX, GATA6, SMAD2.3 and DAPI. e,f, Quantification of nuclear and cytoplasmic SMAD2.3 fluorescence and their ratio in EPI and HYPO at day 7 (EPI n = 299 cells, HYPO n = 322 cells) and day 9 (EPI n = 297 cells, HYPO n = 214 cells). g,h, Plot of n/c SMAD2.3 over time in EPI (g; n = 11 day 5, 26 day 6, 299 day 7 and 197 day 9 cells) and HYPO (h; n = 10 day 5, 31 day 6, 322 day 7 and 214 day 9 cells). i, Quantification of n/c SMAD2.3 in HYPO cells at day 7 and day 9 depending on contact with overlying EPI. j, High-power images of SMAD2.3 in day 9 HYPO cells either contacting or not contacting the EPI. Regions shown here are outlined with a dashed box in d. For violin plots, central dotted line denotes median and dotted lines mark the 25th and 75th quartiles. Error bars denote standard error (g and h). Statistical tests: two-sided unpaired t-test (b (nuclear (nuc) and cytoplasmic (cyto))), two-sided Mann–Whitney (b (n/c), e and f), one-way analysis of variance with Tukey–Kramer post-hoc (c (nuc)), Kruskal–Wallis with Dunn’s post-hoc (c (cyto and n/c) and gi); ****P < 0.0001, ***P < 0.001, **P < 0.01, *P < 0.05. Unmarked pairwise comparisons are not significant (NS). Exact P values presented in Supplementary Table 8. Scale bars: 25 µm (a), 100 µm (b and e) and 20 µm (k). Source data
Fig. 3
Fig. 3. NODAL signalling is essential for anterior hypoblast specification and maintenance.
a, Schematic of experimental design for human embryo treatment from day 5 to day 7 to modulate NODAL signalling. b, Immunofluorescence images of embryos cultured from day 5 to day 7 in control (N = 44 embryos), 2 µM A83-01 (N = 12 embryos) or 25 ng ml−1 Activin-A (N = 14 embryos) conditions. ce, Quantification of the number of epiblast (c), hypoblast (d) and CER1-positive hypoblast cells (e) at day 7. f, Schematic of experimental design for human embryo treatment antagonists from day 7 to day 9 to modulate NODAL signalling. g, Immunofluorescence images of embryos cultured from day 7 to day 9 in control (N = 39 embryos), 2 µM A83-01 (N = 12 embryos) or 25 ng ml−1 Activin-A (N = 15 embryos) conditions. hj, Quantification of the number of epiblast (h), hypoblast (i) and CER1-positive hypoblast cells (j) at day 9. k, Schematic and immunofluorescence images of YSLC differentiation ± 2 µM A83-01 for 48 h during YSLC specification or maturation. l, Quantification of GATA6 fluorescence levels relative to DAPI and normalized to control. D2–D4: control n = 4,085; A83-01 n = 4,255. D4–D6: control n = 4,139; A83-01 n = 4,180. N = 2 experiments. m, Percentage of GATA6-positive cells that are CER1 positive. D2–D4: control n = 2,502; A83-01 n = 2,347. D4–D6: control n = 2,500; A83-01 n = 2,013. N = 2 experiments. n, Schematic and immunofluorescence images of pSMAD1.5.9 expression in human (h)ES cell-derived spheroids cultured in mTeSR+ medium (mTeSR+ n = 1,060 cells) or mTeSR+ medium conditioned on either control YSLC (YSLC CM n = 1,836 cells) or on YSLC differentiated with 48 h of A83-01 treatment (YSLC + A83 CM n = 1,654 cells). N = 3 experiments. o, Quantification of normalized pSMAD1.5.9 fluorescence from n. For box plots, box encompasses 25th and 75th quartiles with median marked by central line. Minimum and maximum and denoted by whiskers. Plus symbol marks the mean. Error bars denote standard error (mo). Statistical tests: two-sided Mann–Whitney test (ce and hj); two-sided unpaired t-test (l and m); one-way analysis of variance with Tukey–Kramer post-hoc (o). ****P < 0.0001, **P < 0.01, *P < 0.05. Unmarked pairwise comparisons are not significant (NS). Exact P values presented in Supplementary Table 8. Scale bars: 100 µm (b and g) and 50 µm (k and n). Embryos in b and g were re-stained for GATA6, and re-orientated second-stain images are placed on a grey background for transparency and to match the orientation of the merged image. Source data
Fig. 4
Fig. 4. Characterization of SMAD1.5.9 dynamics during human in vitro implantation.
a, Immunofluorescence images of segregating (N = 4 blastocysts) and segregated human blastocysts (N = 9 blastocysts) stained for SOX2/F-Actin, GATA6, phosphorylated (p)SMAD1.5.9 and DAPI. b,c, Quantification of the normalized fluorescence of pSMAD1.5.9 in inner cell mass (ICM, n = 59) versus trophectoderm (TE, n = 80 cells) in segregating blastocysts and between epiblast (EPI, n = 77 cells), hypoblast (HYPO, n = 142 cells) and TE (n = 258 cells) of segregated blastocysts. d, Immunofluorescence images of day 7 (N = 9 embryos) and day 9 (N = 4 embryos) human embryos following in vitro implantation stained for SOX2/PODLX, GATA6, pSMAD1.5.9 and DAPI. e,f, Quantification of normalized fluorescence of pSMAD1.5.9 in EPI versus HYPO at day 7 (EPI n = 162 cells, HYPO n = 236 cells) and day 9 (EPI n = 29 cells, HYPO n = 87 cells). g,h, Plot of normalized pSMAD1.5.9 fluorescence over time in EPI (g; n = 44 day 5, 68 day 6, 162 day 7 and 29 day 9 cells) and HYPO (h; n = 20 day 5, 90 day 6, 236 day 7 and 87 day 9 cells). i, Quantification of normalized pSMAD1.5.9 fluorescence in HYPO cells at day 7 and day 9 depending on contact with EPI. j, High-power images of pSMAD1.5.9 in day 9 HYPO cells either contacting or not contacting the EPI. Regions shown here are outlined with a dashed box in d. For violin plots, central dotted line denotes median and dotted lines mark the 25th and 75th quartiles. Error bars denote standard error (g and h). Statistical tests: two-sided Mann–Whitney test (b, e and f); Kruskal–Wallis with Dunn’s post-hoc (c and gi). ****P < 0.0001, ***P < 0.001, **P < 0.01, *P < 0.05. Exact P values presented in Supplementary Table 8. Scale bars: 25 µm (a), 100 µm (b and e) and 20 µm (k). Source data
Fig. 5
Fig. 5. BMP signalling is enriched in pre-implantation epiblast and important for maintenance of the anterior hypoblast.
a, Immunofluorescence images of embryos cultured from day 5 to day 7 in control (N = 44 embryos), 200 nM LDN (N = 8 embryos) or 50 ng ml−1 BMP6 (N = 8 embryos) conditions. bd, Quantification of the number of epiblast (b), hypoblast (c) and CER1-positive hypoblast cells (d) at day 7. e, Immunofluorescence images of embryos cultured from day 7 to day 9 in control (N = 39 embryos), 200 nM LDN (N = 6 embryos) or 50 ng ml−1 BMP6 (N = 6 embryos) conditions. fh, Quantification of the number of epiblast (f), hypoblast (g) and CER1-positive hypoblast cells (h) at day 9. i, Pearson regression correlation coefficient ID2 expression with naive pluripotency markers. j,k, Immunofluorescence and quantification of pSMAD1.5.9 in PXGL (naive: 3,057 cells) and mTeSR (primed: 5,761 cells) human (h)ES cells and in mouse (m)ES cells in 2iLif conditions (naive; 297 cells) or basal N2B27 (naive exit; 789 cells). N = 2 experiments. l, Immunofluorescence images of differentiated YSLCs ± 200 nM LDN for 48 h during specification or maturation of YSLCs. m, Quantification of GATA6 fluorescence levels in relative to DAPI and normalized to control. D2–D4: control n = 4,085; LDN n = 4,777. D4–D6: control n = 4,139; LDN n = 4,461. N = 2 experiments. n, Percentage of GATA6-positive cells that are CER1 positive. D2–D4: control n = 2,502; LDN n = 2,796. D4–D6: control n = 2,500; LDN n = 2,425. N = 2 experiments. o,p, Immunofluorescence images and quantification of pSMAD1.5.9 expression in hES cell-derived spheroids cultured in mTeSR+ medium (mTeSR+ n = 1,060 cells) or mTeSR+ medium conditioned on either control YSLC (YSLC CM n = 1,836 cells) or on YSLC differentiated with 48 h of LDN treatment (YSLC + LDN CM n = 1427 cells). N = 3 experiments. For box plots, box encompasses 25th and 75th quartiles with median marked by central line. Minimum and maximum and denoted by whiskers. Plus symbol marks the mean. Error bars denote standard error (k, mn and p). Statistical tests: two-sided Mann–Whitney test (bd and fh); coefficients were tested (cor.test; two-tailed) and corrected for multiple hypothesis testing with the Benjamini–Hochberg method (i); two-sided unpaired t-test (k, m and n); one way analysis of variance with Tukey–Kramer post-hoc (p). ****P < 0.0001, ***P < 0.001, *P < 0.05. Unmarked pairwise comparisons are not significant (NS). Exact P values presented in Supplementary Table 8. Scale bars: 100 µm (a and e) and 50 µm (j, l and o). Source data
Fig. 6
Fig. 6. Functional interrogation of NOTCH signalling in human peri-implantation.
a, Immunofluorescence images of embryos cultured from day 5 to day 7 in control conditions (N = 44 embryos), 20 µM DAPT (N = 8 embryos), 10 µM Compound-E (N = 14 embryos) or 20 µM MK-0752 (N = 9 embryos). bd, Quantification of the number of epiblast (b), hypoblast (d) and CER1-positive hypoblast cells (d) at day 7. e, Immunofluorescence images of embryos cultured from day 7 to day 9 in control conditions (N = 39 embryos), DAPT (N = 9 embryos), Compound-E (N = 12 embryos) or MK-0752 (N = 17 embryos). fh, Quantification of the number of epiblast (f), total hypoblast (g) and CER1-positive hypoblast cells (h) at day 9. ik, Immunofluorescence images and quantification of 2D naive PXGL and primed human (h)ES cells treated for 48 h in control conditions (PXGL n = 2,336, primed n = 7,796) or 20 µM DAPT (PXGL n = 2,386, primed n = 6,136; N = 2 experiments) and 3D spheroids derived from primed hES cells cultured in control conditions (n = 364) or DAPT (n = 643; N = 2 experiments). Cells were stained for SOX2 and cleaved caspase 3 (Ccasp3) with spheroids additionally stained for PODLX. l, Immunofluorescence images of the differentiation of YSLCs that were treated with DAPT for 48 h during YSLC specification or maturation. m, Percentage of GATA6-positive cells that are CER1 positive. D2–D4: control n = 2,502; DAPT n = 2,690. D4–D6: control n = 2,500; DAPT n = 2,701; N = 2 experiments. n, Immunofluorescence images of pSMAD1.5.9 expression in hES cell-derived spheroids cultured in mTeSR+ medium (mTeSR+ n = 1,060 cells) or mTeSR+ medium conditioned on either control YSLC (YSLC CM n = 1,836 cells) or on YSLC differentiated with 48 h of DAPT treatment (YSLC + DAPT CM n = 501 cells). N = 3 experiments. o, Quantification of normalized pSMAD1.5.9 fluorescence from n. For box plots, box encompasses 25th and 75th quartiles with median marked by central line. Minimum and maximum and denoted by whiskers. Plus symbol marks the mean. Error bars denote standard error (j, k and mo). Statistics: two-sided Mann–Whitney test (bd and fh); two-sided unpaired t-test (j and m); two-way analysis of variance (ANOVA) with Šidák’s multiple comparison’s test (k); one way ANOVA with Tukey–Kramer post-hoc (o). P < 0.06 is noted. ****P < 0.0001, ***P < 0.001, **P < 0.01, *P < 0.05. Unmarked comparisons to control are not significant (NS). Exact P values presented in Supplementary Table 8. Scale bars: 100 µm (a and e) and 50 µm (i, l and n). Source data
Extended Data Fig. 1
Extended Data Fig. 1. Generation of combined cynomolgus monkey dataset.
a, Uniform Manifold Approximation Projection (UMAP) of cynomolgus monkey scRNA-seq datasets colored by original publication. N = 10221 single cells. b, UMAP of monkey datasets colored by age of embryo. c, UMAP of monkey datasets colored by assigned cell type. d, UMAPs of monkey datasets colored by a gradient indicating gene expression for canonical markers of epiblast (EPI), hypoblast (HYPO), extraembryonic mesenchyme (EXMC), primitive streak, and trophectoderm/trophoblast (TE/TrB). Extraembryonic mesenchyme markers are also plotted on human dataset. e, Heatmap of average WikiPathways signaling pathway module score split by cell type and stage. Visualized value is calculated average scaled score from individual single-cell module scores. Gene names were converted from mfac to hgnc gene symbols for module scoring.
Extended Data Fig. 2
Extended Data Fig. 2. Generation of combined mouse dataset.
a, Uniform Manifold Approximation Projection (UMAP) of mouse scRNA-seq datasets colored by original publication. N = 16395 single cells. b, UMAP of mouse datasets colored by age. c, UMAP of mouse datasets colored by assigned cell type. d, UMAPs of mouse datasets colored by a gradient indicating gene expression for canonical markers of epiblast (EPI), primitive endoderm/visceral endoderm (PrE/VE), primitive streak, and trophectoderm/extraembryonic ectoderm (TE/ExE). e, Heatmap of average WikiPathways signaling pathway module score split by cell type and stage. Visualized value is calculated average scaled score from individual single-cell module scores. Gene names were converted from mmus to hgnc gene symbols for module scoring.
Extended Data Fig. 3
Extended Data Fig. 3. Signaling dynamics during human implantation.
a, Average scaled WikiPathways module scores for combined human dataset between lineages. b, Expression of WNT, FGF, BMP and NODAL associated genes plotted by stage during human, macaque, and mouse pre-gastrulation development. c-d, CellphoneDB dotplots for early post-implantation (c) and late post-implantation (d) stages depicting the predicted activity of individual receptor-ligand pairs. Each ligand-receptor pair is color matched to the expressing lineage on the x-axis.
Extended Data Fig. 4
Extended Data Fig. 4. Total SMAD2.3 quantification methodology.
a, Examples from a segregated blastocyst presented in Fig. 2a of Epiblast (EPI), Hypoblast (HYPO) and Trophectoderm (TE) cells with nuclear (solid line) and cytoplasmic (dotted line) regions of interest (ROI) outlined. The measured nuclear (Avg. Nuc) and cytoplasmic (Avg. Cyto) and calculated nuclear/cytoplasmic ratio (N/C) of total SMAD2.3 intensity for individual cells is shown. b-c, Examples from a segregating blastocyst (b) and day 7 embryo (c) of cells with nuclear and cytoplasmic ROIs outlined. Measured nuclear, cytoplasmic, and calculated nuclear-to-cytoplasmic ratios of total SMAD2.3 intensities are shown for each cell. Note that here the raw, unprocessed SMAD2.3 signal is shown for the central 3-plane z-stacks used directly for quantification. N = 14 experiments. d-e, Examples of segregating (d) and segregated (e) human blastocysts. Inner cell mass cells co-expressing epiblast and hypoblast markers are marked with grey asterisks. N = 3 experiments. f-h, Violin plots depicting expression of NODAL receptors ACVR1B, ACVR2A, and ACVR2B across stages and lineages in human single cell RNA sequencing data. N = 9862 single cells. Scale bars: 100 µm.
Extended Data Fig. 5
Extended Data Fig. 5. Characterization of NODAL signaling across mouse implantation.
a, Mean ± S.E.M. nuclear-to-cytoplasmic ratio of total SMAD2.3 within each lineage of segregating and segregated blastocysts, day 7, and day 9 embryos, separated by individual embryo. Note consistency of trends, particularly of TE versus ICM enrichment in segregating blastocysts, and of hypoblast versus epiblast. b, Immunofluorescence images of mouse embryos at E3.5 (N = 10 embryos), E4.5 (N = 6 embryos), E5.5 (N = 6 embryos) and E5.75 (N = 6 embryos) stained for total Smad2.3, DAPI, and either Sox2 or Gata6. c-f, Quantification of nuclear and cytoplasmic Smad2.3. fluorescence and their ratio. g-i, Quantification of the nuclear/cytoplasmic ratio of Smad2.3 within the epiblast (g; n = 63 E3.5, 50 E4.5, 95 E5.5, 95 E5.75 cells), primitive endoderm/visceral endoderm (PrE/VE; n = 69 E3.5, 42 E4.5, 105 E5.5, 129 E5.75 cells) (h) or trophectoderm/extraembryonic ectoderm (TE/ExE) (i; n = 62 E3.5, 60 E4.5, 89 E5.5, 69 E5.75 cells) over time. For Violin plots c-f, central dotted line denotes median and dotted lines mark the 25th and 75th quartiles. Statistical tests: (c) two-sided unpaired T-test; (d-f) Kruskal Wallis with Dunn’s post-hoc; ****p < 0.0001, ***p < 0.001, *p < 0.05. Unmarked pairwise comparisons are not significant (ns). Exact p-values presented in Supplemental Table 8. Scale bars: 100 µm. Source data
Extended Data Fig. 6
Extended Data Fig. 6. NODAL modulation in human ESC, mouse embryos, and effect of NODAL modulation on human trophectoderm.
a-b, Immunofluorescence images and quantification of primed hESCs cultured with either DMSO (n = 2588), 50 ng/ml Activin-A (n = 2465), or Activin-A with 2 µM A83-01 (n = 2463) for 48 hours. c-d, Bayesian coefficients ± credible interval for counts presented in Fig. 3c–e (c) and Fig. 3h–j. (d). e, Immunofluorescence images of mouse embryos recovered at E3.5 and cultured in vitro for 48 h in control (N = 19), 25 ng/ml Activin-A (N = 13 embryos) or 2 µM A83-01 (N = 13 embryos) conditions. f-g, Quantification of the number of epiblast (f) and primitive endoderm/visceral endoderm (g) from e. h, Immunofluorescence images of mouse embryos recovered at E5.0 and cultured in vitro for 36 h in control (N = 8), Activin-A (N = 8), or A83-01 (N = 6) conditions. i, Quantification of the proportion of embryos that successfully made an egg cylinder and the proportion of egg cylinders with a Cer1-positive DVE/AVE. j, Quantification of epiblast length. k, Quantification of epiblast area. l, Immunofluorescence images of embryos cultured from day 5 to 7 in control (N = 8 embryos), 2 µM A83-01 (N = 6 embryos), or 25 ng/ml Activin-A (N = 6 embryos) conditions. m-o, Quantification of the number of total GATA3-positive (GATA3 + ) (m), GATA3 + /GATA6-negative (-) (n), and GATA3 + /GATA6+ trophectoderm/trophoblast cells (o) at day 7. p, Bayesian coefficients ± credible interval for counts presented in m-o. (N = 8 control, 8 Activin-A, and 6 A83-01 treated embryos). q, Quantification of the percentage of embryos cultured from day 5 to 7 in control conditions (N = 16), A83-01 (N = 12), or Activin-A (N = 13) that underwent in vitro implantation. r, Immunofluorescence images of a day 9 embryo cultured in control conditions (N = 4 embryos). s, Quantification of the number of total GATA3 + , GATA3 + /GATA6-, and GATA3 + /GATA6+ cells at day 9. For box plots, the box encompasses the 25th-75th quartiles with the median marked by the central line. The minimum and maximum are denoted by the whiskers. For violin plots, the mean is marked by the red line. Statistical tests: (b, j-k) One-way ANOVA with Tukey-Kramer post-hoc; (f-g, m-o) two-sided Mann-Whitney test; (q) Fisher’s Exact Test. ****p < 0.0001. **p < 0.01, *p < 0.05. Unmarked pairwise comparisons are not significant (ns). Exact p-values presented in Supplemental Table 8. Scale bars: (a) 50 µm, (e, h, l, r) 100 µm. Source data
Extended Data Fig. 7
Extended Data Fig. 7. Comparative characterization of BMP signaling across mouse implantation.
a, Examples from a segregated blastocyst presented in Fig. 4a of Epiblast (EPI), Hypoblast (HYPO) and Trophectoderm (TE) cells with nuclear region of interest (ROI) outlined. The measured nuclear (Avg. Nuc) and background and calculated normalized (Nuc/1+Background) pSMAD1.5.9 intensity for individual cells is shown. b-c, Examples from a segregating blastocyst (b) and day 7 embryo (c) of cells with nuclear and background ROIs outlined. Measured nuclear and background (bg) and calculated normalized pSMAD1.5.9 intensities are shown for each cell. Note that here the raw, unprocessed pSMAD1.5.9 signal is shown for the central 3-plane z-stacks used directly for quantification. Cells that are central to the same 3-plane z-stack use the same background value for normalization. d, Mean ± S.E.M. normalized pSMAD1.5.9 intensity within each lineage of segregating (N = 9) and segregated blastocysts (N = 9), day 7 (N = 6), and day 9 embryos, separated by individual embryo. Note consistency of trends, particularly of TE versus ICM enrichment in segregating blastocysts, and of hypoblast versus epiblast in segregated blastocysts and at day 7. e, Immunofluorescence images of mouse embryos at E3.5 (N = 9 embryos), E4.5 (N = 4 embryos), E5.5 (N = 6 embryos) and E5.75 (N = 5 embryos) stained for phosphorylated (p)Smad1.5.9, DAPI and either Cdx2 or Gata6. f-i, Quantification of normalized pSmad1.5.9 fluorescence between lineages at the different stages of mouse development depicted in e. j-l, Quantification of normalized pSmad1.5.9 in epiblast (EPI) (j; n = 69 E3.5, 22 E4.5, 82 E5.5, 93 E5.75 cells), primitive endoderm/visceral endoderm (PrE/VE) (k; n = 69 E3.5, 26 E4.5, 102 E5.5, and 121 E5.75 cells) (j) or trophectoderm/extraembryonic ectoderm (TE/ExE) (l; n = 60 E3.5, 28 E4.5, 62 E5.5, and 69 E5.75 cells) across stages. For Violin plots e-h, central dotted line denotes median and dotted lines mark the 25th and 75th quartiles. Statistical tests: (f) two-sided Mann Whitney, (g-i) Kruskal Wallis with Dunn’s post-hoc; ****p < 0.0001, ***p < 0.001, *p < 0.05. Unmarked pairwise comparisons are not significant (ns). Exact p-values presented in Supplemental Table 8. Scale bars: 100 µm. Source data
Extended Data Fig. 8
Extended Data Fig. 8. Validation of BMP modulation, comparative functional modulation in mouse, and divergent roles for BMP in naïve pluripotency.
a, Violin plots of BMP2/4/6 expression. N = 9862 single cells. b-c, Immunofluorescence images and quantification of primed hESCs cultured in control conditions (n = 2825), 25 ng/ml BMP2 (n = 2184), 25 ng/ml BMP4 (n = 1681), 50 ng/ml BMP6 (n = 889), or 50 ng/ml BMP6 + 200 nM LDN193189 (n = 1406). d-e, Bayesian coefficients ± credible interval for counts presented in Fig. 5b-d (d) and Fig. 5f-h (e). f, Immunofluorescence images of mouse embryos recovered at E3.5 and cultured in vitro for 48 h in control (N = 19), 50 ng/ml BMP6 (N = 11), or 200 nM LDN193189 (N = 13) conditions. g-h, Quantification of the number epiblast (g) and primitive endoderm/visceral endoderm (h) from f. i, Immunofluorescence images of mouse embryos recovered at E5.0 and cultured in vitro for 36 h in control (N = 8), BMP6 (N = 10) or LDN193189 (N = 8) conditions. j, Quantification of the proportion of embryos that successfully made an egg cylinder and have a Cer1-positive DVE/AVE. k-l, Quantification of the epiblast length (k) and area (l). m, Immunofluorescence images and quantification of hESCs treated for 48 hours with control conditions (PXGL n = 2336, primed n = 7796) or 200 nM LDN193189 (PXGL n = 2398, primed n = 6500, N = 2 experiments). n, Pearson regression correlation coefficients for ID1 and ID3 expression with naïve pluripotency markers. o, Immunofluorescence and quantification of AP2γ in hESCs (LDN: n = 1695 untreated cells; n = 1426 LDN treated cells; N = 2 experiments). p, Immunofluorescence and quantification of Otx2 in mESCs cultured in either 2iLif naïve conditions (n = 1570 cells), N2B27 (n = 3602 cells), or N2B27 + LDN (n = 1064 cells). N = 3 experiments. q, Immunofluorescence images and quantification of pSMAD1.5.9 in YSLCs (control: n = 1150; LDN: n = 827; N = 2 experiments). For box plots, the box encompasses the 25th-75th quartiles with the median marked by the central line. The minimum and maximum are denoted by the whiskers. For violin plots, the mean is marked by the red line. Statistical tests: (c, k-l, p) One-way ANOVA with Tukey-Kramer post-hoc; (e-f) two-sided Mann-Whitney test, (m, o, q) two-sided unpaired T-test; (o) Coefficients were tested (cor.test; two-tailed) and corrected for multiple hypothesis testing with the Benjamini-Hochberg method; ****p < 0.0001. ***p < 0.001. **p < 0.01. *p < 0.05. Unmarked pairwise comparisons are not significant (ns). Exact p-values presented in Supplemental Table 8. Scale bars: (b, m, o-q) 50 µm, (f, i) 100 µm. Source data
Extended Data Fig. 9
Extended Data Fig. 9. Comparative functional Notch interrogation of mouse.
a-b, Bayesian coefficients ± credible interval for counts presented in Fig. 6b–d (a) and Fig. 6f–h (b). c, Immunofluorescence images of representative mouse embryo recovered at E3.5 and cultured in vitro for 48 hours in either control conditions (N = 19 embryos) or with 20 µM DAPT added to the media (N = 12 embryos). d-e, Quantification of number of epiblast (d) and primitive endoderm/visceral endoderm (e) from c. f, Immunofluorescence images of a representative mouse embryo recovered at E5.0 and cultured in vitro for 36 h in either control conditions (N = 8 embryos) with 20 µM DAPT added to the media (N = 8 embryos). g, Quantification of the proportion of embryos that successfully made an egg cylinder and of the proportion of egg cylinders that had a Cer1-positive DVE or AVE. h, Quantification of epiblast length in µm at the central plane. i, Quantification of epiblast area in µm2 at the central plane. For box plots, the box encompasses the 25th-75th quartiles with the median marked by the central line. The minimum and maximum are denoted by the whiskers. Statistical tests: (d-e) Two-sided Mann-Whitney test; (h-i) two-sided unpaired T-test; **p < 0.01. Exact p-values presented in Supplemental Table 8. Scale bars = 100 µm. Source data
Extended Data Fig. 10
Extended Data Fig. 10. Proposed model of peri-implantation signaling activity and anterior specification.
a, Proposed model of BMP, NODAL and NOTCH signaling activity in the Hypoblast (top) and Epiblast (bottom) during human peri-implantation. Note implantation as a switch point in the activity of pathways for the epiblast, and a point of divergence of subpopulations within the hypoblast. The role of NOTCH in the hypoblast remains less clear, indicated by a gradient. b, Summary of signaling perturbation effects on human anterior hypoblast (top) and mouse distal/anterior visceral endoderm (DVE/AVE; bottom) specification. Schematics of human embryos correspond to day 5, day 7, and day 9 and mouse embryo schematics correspond to E3.5, E5.0, E5.75.

Similar articles

Cited by

References

    1. Koot YEM, Teklenburg G, Salker MS, Brosens JJ, Macklon NS. Molecular Aspects of Implantation Failure. Biochim. Biophys. Acta Mol. Basis Dis. 2012;1822:1943–1950. doi: 10.1016/j.bbadis.2012.05.017. - DOI - PubMed
    1. Macklon NS. Conception to ongoing pregnancy: the 'black box' of early pregnancy loss. Hum. Reprod. Update. 2002;8:333–343. doi: 10.1093/humupd/8.4.333. - DOI - PubMed
    1. Molè, M. A., Weberling, A. & Zernicka-Goetz, M. in Current Topics in Developmental Biology Vol. 136 113–138 (Academic Press, 2020). - PubMed
    1. Rossant J, Tam PPL. Early human embryonic development: blastocyst formation to gastrulation. Dev. Cell. 2022;57:152–165. doi: 10.1016/j.devcel.2021.12.022. - DOI - PubMed
    1. Weberling A, Zernicka-Goetz M. Trophectoderm mechanics direct epiblast shape upon embryo implantation. Cell Rep. 2021;34:108655. doi: 10.1016/j.celrep.2020.108655. - DOI - PMC - PubMed

Publication types