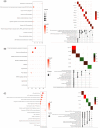
Transcriptomic screening of novel targets of sericin in human hepatocellular carcinoma cells
- PMID: 38443583
- PMCID: PMC10914811
- DOI: 10.1038/s41598-024-56179-y
Transcriptomic screening of novel targets of sericin in human hepatocellular carcinoma cells
Abstract
Sericin, a natural protein derived from Bombyx mori, is known to ameliorate liver tissue damage; however, its molecular mechanism remains unclear. Herein, we aimed to identify the possible novel targets of sericin in hepatocytes and related cellular pathways. RNA sequencing analysis indicated that a low dose of sericin resulted in 18 differentially expressed genes (DEGs) being upregulated and 68 DEGs being downregulated, while 61 DEGs were upregulated and 265 DEGs were downregulated in response to a high dose of sericin (FDR ≤ 0.05, fold change > 1.50). Functional analysis revealed that a low dose of sericin regulated pathways associated with the complement and coagulation cascade, metallothionine, and histone demethylate (HDMs), whereas a high dose of sericin was associated with pathways involved in lipid metabolism, mitogen-activated protein kinase (MAPK) signaling and autophagy. The gene network analysis highlighted twelve genes, A2M, SERPINA5, MT2A, MT1G, MT1E, ARID5B, POU2F1, APOB, TRAF6, HSPA8, FGFR1, and OGT, as novel targets of sericin. Network analysis of transcription factor activity revealed that sericin affects NFE2L2, TFAP2C, STAT1, GATA3, CREB1 and CEBPA. Additionally, the protective effects of sericin depended on the counterregulation of APOB, POU2F1, OGT, TRAF6, and HSPA5. These findings suggest that sericin exerts hepatoprotective effects through diverse pathways at different doses, providing novel potential targets for the treatment of liver diseases.
Keywords: Hepatoprotection; Sericin; Transcriptome profiling.
© 2024. The Author(s).
Conflict of interest statement
The authors declare no competing interests.
Figures


Similar articles
-
Transcriptome profile and its partly verification of human hepatocellular carcinoma cells exposed to Yuzhizi () seed extract.J Tradit Chin Med. 2022 Dec;42(6):922-931. doi: 10.19852/j.cnki.jtcm.20220817.002. J Tradit Chin Med. 2022. PMID: 36378050 Free PMC article.
-
The identification of key genes and pathways in hepatocellular carcinoma by bioinformatics analysis of high-throughput data.Med Oncol. 2017 Jun;34(6):101. doi: 10.1007/s12032-017-0963-9. Epub 2017 Apr 21. Med Oncol. 2017. PMID: 28432618 Free PMC article.
-
Novel sericin-based hepatocyte serum-free medium and sericin's effect on hepatocyte transcriptome.World J Gastroenterol. 2018 Aug 14;24(30):3398-3413. doi: 10.3748/wjg.v24.i30.3398. World J Gastroenterol. 2018. PMID: 30122879 Free PMC article.
-
Sericin: A Versatile Protein Biopolymer with Therapeutic Significance.Curr Pharm Des. 2020;26(42):5414-5429. doi: 10.2174/1381612826666200612165253. Curr Pharm Des. 2020. PMID: 32532189 Review.
-
Processing and characterization of silk sericin from Bombyx mori and its application in biomaterials and biomedicines.Mater Sci Eng C Mater Biol Appl. 2016 Apr 1;61:940-52. doi: 10.1016/j.msec.2015.12.082. Epub 2015 Dec 30. Mater Sci Eng C Mater Biol Appl. 2016. PMID: 26838924 Review.
Cited by
-
Animal origins free products in cell culture media: a new frontier.Cytotechnology. 2025 Feb;77(1):12. doi: 10.1007/s10616-024-00666-7. Epub 2024 Dec 7. Cytotechnology. 2025. PMID: 39654546 Review.
-
Egg exosome miR-145-5p decreases mitochondrial ROS to protect chicken embryo hepatocytes against apoptosis through targeting MAPK10.J Anim Sci Biotechnol. 2025 May 24;16(1):74. doi: 10.1186/s40104-025-01203-y. J Anim Sci Biotechnol. 2025. PMID: 40410809 Free PMC article.
References
-
- Cornelius CE. Clinical Biochemistry of Domestic Animals. Elsevier; 1980. pp. 201–257.
-
- Adewusi E, Afolayan AJ. A review of natural products with hepatoprotective activity. J. Med. Plants Res. 2010;4:1318–1334.
MeSH terms
Substances
Grants and funding
LinkOut - more resources
Full Text Sources
Medical
Molecular Biology Databases
Research Materials
Miscellaneous

