. 2024 Mar 5;147(1):50.
doi: 10.1007/s00401-024-02705-1.

RNA aptamer reveals nuclear TDP-43 pathology is an early aggregation event that coincides with STMN-2 cryptic splicing and precedes clinical manifestation in ALS

Affiliations

RNA aptamer reveals nuclear TDP-43 pathology is an early aggregation event that coincides with STMN-2 cryptic splicing and precedes clinical manifestation in ALS

Holly Spence et al. Acta Neuropathol. .

Abstract

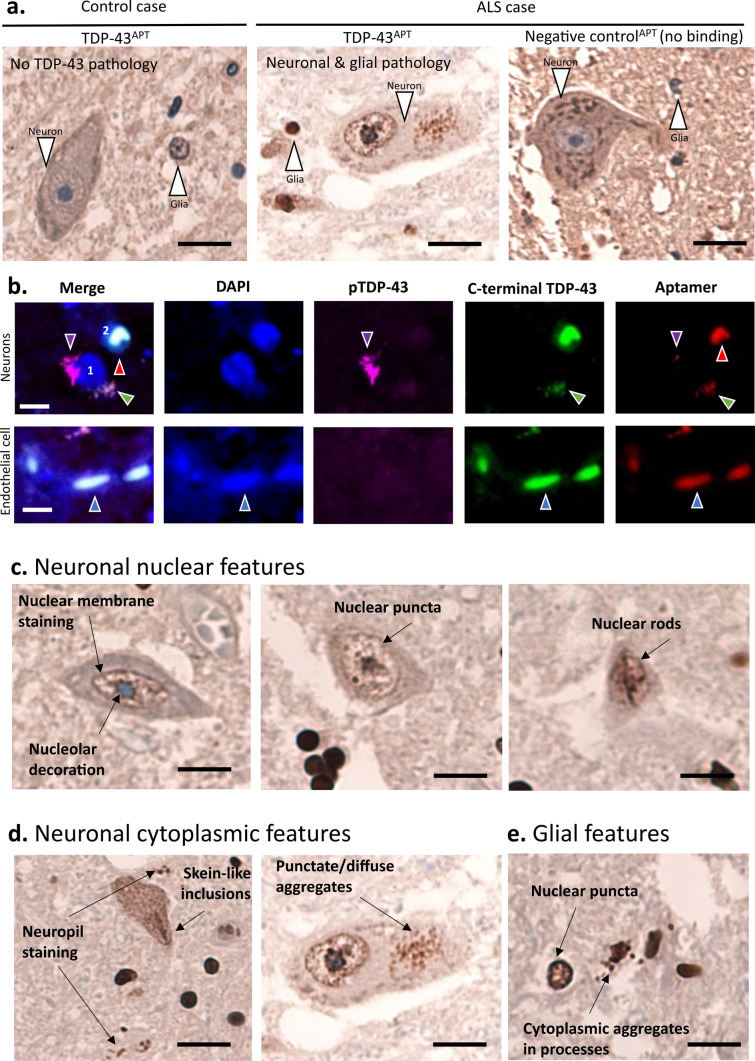
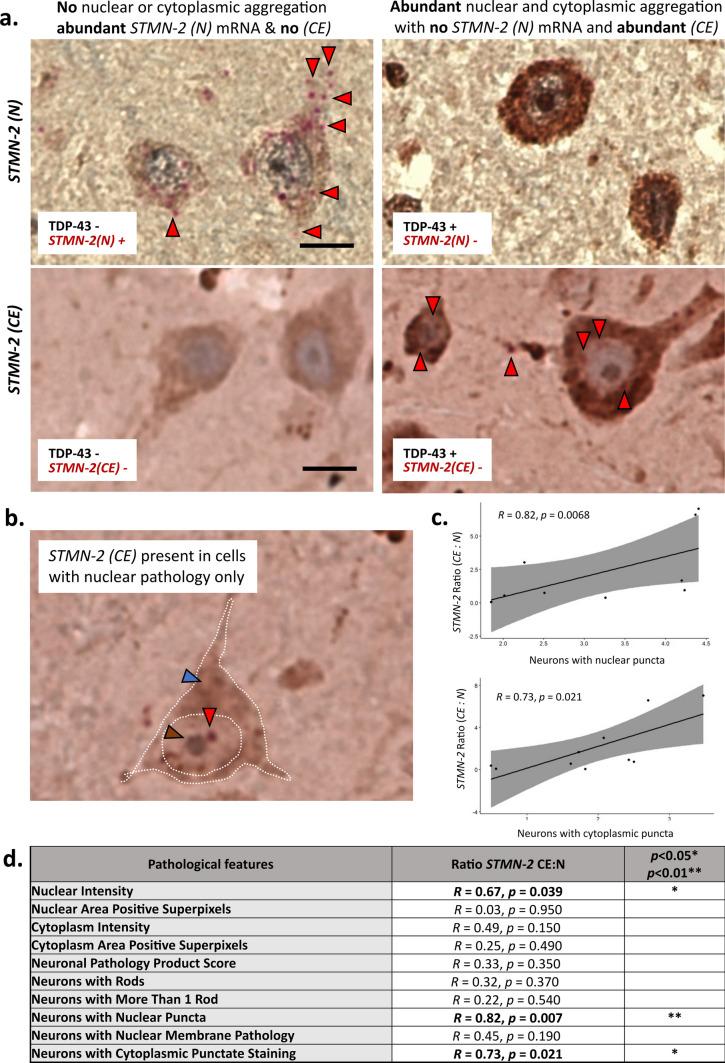
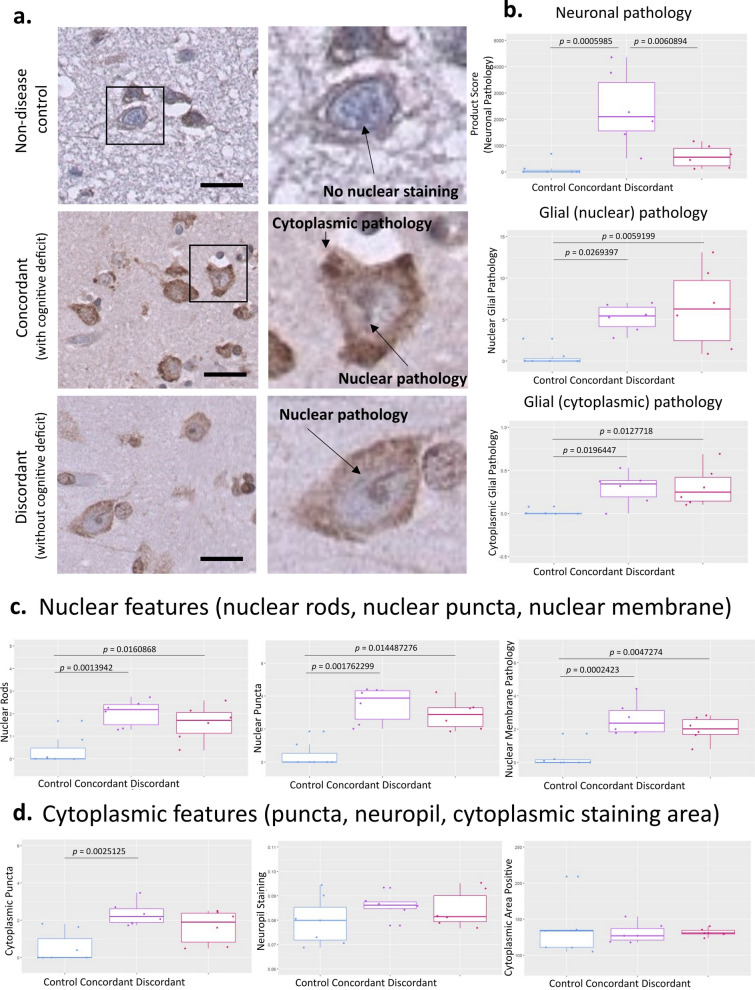
TDP-43 is an aggregation-prone protein which accumulates in the hallmark pathological inclusions of amyotrophic lateral sclerosis (ALS). However, the analysis of deeply phenotyped human post-mortem samples has shown that TDP-43 aggregation, revealed by standard antibody methods, correlates poorly with symptom manifestation. Recent identification of cryptic-splicing events, such as the detection of Stathmin-2 (STMN-2) cryptic exons, are providing evidence implicating TDP-43 loss-of-function as a potential driving pathomechanism but the temporal nature of TDP-43 loss and its relation to the disease process and clinical phenotype is not known. To address these outstanding questions, we used a novel RNA aptamer, TDP-43APT, to detect TDP-43 pathology and used single molecule in situ hybridization to sensitively reveal TDP-43 loss-of-function and applied these in a deeply phenotyped human post-mortem tissue cohort. We demonstrate that TDP-43APT identifies pathological TDP-43, detecting aggregation events that cannot be detected by classical antibody stains. We show that nuclear TDP-43 pathology is an early event, occurring prior to cytoplasmic accumulation and is associated with loss-of-function measured by coincident STMN-2 cryptic splicing pathology. Crucially, we show that these pathological features of TDP-43 loss-of-function precede the clinical inflection point and are not required for region specific clinical manifestation. Furthermore, we demonstrate that gain-of-function in the form of extensive cytoplasmic accumulation, but not loss-of-function, is the primary molecular correlate of clinical manifestation. Taken together, our findings demonstrate implications for early diagnostics as the presence of STMN-2 cryptic exons and early TDP-43 aggregation events could be detected prior to symptom onset, holding promise for early intervention in ALS.

Keywords: Stathmin-2; Amyotrophic lateral sclerosis; Cognition; Cryptic splicing; Loss-of-function; Neuropathology; RNA aptamer; TDP-43.


Conflict of interest statement

GGT, EZ, AP, MH are listed as inventors on a patent relating to the use of TDP-43 binding RNA aptamers: “WO2023217742—TDP-43-BINDING SINGLE-STRANDED APTAMERS AND USES THEREOF” (PCT/EP2023/062203). The authors declare no other conflicts of interest.

Figures

Fig. 1
Fig. 1
STMN-2 cryptic splicing events, but not pTDP-43 pathology, distinguish between distinct clinical phenotypes. i Representative photomicrographs taken at 40 × magnification demonstrating neuronal phospho-TDP-43 pathology and Stathmin-2 (protein) staining using immunohistochemistry (left two panels), as well as Stathmin-2 cryptic exon (CE) and Stathmin-2 normal mRNA transcripts using BaseScope in situ hybridization (right two panels). Blue arrows indicate absence of immunoreactivity, black arrows indicate positive staining on immunohistochemistry (protein) and red arrow indicate postitive staining on in situ hybridisation (mRNA). Each red dot represents a single mRNA transcript. Scale bar = 50 µm. ii Box plots demonstrating phenotypically conserved variation in Stathmin-2 cryptic exon (CE) and Stathmin-2 normal transcripts per cell in the two brain regions examined (BA44 and BA46). Each bar of the box plot represents data from three cases, with medians (horizontal line on box), spread and skewness derived from counts of transcripts per cell from 20 cells in each of three randomly allocated regions of interest, boxes represent min and max values. Graphs demonstrate counts to be consistent between clinically segregated groups with cases expressing more cryptic exon than controls and concordant cases demonstrating the most striking loss of normal Stathmin-2 expression. iii Box plots showing the ratio of cryptic exon to normal counts. Each bar of the box plot represents data from three cases, with medians (horizontal line on box), spread and skewness derived from ratio of counts shown in ii, boxes represent min and max values. Horizontal dotted line at y = 1, shows that only concordant (clinically manifesting) cases have a ratio of > 1
Fig. 2
Fig. 2
TDP-43APT identifies broader range of aggregation events compared to classical antibody approaches. a Representative photomicrographs taken at 40 × magnification demonstrating the staining pattern of neuronal and glial cells with a biotiylated RNA aptamer targeting TDP-43 (TDP43APT). Controls (left image) show no evidence of immunoreactivity, and ALS cases (centre image) show pathological, neuronal and glial, nuclear and cytoplasmic, TDP-43 accumulation. Scale bar is 20 µm. b Representative photomicrographs taken at 20 × magnification demonstrating immunofluorescent staining with a pTDP-43 antibody (purple), a c-terminal TDP-43 antibody (green) and TDP-43APT (red). Scale bar is 5 µm and nuclei are stained with DAPI (blue). Images show two neurons (nuclei labeled 1 and 2) affected by TDP-43 pathology. Cell 1 shows two cytoplasmic aggregates, one aggregate co-stains with the pTDP-43 antibody and TDP-43APT (purple arrowhead) and the other aggregate co-stains with the c-terminal antibody and TDP-43APT (green arrowhead). The cell labelled 2 shows a nuclear aggregate (red arrowhead), identified by the TDP-43APT, but which is obscured by the “normal” (i.e., functional, non-phosphorylated) C-terminal antibody staining. Endothelial cells (lower panel) that are not involved by TDP-43 pathology show only diffuse, non-aggregated C-terminal antibody and TDP-43APT staining (blue arrowheads) and show no immunoreactivity for pTDP-43. ibe Representative photomicrographs taken at 40 × magnification demonstrating DAB immunostaining for TDP-43APT highlighting neuronal nuclear features (c), neuronal cytoplasmic features (iv) and glial TDP-43 pathology (e). Scale bar = 20 µm
Fig. 3
Fig. 3
TDP-43 pathology detected by RNA aptamer correlates with molecular phenotype. a Representative photomicrographs taken at 40 × magnification demonstrating dual DAB immunohistochemical staining for TDP-43APT and in situ hybridization with BaseScope to detect STMN-2 normal (N) and cryptic exon (CE) mRNA transcripts (individual red dots are single mRNA transcripts of STMN-2). Images are taken from distinct regions of a case with a discordant clinical phenotype (i.e. TDP-43 pathology present but no evidence of clinical manifestation) showing that in regions where there is no evidence of TDP-43APT pathology there is ample normal STMN-2 mRNA expression (red arrowheads; top left image) and no cryptic exons present (lower left image). However, in regions where there is abundant nuclear and cytoplamsic aggregation seen with TDP-43APT staining (right images), there is a coincident loss of normal STMN-2 expression (upper right image) and cryptic exons can be seen (red arrowheads; lower right image). Scale bar = 20 µm. b Image demonstrating the presence of cryptic exons (red arrowheads) in a neuron with nuclear pathology (brown arrowhead) in the absence of substantial cytoplasmic pathology (blue arrowhead). c Graph demonstrating the correlation between STMN-2 splicing pathology and TDP-43APT pathology with respect to nuclear (left graph) and cytoplasmic (right graph) TDP-43 pathology. d Summary of all comparisons made between TDP-43APT pathology (pathological features) and STMN-2 cryptic splicing events
Fig. 4
Fig. 4
Nuclear TDP-43APT pathology is an early event that coincides with TDP-43 loss-of-function and precedes clinical symptom onset. a Representative photomicrographs taken at 40 × magnification demonstrating the staining pattern of TDP-43APT in cases that have been clinically stratified in to non-neurological, concordant and discordant cases. Images on the left show the low power region that the digital zoom has focused on in the right panel. Nuclear and cytoplasmic features have been annotated on the images. Scale bar = 50 µm. b Graphs demonstrating a product score of all neuronal pathologies (upper graph; ANOVA corrected for multiple comparisons shows statistically significant difference between groups, p = 0.000552), glial nuclear pathology (centre graph; ANOVA corrected for multiple comparisons shows statistically significant difference between groups, p = 0.00489), and glial cytoplasmic pathology (lower graph; ANOVA corrected for multiple comparisons shows statistically significant difference between groups, p = 0.0071), examined using digital and blinded manual assessment of images represented in a. c Graphs demonstrating neuronal nuclear pathologies including the number of cells with more than one visible nuclear rod (left graph; ANOVA corrected for multiple comparisons shows statistically significant difference between groups, p = 0.00136), nuclear puncta (centre graph; ANOVA corrected for multiple comparisons shows statistically significant difference between groups, p = 0.001262), and nuclear membrane pathology (right graph; ANOVA corrected for multiple comparisons shows statistically significant difference between groups, p = 0.000238), examined using digital and blinded manual assessment of images represented in a. d Graphs demonstrating neuronal cytoplasmic pathologies including cytoplasmic puncta (left graph; ANOVA corrected for multiple comparisons shows statistically significant difference between groups, p = 0.0025), neuropil staining (centre graph; ANOVA corrected for multiple comparisons shows statistically significant difference between groups, p = 0.964), and cytoplamsic staining area (right graph; ANOVA corrected for multiple comparisons shows statistically significant difference between groups, p = 0.4019), examined using digital and blinded manual assessment of images represented in i

References

    1. Akiyama T, Koike Y, Petrucelli L, Gitler AD. Cracking the cryptic code in amyotrophic lateral sclerosis and frontotemporal dementia: towards therapeutic targets and biomarkers. Clin Transl Med. 2022;12:e818. doi: 10.1002/ctm2.818. - DOI - PMC - PubMed
    1. Altman T, Ionescu A, Ibraheem A, Priesmann D, Gradus-Pery T, Farberov L, et al. Axonal TDP-43 condensates drive neuromuscular junction disruption through inhibition of local synthesis of nuclear encoded mitochondrial proteins. Nat Commun. 2021;12:6914. doi: 10.1038/s41467-021-27221-8. - DOI - PMC - PubMed
    1. Banerjee P, Elliott E, Rifai OM, O'Shaughnessy J, McDade K, Abrahams S, et al. NLRP3 inflammasome as a key molecular target underlying cognitive resilience in amyotrophic lateral sclerosis. J Pathol. 2022;256:262–268. doi: 10.1002/path.5846. - DOI - PubMed
    1. Bankhead P, Loughrey MB, Fernández JA, Dombrowski Y, McArt DG, Dunne PD, et al. QuPath: open source software for digital pathology image analysis. Sci Rep. 2017;7:16878. doi: 10.1038/s41598-017-17204-5. - DOI - PMC - PubMed
    1. Baughn MW, Melamed Z, López-Erauskin J, Beccari MS, Ling K, Zuberi A, et al. Mechanism of STMN2 cryptic splice-polyadenylation and its correction for TDP-43 proteinopathies. Science. 2023;379:1140–1149. doi: 10.1126/science.abq5622. - DOI - PMC - PubMed

Publication types