

Transcriptomics-driven metabolic pathway analysis reveals similar alterations in lipid metabolism in mouse MASH model and human
- PMID: 38443644
- PMCID: PMC10914730
- DOI: 10.1038/s43856-024-00465-3
Transcriptomics-driven metabolic pathway analysis reveals similar alterations in lipid metabolism in mouse MASH model and human
Abstract
Background: Metabolic dysfunction-associated steatotic liver disease (MASLD) is a prevalent chronic liver disease worldwide, and can rapidly progress to metabolic dysfunction-associated steatohepatitis (MASH). Accurate preclinical models and methodologies are needed to understand underlying metabolic mechanisms and develop treatment strategies. Through meta-analysis of currently proposed mouse models, we hypothesized that a diet- and chemical-induced MASH model closely resembles the observed lipid metabolism alterations in humans.
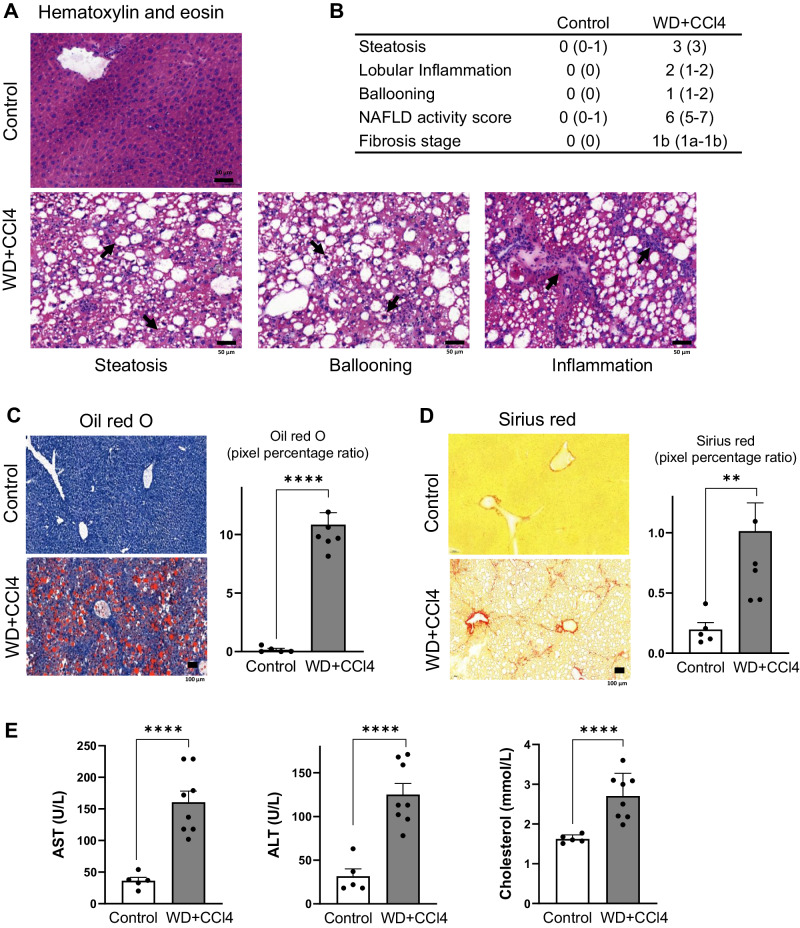
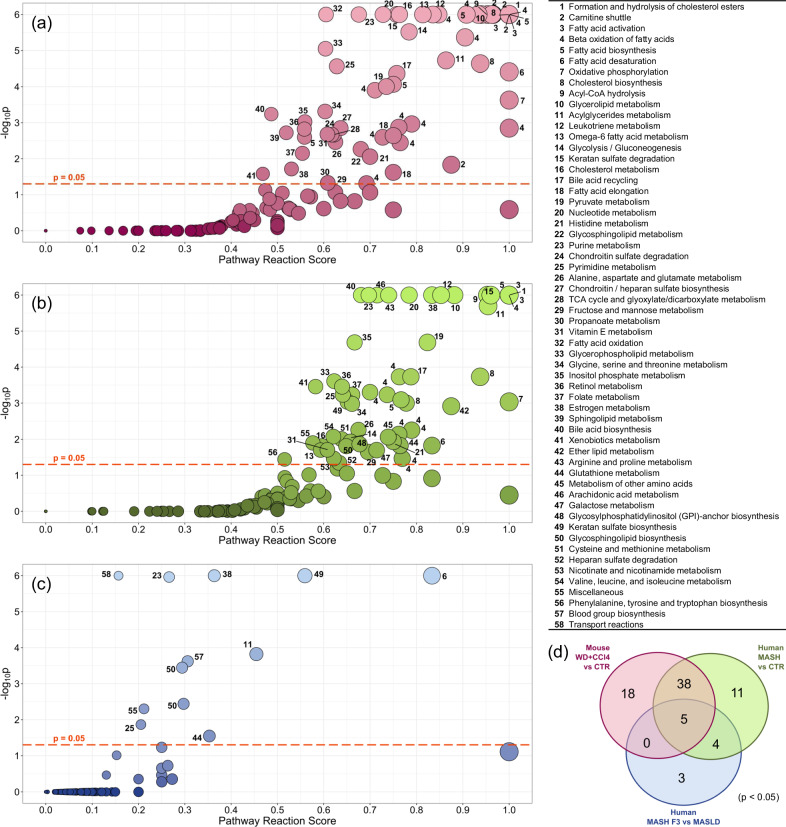
Methods: We developed transcriptomics-driven metabolic pathway analysis (TDMPA), a method to aid in the evaluation of metabolic resemblance. TDMPA uses genome-scale metabolic models to calculate enzymatic reaction perturbations from gene expression data. We performed TDMPA to score and compare metabolic pathway alterations in MASH mouse models to human MASH signatures. We used an already-established WD+CCl4-induced MASH model and performed functional assays and lipidomics to confirm TDMPA findings.
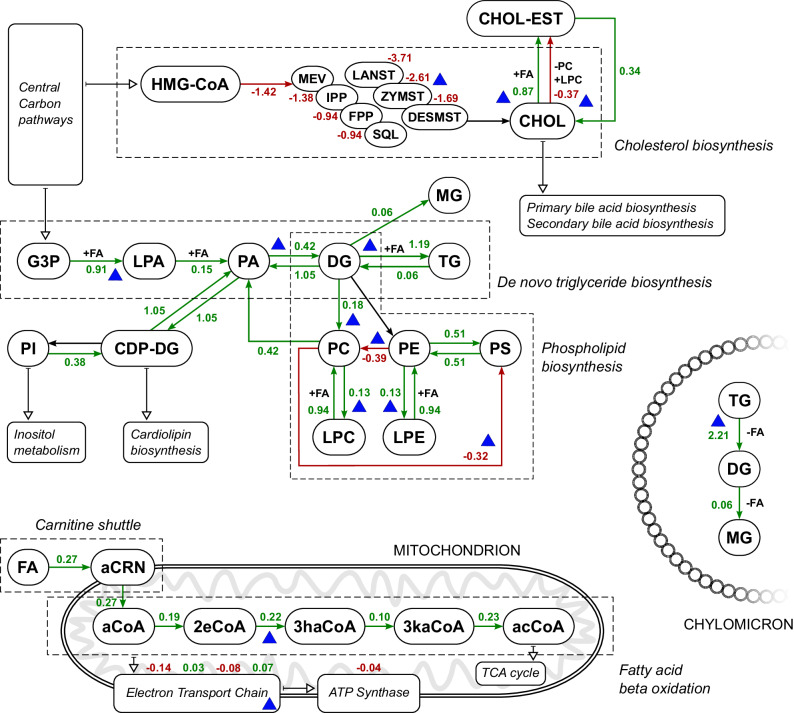
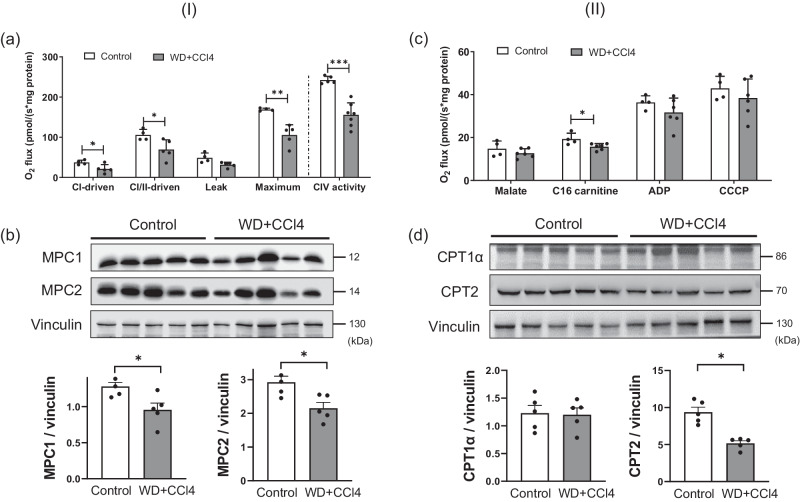
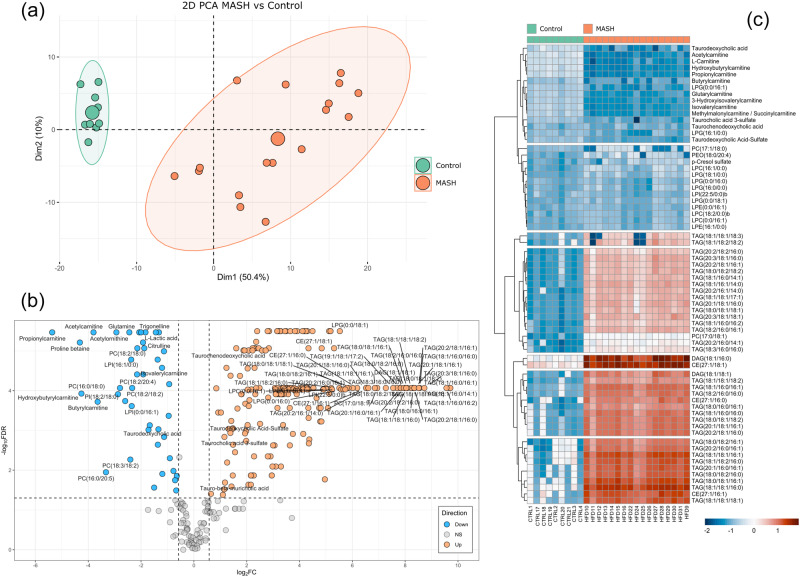
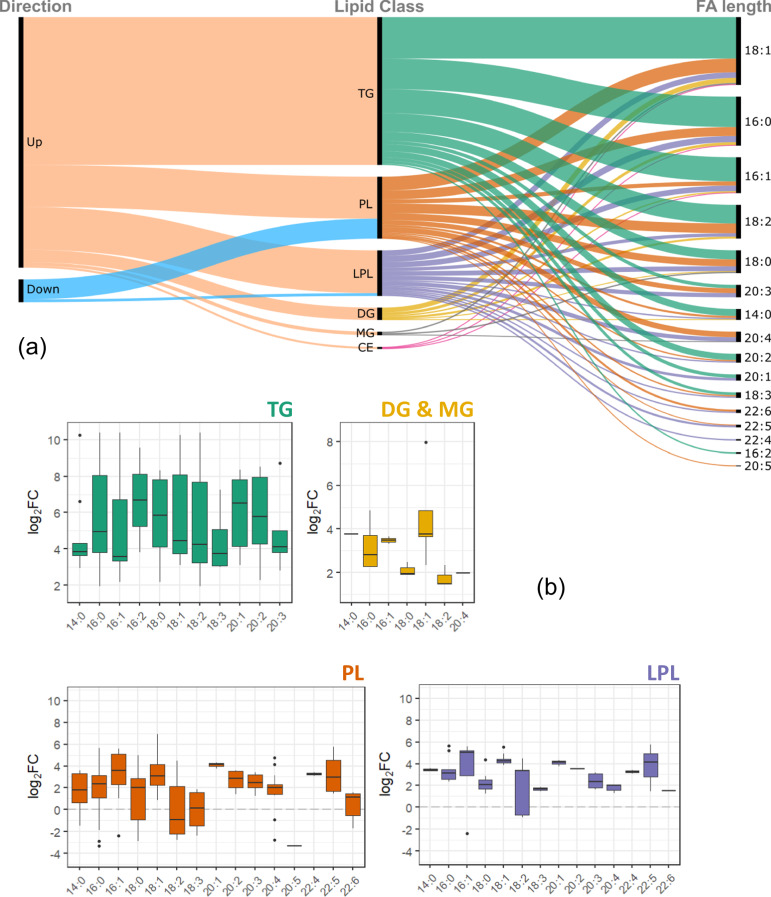
Results: Both human MASH and mouse models exhibit numerous altered metabolic pathways, including triglyceride biosynthesis, fatty acid beta-oxidation, bile acid biosynthesis, cholesterol metabolism, and oxidative phosphorylation. We confirm a significant reduction in mitochondrial functions and bioenergetics, as well as in acylcarnitines for the mouse model. We identify a wide range of lipid species within the most perturbed pathways predicted by TDMPA. Triglycerides, phospholipids, and bile acids are increased significantly in mouse MASH liver, confirming our initial observations.
Conclusions: We introduce TDMPA, a methodology for evaluating metabolic pathway alterations in metabolic disorders. By comparing metabolic signatures that typify human MASH, we show a good metabolic resemblance of the WD+CCl4 mouse model. Our presented approach provides a valuable tool for defining metabolic space to aid experimental design for assessing metabolism.
Plain language summary
Steatotic liver disease, in which fat accumulates in the liver, is one of the most prevalent liver diseases worldwide and it is important to develop relevant animal models to help us understand its mechanisms. We aimed to assess the suitability of animal models for studying steatotic liver disease in humans. We developed an approach that evaluates how genes affect the metabolism or the chemical reactions and processes that occur in the body. We used it to compare a mouse model of the disease with human observations. Our results showed that there are significant changes in fat and energy metabolism in the mouse model. These observations match with changes observed in humans, suggesting it is a good model for studying human disease. Our findings could advance our understanding of the disease as well as help define strategies for its treatment.
© 2024. The Author(s).
Conflict of interest statement
The authors declare no competing interests.
Figures
Similar articles
-
Spatial Transcriptomics Reveals the Transcriptomic Signatures in a Mouse Model of Pediatric Metabolic Dysfunction-Associated Steatohepatitis.Am J Pathol. 2024 Dec;194(12):2341-2355. doi: 10.1016/j.ajpath.2024.08.008. Epub 2024 Aug 31. Am J Pathol. 2024. PMID: 39222909
-
Spatial lipidomics reveals zone-specific hepatic lipid alteration and remodeling in metabolic dysfunction-associated steatohepatitis.J Lipid Res. 2024 Sep;65(9):100599. doi: 10.1016/j.jlr.2024.100599. Epub 2024 Jul 18. J Lipid Res. 2024. PMID: 39032559 Free PMC article.
-
Time-of-day-dependent variation of the human liver transcriptome and metabolome is disrupted in MASLD.JHEP Rep. 2023 Oct 27;6(1):100948. doi: 10.1016/j.jhepr.2023.100948. eCollection 2024 Jan. JHEP Rep. 2023. PMID: 38125300 Free PMC article.
-
The Lasting Effects of COVID-19 on the Progression of Metabolic Dysfunction-Associated Steatotic Liver Disease (MASLD).Cureus. 2023 Sep 14;15(9):e45231. doi: 10.7759/cureus.45231. eCollection 2023 Sep. Cureus. 2023. PMID: 37842470 Free PMC article. Review.
-
Lipid metabolism in MASLD and MASH: From mechanism to the clinic.JHEP Rep. 2024 Aug 9;6(12):101185. doi: 10.1016/j.jhepr.2024.101185. eCollection 2024 Dec. JHEP Rep. 2024. PMID: 39583092 Free PMC article. Review.
Cited by
-
Deciphering per- and polyfluoroalkyl substances mode of action: comparative gene expression analysis in human liver spheroids.Toxicol Sci. 2025 May 1;205(1):124-142. doi: 10.1093/toxsci/kfaf023. Toxicol Sci. 2025. PMID: 40037795 Free PMC article.
-
Atlas-scale metabolic activities inferred from single-cell and spatial transcriptomics.bioRxiv [Preprint]. 2025 May 14:2025.05.09.653038. doi: 10.1101/2025.05.09.653038. bioRxiv. 2025. PMID: 40463045 Free PMC article. Preprint.
-
Ubiquinol-mediated suppression of mitochondria-associated ferroptosis is a targetable function of lactate dehydrogenase B in cancer.Nat Commun. 2025 Mar 16;16(1):2597. doi: 10.1038/s41467-025-57906-3. Nat Commun. 2025. PMID: 40090955 Free PMC article.
-
Molecular spectroscopy of blood plasma differentiates metabolic dysfunction-associated steatohepatitis from steatosis.J Transl Med. 2025 Aug 6;23(1):868. doi: 10.1186/s12967-025-06885-6. J Transl Med. 2025. PMID: 40770723 Free PMC article.
-
Novel translational mouse models of metabolic dysfunction-associated steatotic liver disease comparable to human MASLD with severe obesity.Mol Metab. 2025 Mar;93:102104. doi: 10.1016/j.molmet.2025.102104. Epub 2025 Jan 22. Mol Metab. 2025. PMID: 39855563 Free PMC article.
References
-
- Rinella, M. E. et al. A multi-society Delphi consensus statement on new fatty liver disease nomenclature. J. Hepatol.78, 1966–1986 (2023). - PubMed
Grants and funding
LinkOut - more resources
Full Text Sources
Molecular Biology Databases
