. 2024 Apr;30(4):1065-1074.
doi: 10.1038/s41591-024-02865-3. Epub 2024 Mar 5.

Multi-ancestry polygenic mechanisms of type 2 diabetes

Affiliations

Multi-ancestry polygenic mechanisms of type 2 diabetes

Kirk Smith et al. Nat Med. 2024 Apr.

Erratum in

  • Author Correction: Multi-ancestry polygenic mechanisms of type 2 diabetes.
    Smith K, Deutsch AJ, McGrail C, Kim H, Hsu S, Huerta-Chagoya A, Mandla R, Schroeder PH, Westerman KE, Szczerbinski L, Majarian TD, Kaur V, Williamson A, Zaitlen N, Claussnitzer M, Florez JC, Manning AK, Mercader JM, Gaulton KJ, Udler MS. Smith K, et al. Nat Med. 2024 Jul;30(7):2091. doi: 10.1038/s41591-024-03066-8. Nat Med. 2024. PMID: 38760590 No abstract available.

Abstract

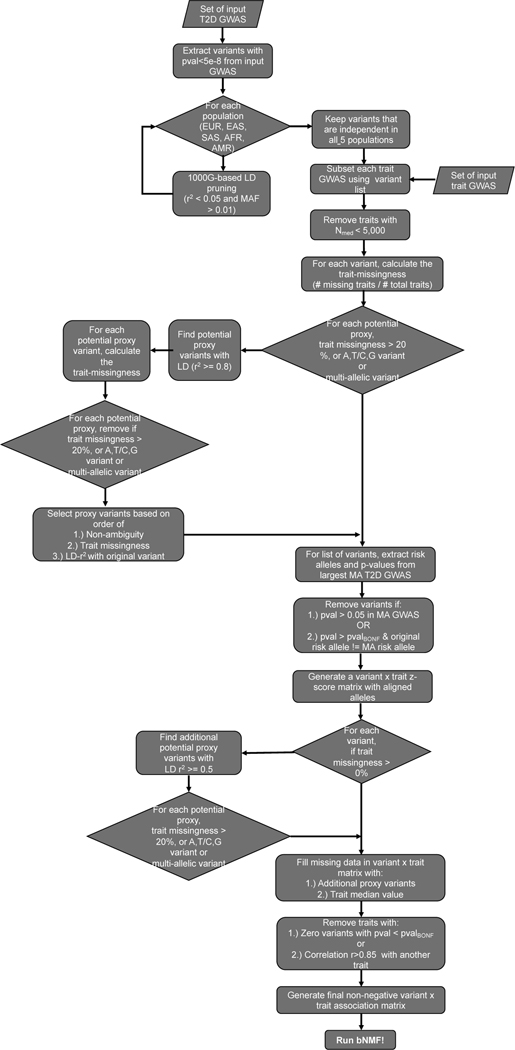
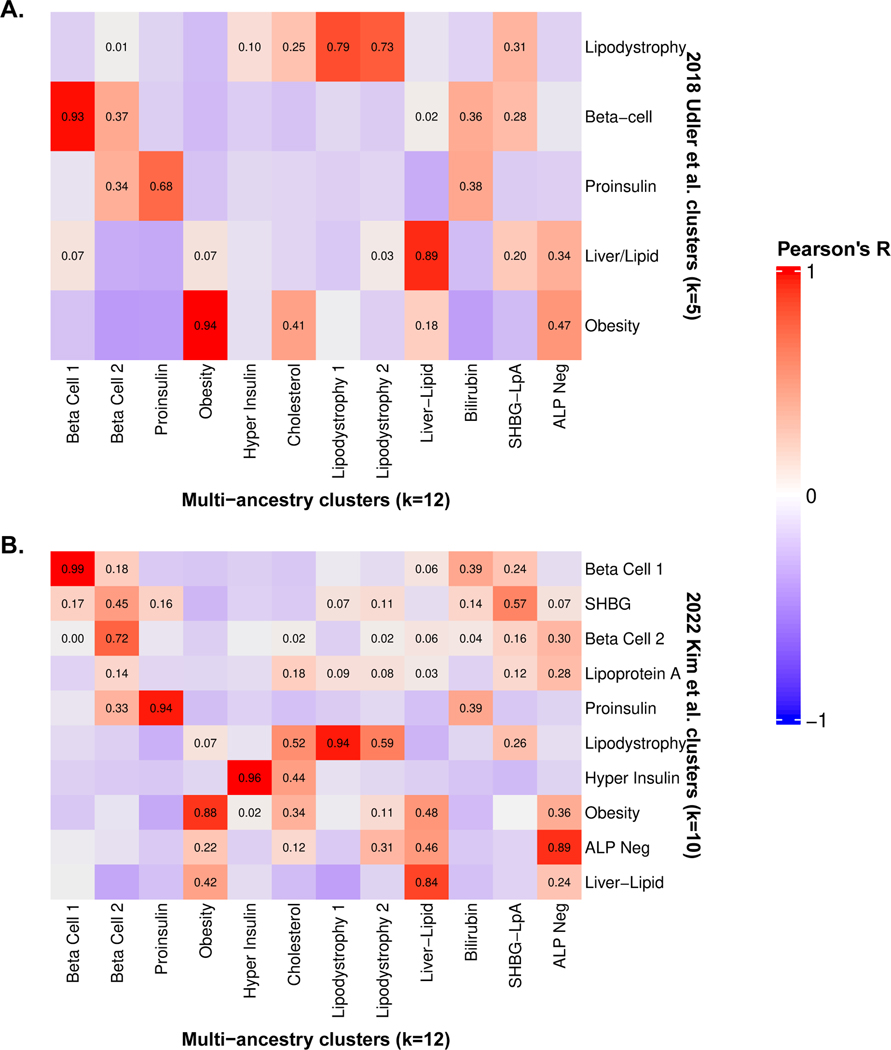
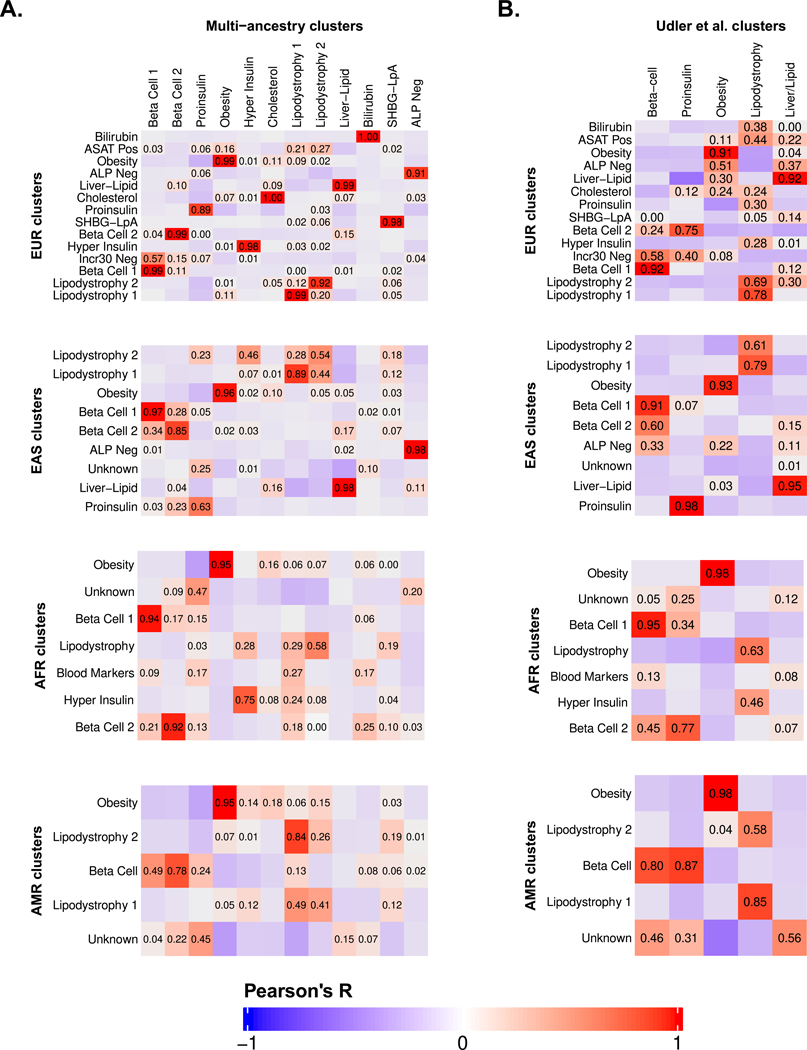
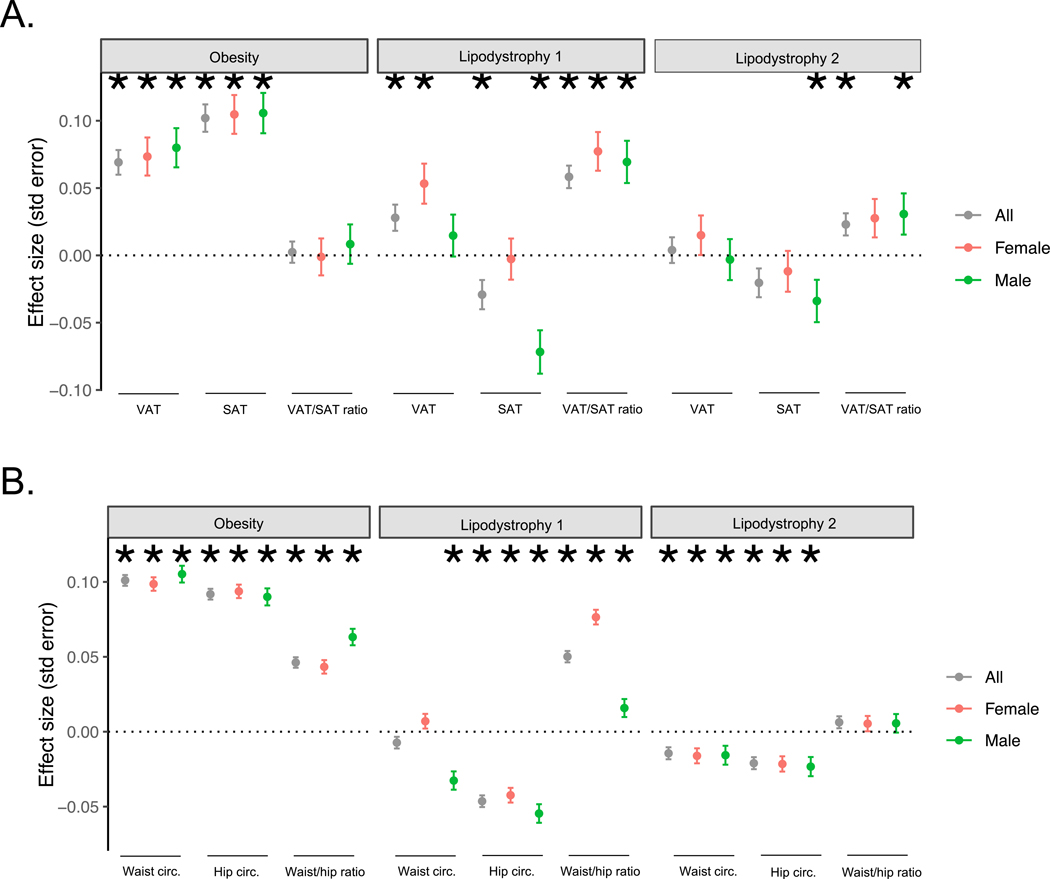
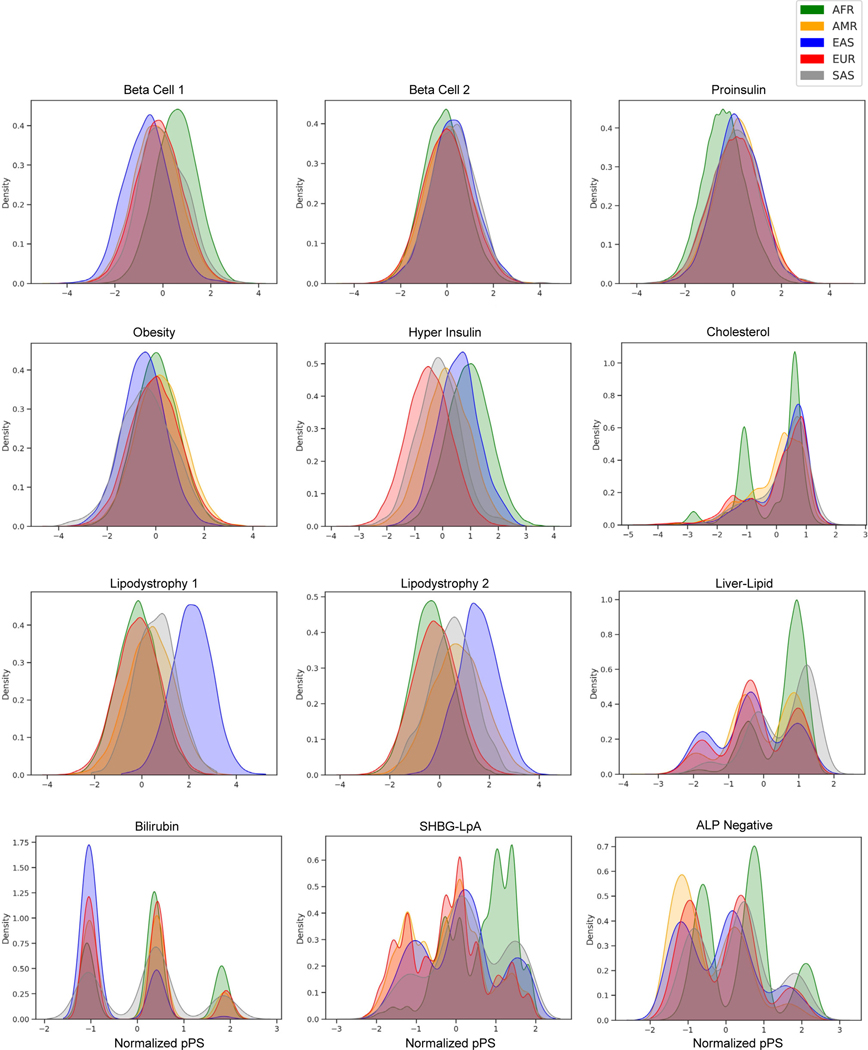
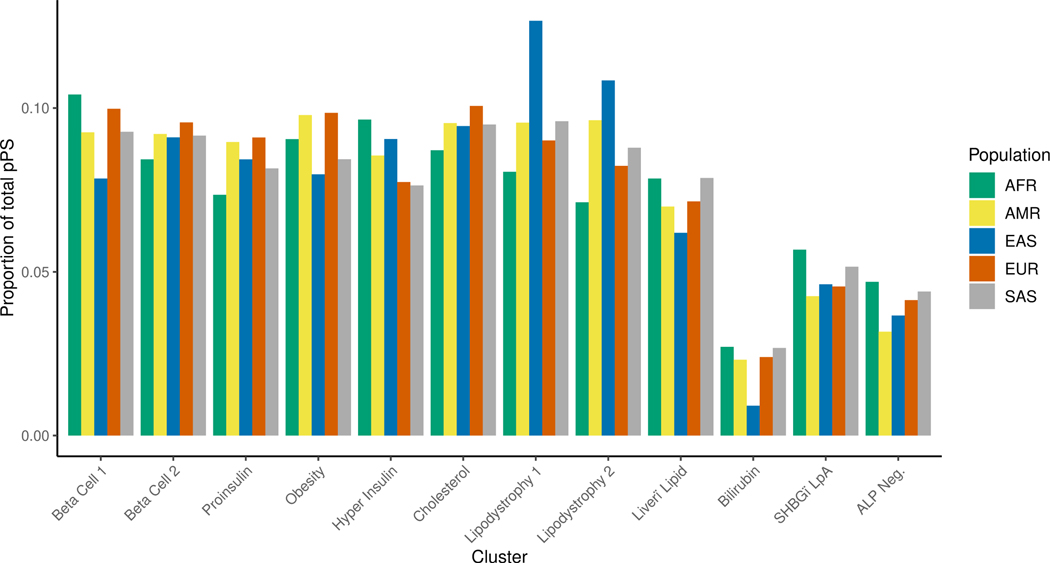
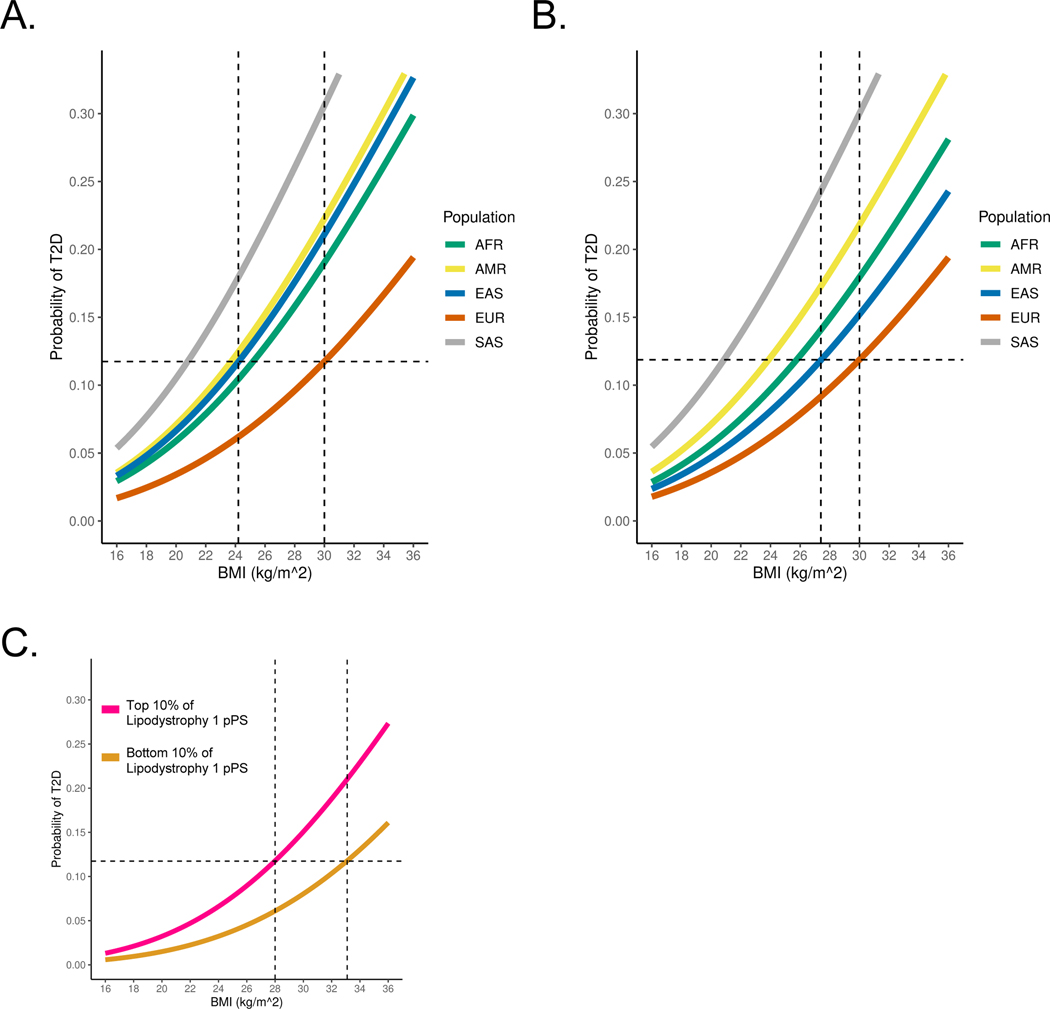
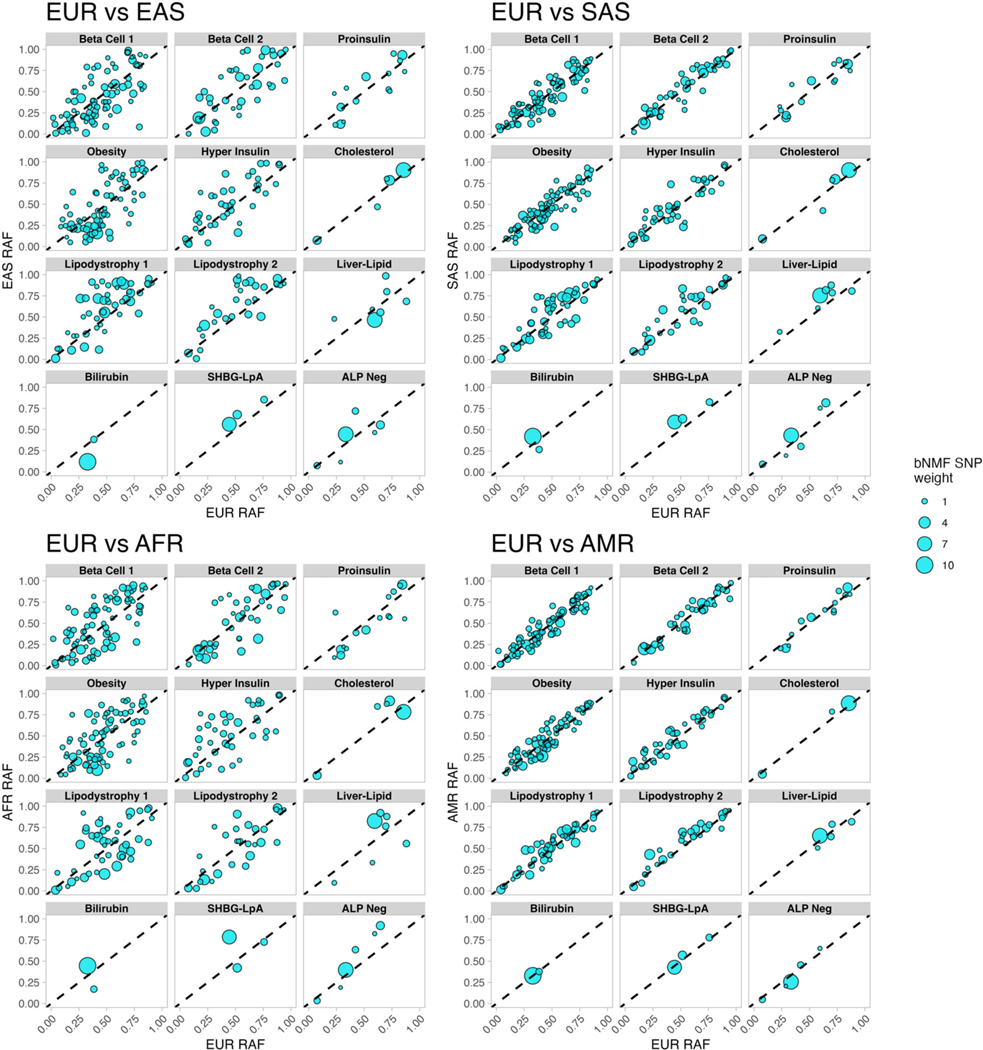
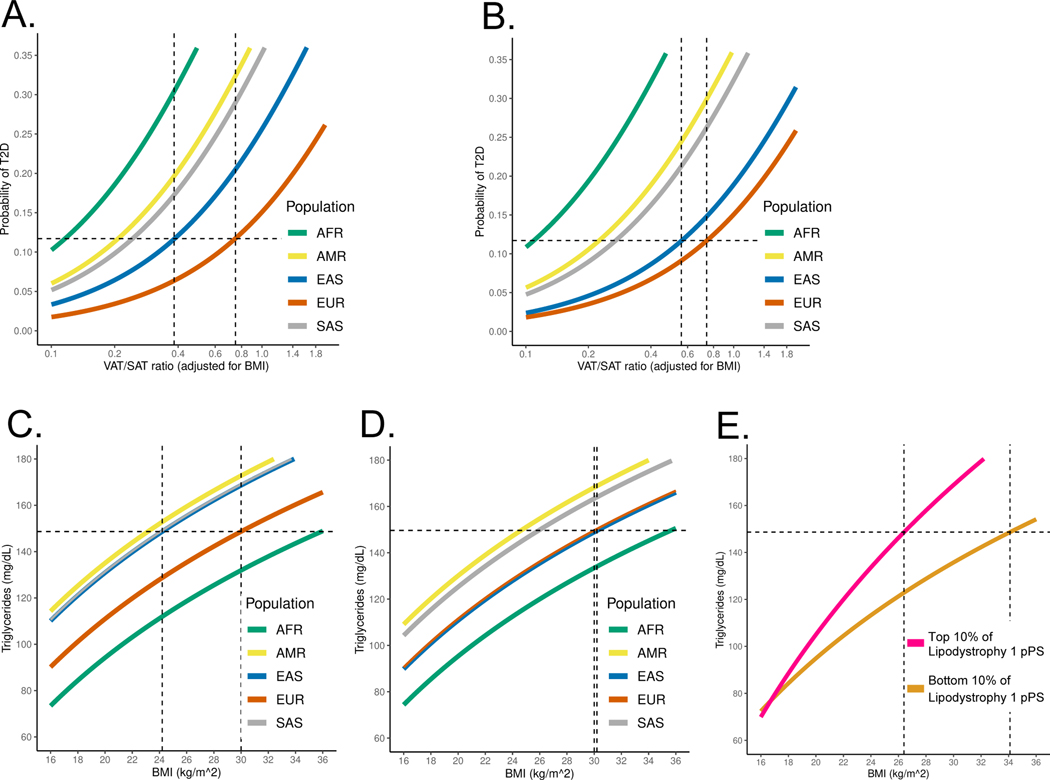
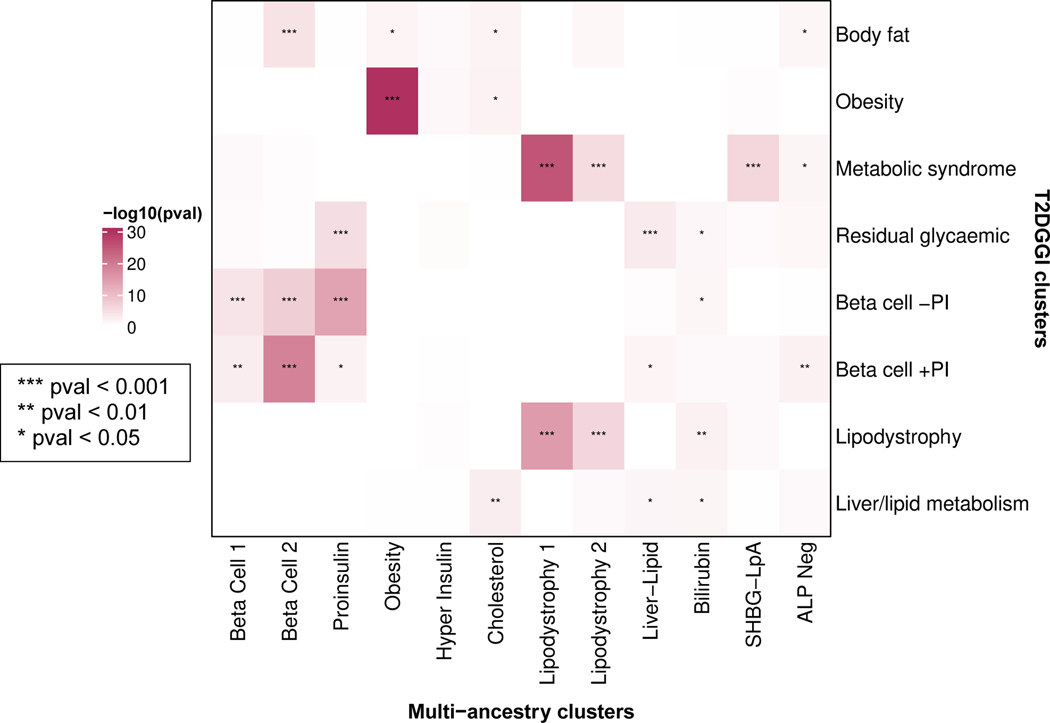
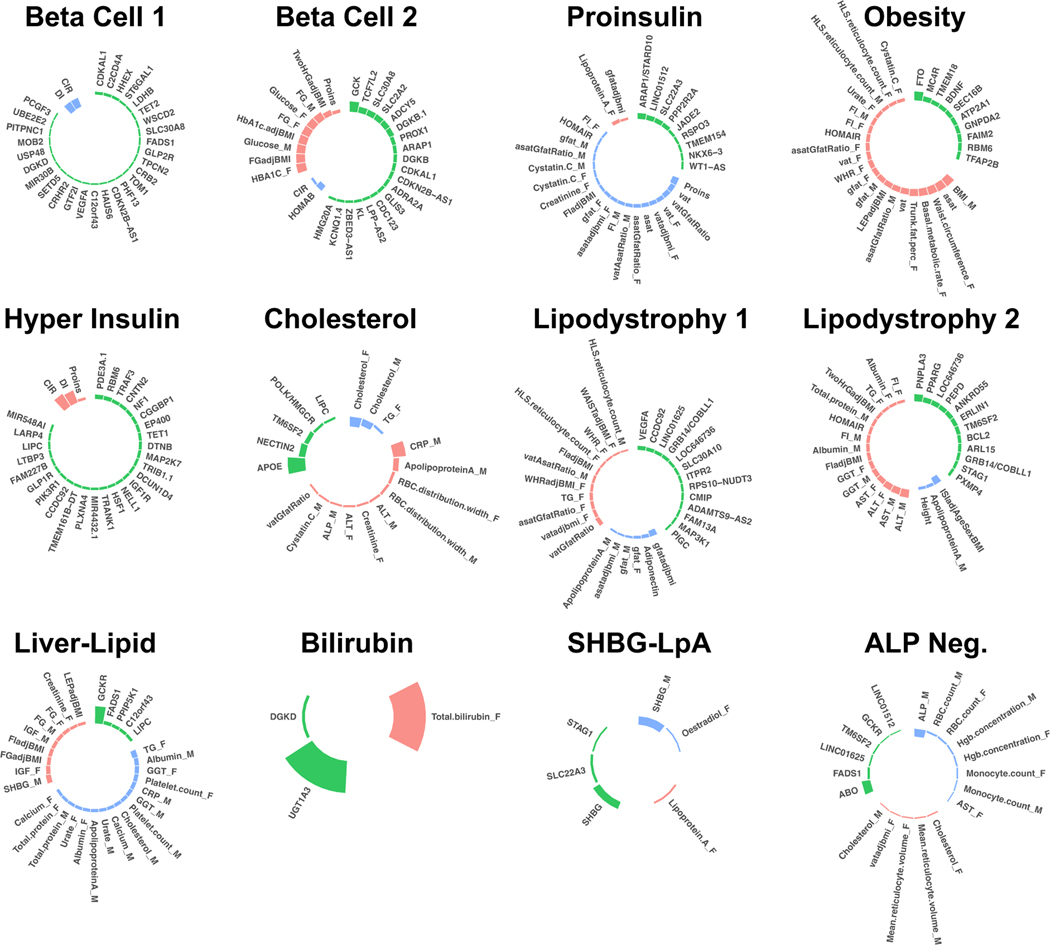
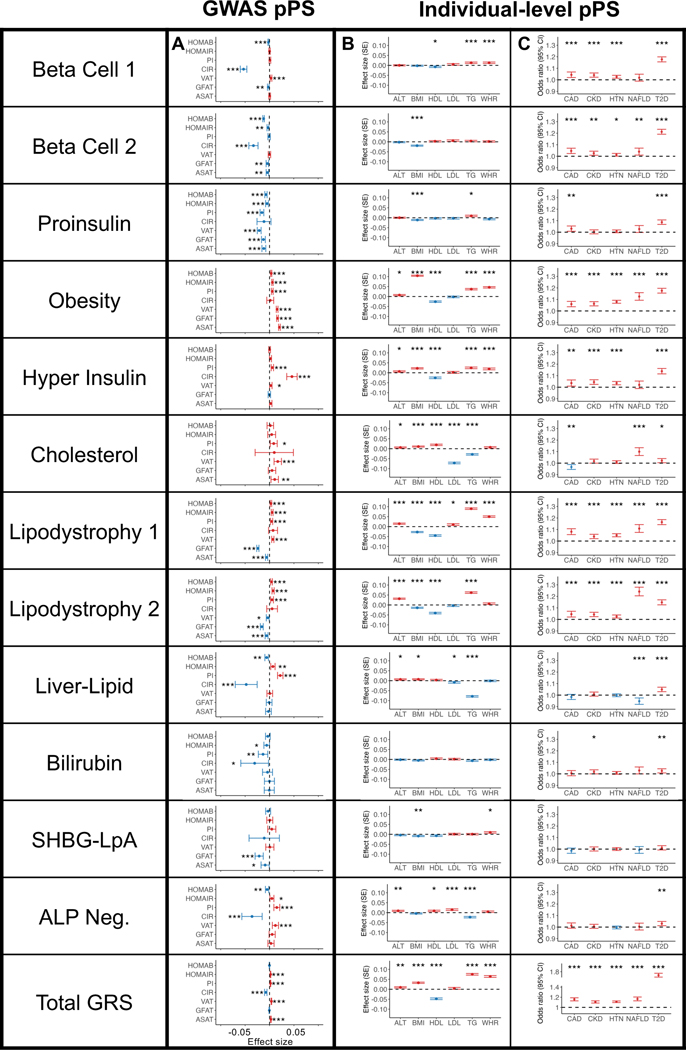
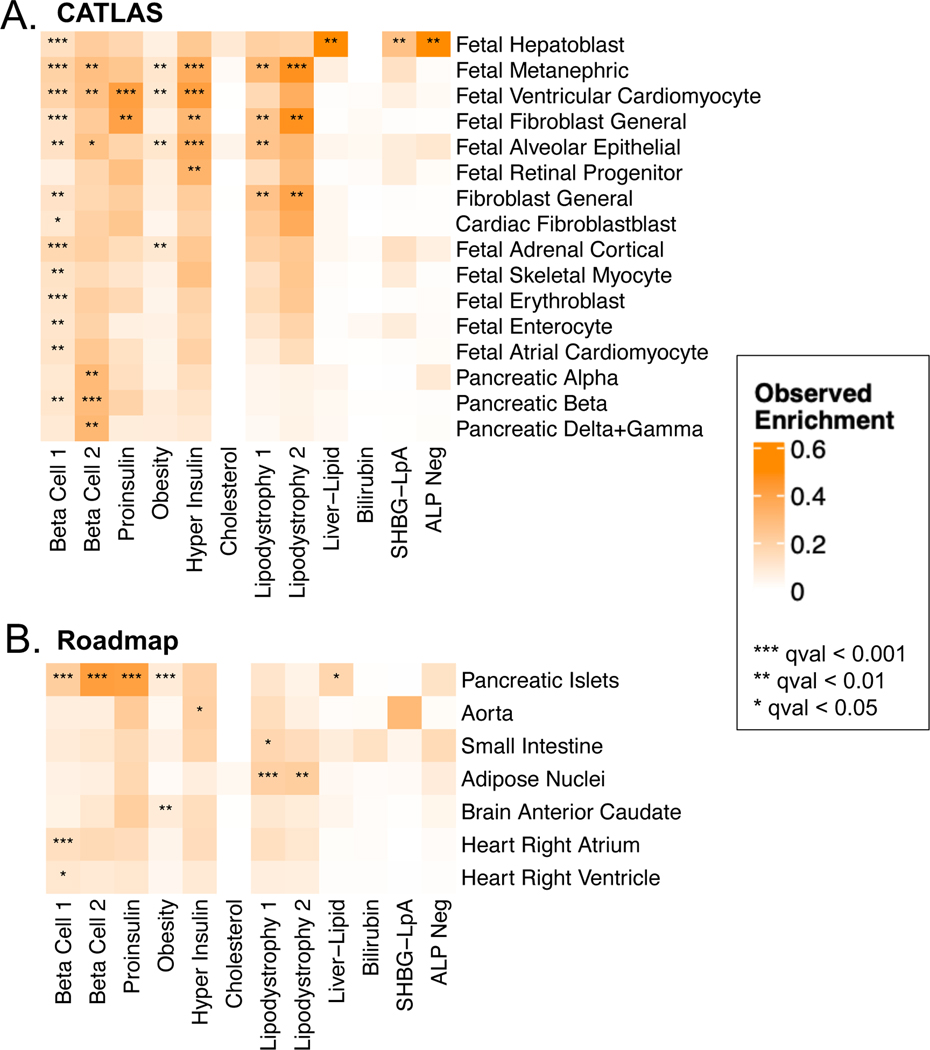
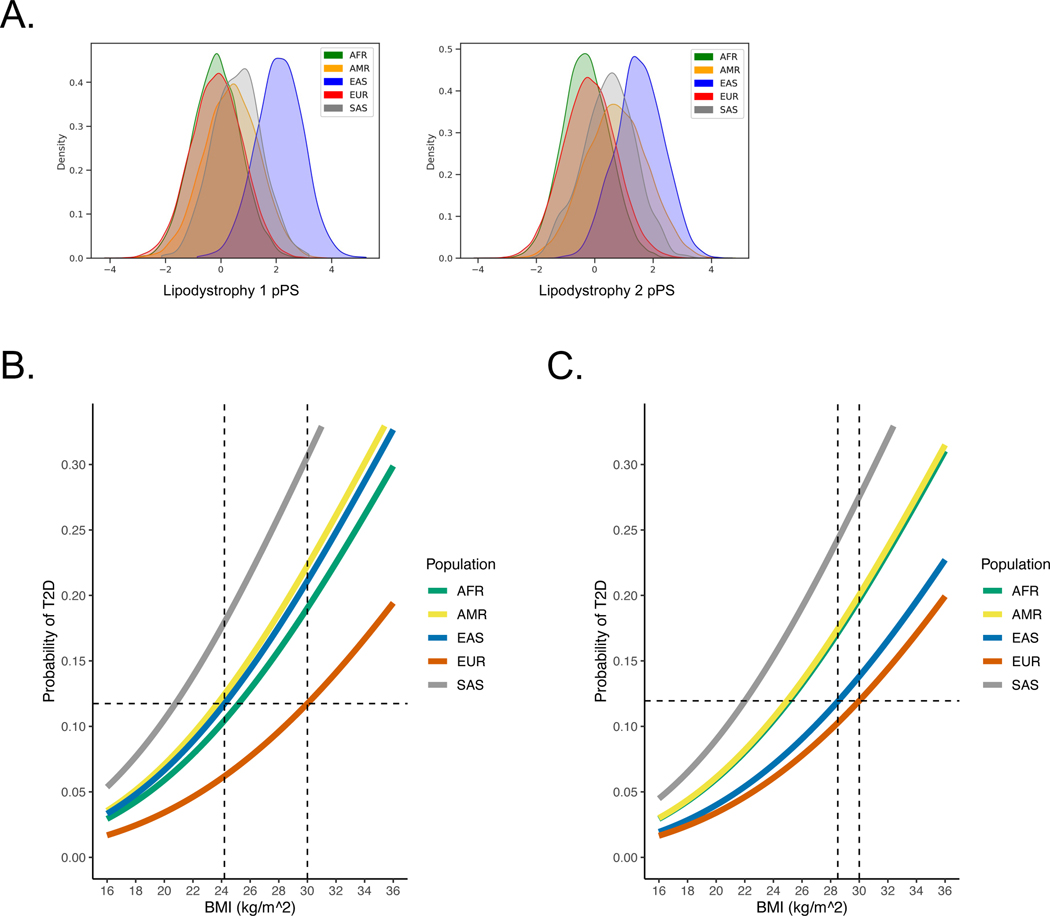
Type 2 diabetes (T2D) is a multifactorial disease with substantial genetic risk, for which the underlying biological mechanisms are not fully understood. In this study, we identified multi-ancestry T2D genetic clusters by analyzing genetic data from diverse populations in 37 published T2D genome-wide association studies representing more than 1.4 million individuals. We implemented soft clustering with 650 T2D-associated genetic variants and 110 T2D-related traits, capturing known and novel T2D clusters with distinct cardiometabolic trait associations across two independent biobanks representing diverse genetic ancestral populations (African, n = 21,906; Admixed American, n = 14,410; East Asian, n =2,422; European, n = 90,093; and South Asian, n = 1,262). The 12 genetic clusters were enriched for specific single-cell regulatory regions. Several of the polygenic scores derived from the clusters differed in distribution among ancestry groups, including a significantly higher proportion of lipodystrophy-related polygenic risk in East Asian ancestry. T2D risk was equivalent at a body mass index (BMI) of 30 kg m-2 in the European subpopulation and 24.2 (22.9-25.5) kg m-2 in the East Asian subpopulation; after adjusting for cluster-specific genetic risk, the equivalent BMI threshold increased to 28.5 (27.1-30.0) kg m-2 in the East Asian group. Thus, these multi-ancestry T2D genetic clusters encompass a broader range of biological mechanisms and provide preliminary insights to explain ancestry-associated differences in T2D risk profiles.


Figures

Extended Data Fig. 1.
Overview of high-throughput bNMF pipeline for multiancestry (MA) clusters.
Extended Data Fig. 2.
The multi-ancestry clusters recapture several key pathways that were identified in our previous papers.
Extended Data Fig. 3.
Common T2D genetic clusters are shared across individual ancestry groups.
Extended Data Fig. 4.
Sex-stratified association of multi-ancestry T2D genetic clusters with anthropometric traits.
Extended Data Fig. 5.
Variation in distribution of multi-ancestry T2D genetic clusters across ancestry groups .
Extended Data Fig. 6.
Proportion of total T2D genetic risk attributable to each multiancestry T2D cluster.
Extended Data Fig. 7.
Validation of relationship between T2D genetic clusters, BMI, and T2D risk.
Extended Data Fig. 8.
Comparison of cluster-specific risk allele frequencies (RAF) in EUR and other ancestry groups.
Extended Data Fig. 9.
Ancestry-specific variation in adipose volume and triglycerides.
Extended Data Fig. 10.
Conservation of biological pathways between the multiancestry and T2DGGI clusters.
Fig. 1.
Fig. 1.. Key loci and traits of multi-ancestry T2D genetic clusters
Each plot displays the top-weighted loci and traits within each multi-ancestry T2D genetic cluster. The length of the bars corresponds to the cluster weight determined by the bNMF algorithm. Green bars represent genetic loci, red bars represent traits with increased values, and blue bars represent traits with decreased values within each cluster. Female- and male-specific traits are appended with “_F” and “_M”, respectively. A maximum of 30 elements (loci and traits) with the highest weights are displayed in each cluster. A legend for all abbreviations is included in Supplementary Table 3.
Fig. 2.
Fig. 2.. Multi-ancestry T2D genetic cluster associations with continuous traits and clinical phenotypes
(A) Each plot displays associations between selected multi-ancestry T2D genetic clusters and selected continuous outcomes, based on GWAS-partitioned pPS. Each dot indicates the beta coefficient from a meta-analysis of GWAS summary statistics. Error bars represent the 95% confidence interval. PI, proinsulin; CIR, corrected insulin response; VAT, visceral adipose tissue; GFAT, gluteofemoral adipose tissue; ASAT, abdominal subcutaneous adipose tissue. (B) Each plot displays cluster associations with selected continuous outcomes, based on individual-level pPS obtained from a meta-analysis of MGB Biobank and All of Us. Each outcome was normalized to a standard normal distribution. Each dot indicates the effect per one standard deviation increase in the pPS. Error bars represent the standard error from a linear regression model. (C) Each plot displays cluster-specific odds ratios of selected clinical phenotypes, based on individual-level pPS obtained from a meta-analysis of MGB Biobank and All of Us. Each dot represents the odds ratios per one standard deviation increase in the pPS. Error bars represent the 95% confidence interval. For all components, positive associations are colored in red and negative associations are colored in blue. P values were obtained from two-sided t tests and are indicated with asterisks (* P < 0.05, ** P < 0.01, *** P < 0.001). A legend for all abbreviations is included in Supplementary Table 3. Complete statistics (including exact P values and the number of individuals measured for each phenotype) are provided in Supplementary Table 10 (Panel A), Supplementary Table 12 (Panel B), and Supplementary Table 15 (Panel C).
Fig. 3.
Fig. 3.. Enrichment for cell type specific enhancers in multi-ancestry type 2 diabetes clusters.
Heatmaps display the significant cluster-specific enrichment of genomic annotations, represented by cumulative posterior probability, in (A) CATLAS single cell accessible chromatin data from 222 cell types and (B) Epigenomic Roadmap chromatin state calls from 28 cell types. Q values were corrected for false discovery rate (FDR). For both analyses, only cell types with at least one association of FDR < 0.1 are included in the figure, with additional data in Supplementary Table 17.
Fig. 4.
Fig. 4.. Ancestry-specific relationship between T2D genetic clusters, BMI, and T2D risk
(A) Ancestry-specific distribution of Lipodystrophy 1 and Lipodystrophy 2 pPS (normalized to a standard normal distribution). (B) Relationship between BMI and T2D risk (unadjusted), classified by genetic ancestry. T2D risk was assessed in a logistic regression model, controlling for age, sex, BMI, and genetic ancestry group. The horizontal dashed line represents the T2D risk for participants with European genetic ancestry and a BMI of 30 kg/m2 (typically used to define obesity). The vertical dashed lines indicate the BMI thresholds needed to develop an equivalent risk of T2D in the European and East Asian ancestry groups. (C) Relationship between BMI and T2D risk, adjusted for Lipodystrophy 1 pPS and Lipodystrophy 2 pPS. All analyses were performed in a meta-analysis of MGB Biobank and All of Us.

Update of

References

    1. Tobias DK et al. Second international consensus report on gaps and opportunities for the clinical translation of precision diabetes medicine. Nat. Med 29, 2438–2457 (2023). - PMC - PubMed
    1. Misra S et al. Precision subclassification of type 2 diabetes: a systematic review. Commun. Med. (Lond.) 3, 138 (2023). - PMC - PubMed
    1. Udler MS et al. Type 2 diabetes genetic loci informed by multi-trait associations point to disease mechanisms and subtypes: A soft clustering analysis. PLoS Med. 15, e1002654 (2018). - PMC - PubMed
    1. Kim H et al. High-throughput genetic clustering of type 2 diabetes loci reveals heterogeneous mechanistic pathways of metabolic disease. Diabetologia 66, 495–507 (2023). - PMC - PubMed
    1. Mahajan A et al. Refining the accuracy of validated target identification through coding variant fine-mapping in type 2 diabetes. Nat. Genet 50, 559–571 (2018). - PMC - PubMed