

Loss of chromosome Y in regulatory T cells
- PMID: 38443832
- PMCID: PMC10913415
- DOI: 10.1186/s12864-024-10168-7
Loss of chromosome Y in regulatory T cells
Abstract
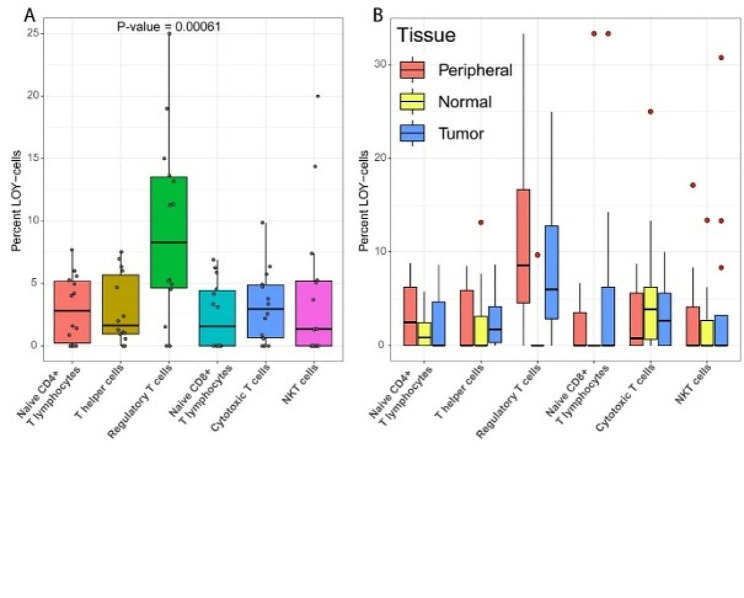
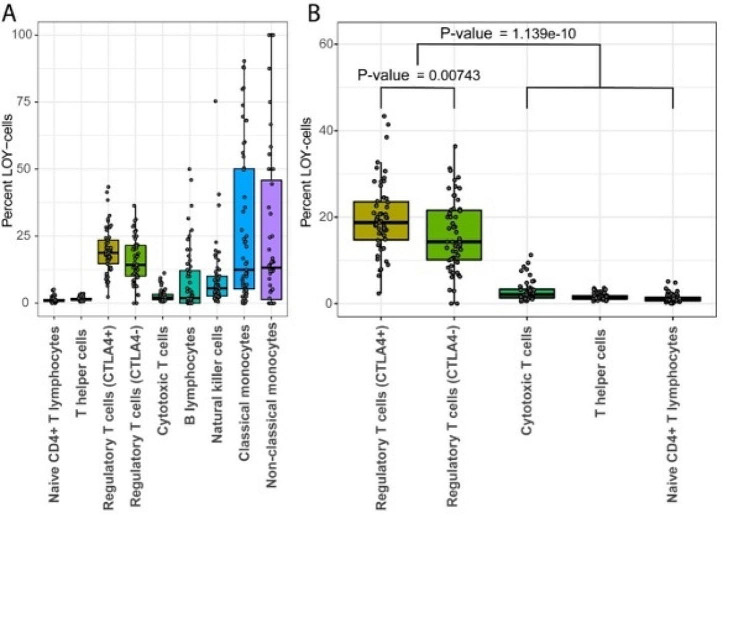
Background: Mosaic loss of chromosome Y (LOY) in leukocytes is the most prevalent somatic aneuploidy in aging humans. Men with LOY have increased risks of all-cause mortality and the major causes of death, including many forms of cancer. It has been suggested that the association between LOY and disease risk depends on what type of leukocyte is affected with Y loss, with prostate cancer patients showing higher levels of LOY in CD4 + T lymphocytes. In previous studies, Y loss has however been observed at relatively low levels in this cell type. This motivated us to investigate whether specific subsets of CD4 + T lymphocytes are particularly affected by LOY. Publicly available, T lymphocyte enriched, single-cell RNA sequencing datasets from patients with liver, lung or colorectal cancer were used to study how LOY affects different subtypes of T lymphocyte. To validate the observations from the public data, we also generated a single-cell RNA sequencing dataset comprised of 23 PBMC samples and 32 CD4 + T lymphocytes enriched samples.
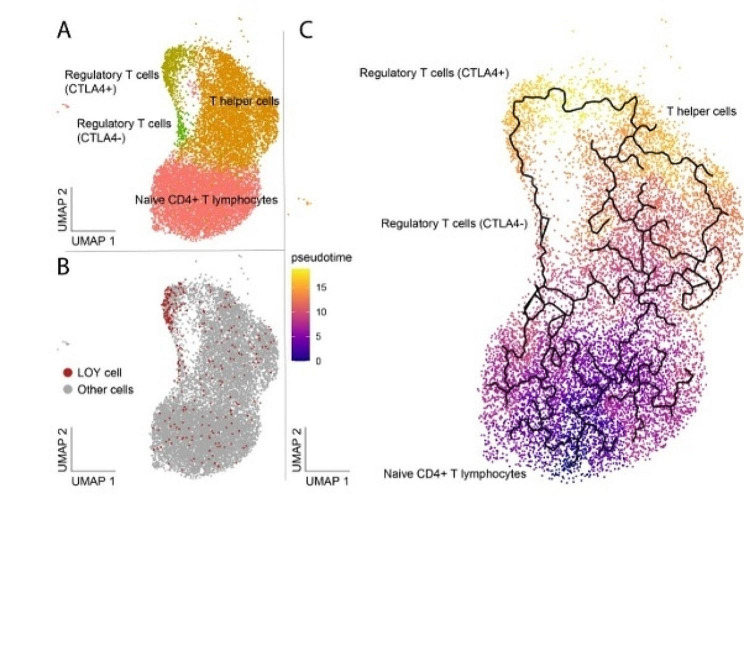
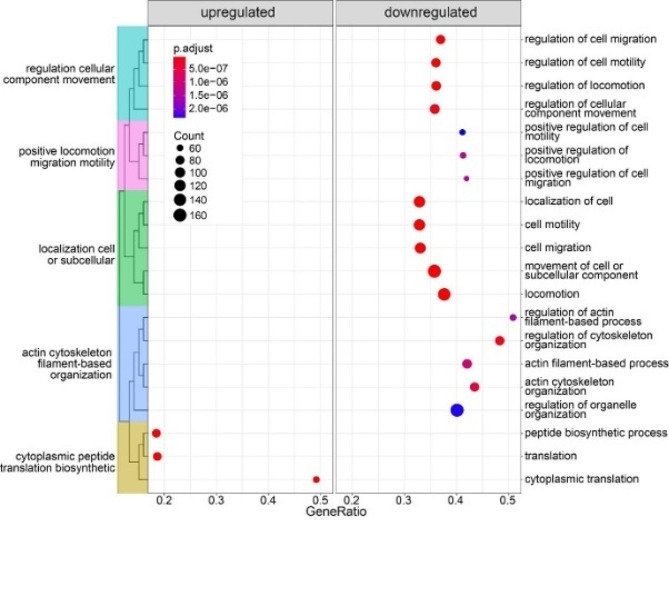
Results: Regulatory T cells had significantly more LOY than any other studied T lymphocytes subtype. Furthermore, LOY in regulatory T cells increased the ratio of regulatory T cells compared with other T lymphocyte subtypes, indicating an effect of Y loss on lymphocyte differentiation. This was supported by developmental trajectory analysis of CD4 + T lymphocytes culminating in the regulatory T cells cluster most heavily affected by LOY. Finally, we identify dysregulation of 465 genes in regulatory T cells with Y loss, many involved in the immunosuppressive functions and development of regulatory T cells.
Conclusions: Here, we show that regulatory T cells are particularly affected by Y loss, resulting in an increased fraction of regulatory T cells and dysregulated immune functions. Considering that regulatory T cells plays a critical role in the process of immunosuppression; this enrichment for regulatory T cells with LOY might contribute to the increased risk for cancer observed among men with Y loss in leukocytes.
Keywords: GSEA; Gene set enrichment analysis; LOY; Mosaic loss of chromosome Y; Regulatory T cells; Single-cell RNA sequencing; Tregs; scRNA-seq; scRNAseq.
© 2024. The Author(s).
Conflict of interest statement
J.P.D. and L.A.F. are cofounders and shareholders in Cray Innovation AB. The remaining authors declare no competing interest.
Figures
References
MeSH terms
LinkOut - more resources
Full Text Sources
Medical
Research Materials
